7. PILOT TEST LOCATION #2: I-405, SEATTLE, WASHINGTON
DESCRIPTION
The next performance measure pilot test was located on Interstate 405 in Bellevue, WA (a suburb of Seattle) between SE 8th street on the north and 112th Avenue SE to the south (2.6 miles). This project was a multi-year reconstruction and widening project to add a travel lane in each direction, widen or reconstruct several bridges in the section to accommodate the additional capacity, and remove the Wilburton tunnel. As of 2007, the most heavily traveled section of I-405 was near SE 8th Street in downtown Bellevue, with an average of 200,000 vpd. Within this section, there are generally three to four travel lanes per direction, some of which are auxiliary lanes between adjacent ramps. The leftmost lane in each direction is designated as an HOV lane that is operational between 5 am and 7 pm (that is, it can be used as a regular travel lane at night). The posted speed limit on this roadway segment is 65mph.
The overall project began in July 2007 and was scheduled to be completed in late 2009. Many of the project tasks involved work activities away from travel lanes behind concrete barriers, on cross-streets to the freeway, etc. For purposes of this pilot test, work activities involving temporary lane closures and potential traffic queuing were targeted. The pilot test duration lasted between July 9 and October 9, 2008 (92 days). During this study period, work activities required the closure of one or more travel lanes at night. A single lane of travel in each direction was allowed to be closed beginning at 8 pm, a second lane could be closed at 10 pm (if necessary), and a third lane could be closed at 11 pm. Over this time period, a total of 43 nights of work activity occurred in the southbound direction of travel, and 39 nights of work activity in the northbound direction. The contractor was not allowed to close lanes on Friday or Saturday nights.
DATA SOURCES
At this location, project field personnel were again asked to fill out a field data collection form to obtain nights and hours work activity, lane closure information (location, duration, number of lanes closed and open), and approximate hourly queue length data on those nights when queues formed. These lane closure and queue length data were then used to estimate work zone exposure measures, as well as average individual vehicle delay and total vehicle-hours of delay during congestion.
In addition to the manual queue length documentation by field personnel, electronic traffic sensor data was available from the regional TMC that has been operational in the Seattle region for a number of years. Along the I-405 segment of interest, a series of inductive loop and non-intrusive traffic sensors have been installed which measure volumes, speeds (at some locations), and sensor occupancies (which are correlated to traffic density). Two types of sensor stations exist in this system:
- Single loop sensors which collect vehicle count data only in the travel lane
- Dual-loop sensor stations that can measure speeds and collect vehicle count data in the travel lane
Non-functional sensors at some sensor locations meant that only one or two lanes of traffic were being recorded. Table 16 and Table 17 provide a summary of the location and types of sensors in this roadway segment. Although the mixture of single and dual loop sensors may serve the TMC functions adequately, they do present a bit of a challenge from the standpoint of monitoring work zone performance. Recall that speed data provide the primary indicator of queuing and is critical to the estimation of travel times (and changes thereof) upstream and through the work zone. Thus, although sensor stations were located at approximately 0.33 to 0.5-mile intervals in this roadway segment, speed sensors were available at about every other or every third set (i.e., at about 1 mile intervals). Further complicating the situation was the fact that individual sensor stations in the vicinity of the lane closures were sometimes non-functional at night when work was occurring, or only provided vehicle count data instead of both vehicle counts and speeds. It is not known whether temporary power disruptions required by work activities were responsible for this loss of data, or whether the quality control algorithms used by the TMC detected perceived “anomalies” in the data and simply discarded them from the database. Either way, the end result was a lack of data on certain nights at critical locations upstream and within the lane closure section.
| Sensor Location | Milepoint | Sensor Type |
|---|---|---|
| NE 37th | 7.00 | V only |
| NE 44th | 7.45 | V only |
| SE 70th | 8.03 | V & S |
| SE 64th | 8.40 | V & S |
| SE 59th | 8.90 | V & S |
| 112th Ave SE | 9.21 | V only |
| SE 47th | 9.75 | V only |
| Coal Crk Pkwy | 10.13 | V only |
| SE 40th | 10.55 | V & S |
| SE 39th | 10.79 | V only |
| I-90 | 11.21 | V only |
| SE 30th | 11.47 | V only |
| SE 20th | 12.05 | V only |
| SE 4th | 13.06 | V & S |
| NE 4th | 13.60 | V only |
V = volume, S = speed
| Sensor Location | Milepoint | Sensor Type |
|---|---|---|
| SR 520 | 14.63 | V & S |
| NE 14th | 14.27 | V & S |
| NE 4th/8th | 13.33 | V only |
| SE 4th | 13.06 | V only |
| SE 20th | 12.05 | V & S |
| SE 30th | 11.47 | V only |
| I-90 | 11.21 | V & S |
| SE 40th | 10.55 | V & S |
| Coal Crk Pkwy | 10.13 | V only |
| SE 47th | 9.75 | V & S |
| 112th Ave SE | 9.21 | V only |
| SE 59th | 8.90 | V & S |
| SE 64th | 8.40 | V & S |
| SE 70th | 8.03 | V only |
| NE 44th | 7.40 | V only |
| NE 37th | 7.00 | V only |
V = volume, S = speed
For this study, manual field personnel documentation of queue duration and length, and TMC speed and volume data were all collected each night of work activity in order to allow comparisons of the results. In addition, actual travel time studies were conducted during the week of September 1, 2008 to assess how each type of data compared to these “ground truth” delay and queue length measurements. Finally, a small sample of truck transponder data were obtained for three nights of work activity (September 15-17, 2008) over a 7-mile segment of roadway (in each direction). A comparison set of truck data were also provided for that roadway segment from March 2009. Unfortunately, as was the case for the I-95 Lumberton project in North Carolina, the sample size obtained at this site was extremely small (see Table 18). Many mile segments had no observations in many hour intervals (93 percent of the mile-segment-hours had no speed observations). In only one instance was there more than two speed observations in a given mile segment in a given hour of work activity.
| Date | Hours of Closure Examined | Length of Section Examineda | Truck Transponder Observations | Observations per Mile per Hour | |
|---|---|---|---|---|---|
| Average | Maximum | ||||
| Sep. 15, 2008 | 9 hr | 14 mi | 18 | 0.1 | 6 |
| Sep. 16, 2008 | 9 hr | 14 mi | 10 | 0.1 | 2 |
| Sep. 17, 2008 | 9 hr | 14 mi | 15 | 0.1 | 2 |
| 3-Day Average | 9 hr | 14 mi | 14.3 | 0.1 | 6 |
RESULTS
Exposure Measures
As shown in Figure 10, the field crew documentation tables indicated that work actually occurred on slightly more than one-half of all of the nights during the evaluation period. Considering only Sunday through Thursday nights when the contractor was actually allowed to be on I-405 and close lanes, work activity occurred on slightly more than 70 percent of the allowable nights.
Figure 10. Work Exposure Measures, I-405 Seattle.
Table 19 summarizes the hours of wo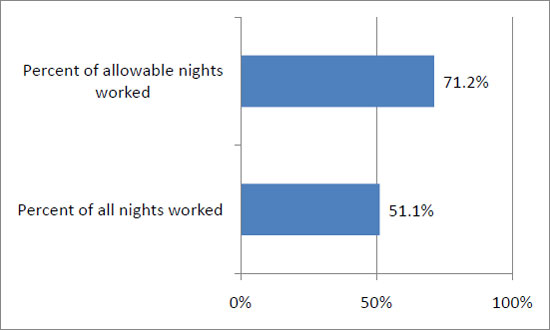 rk activity reported on the field crew data collection forms. Over the 47 nights of activity in the pilot test evaluation period, the contractor performed 407 hours of work, averaging approximately 8.7 hours per work shift. Overall, it was apparent that the contractor was making full use of available work windows at night when they did mobilize and initiate a work shift on this project.
| Work Exposure Measure | Value |
|---|---|
| Total hours of work activity during project | 407 |
| Average number of hours of work per day | 8.7 |
The next facet of exposure data gathered and computed for the Washington project were the roadway capacity losses. These are provided in Table 20. Tracking and consolidating lane closure data for this project proved to be a fairly significant task, given the acceptable times of lane closures allowed at night in the contract. In addition, there were a few nights when work crews were in both directions of travel. Overall, one sees in Table 20 that over one-half of the lane closure time involved the closure of three out of four available lanes. The maximum number of lanes present within the limits of the work zone each night was used as the baseline, rather than attempting to characterize each auxiliary lane or lane drop segment separately. Also, there are a very few number of hours included in Table 20 where the entire roadway section was closed for a few minutes while overhead beams were moved into place or other tasks occurred which required full closure of the roadway.
| Capacity Loss Exposure Measure | Value |
|---|---|
| Percent of work hours involving: | |
| 1 of 4 lanes closed in a given direction | 13.8% |
| 2 of 4 lanes closed in a given direction | 27.4% |
| 3 of 4 lanes closed in a given direction | 57.1% |
| 4 of four lanes closed in a given direction | 0.2% |
| Percent of inactive hours involving lane closures | 0% |
| Lane-Mile-Hours of closures in evaluation period | 5,456 |
| Average lane closure length per work activity period | 5.5 miles |
Over the 47 nights of work in the evaluation period, a total of 5,456 lane-mile-hours of roadway capacity loss were required for the project. This equates to an average of 5.5 miles of lane closure each night of work activity. Often, this length of lane closure was split between both directions of travel.
The decision to work at night did minimize the extent to which Seattle drivers were exposed to the nightly lane closures on this roadway segment. Still, the absolute exposure numbers were quite significant. As shown in Table 21, approximately more than 1.3 million vehicles passed through active work zone lane closures during the evaluation period of this project. Overall, this corresponds to less than 10 percent of the total amount of traffic that utilized this section of I-405 during the evaluation period. Meanwhile, nearly 5 million vehicle miles of travel occurred through the temporary lane closures over the duration of the evaluation period of this project.
| Vehicle Exposure Measure | Value |
|---|---|
| Number of vehicles passing through active lane closures in evaluation period | 1,385,500 |
| Percent of total traffic in evaluation period encountering work activity and lane closures | 9.3% |
| Total vehicle-miles-traveled past active work zone lane closures in evaluation period | 4,846,400 veh-mi |
Queuing Measures
Table 22 and Figure 11 both summarize queue measure characteristics at this site as documented by field personnel on the data collection form, and through analysis of available traffic sensor data from the regional TMC. Because work activity typically occurred simultaneously in both directions of travel each night, separate analyses were performed for each direction. The restriction of temporary lane closures to nighttime hours no doubt did reduce the frequency and severity of queues and congestion that might have otherwise developed. However, as noted in Table 22, field personnel still reported the creation of queues on 80 percent of the nights when a lane closure was implemented in either direction. The traffic sensor data at this site was not as sensitive to detecting queue presence, as analyses found evidence of queuing on only 35 to 59 percent of the nights of work activity. This result was expected given the limited number of sensor locations that had functional volume and speed data available. Looking back at Table 16 and Table 17, the effective spacing between traffic sensors with both volume and speed was nearly 1 mile in either direction. Furthermore, there are several segments where the distance between useful sensors is several miles (i.e., between mile points 10.55 and 13.06 in the southbound direction, between mile points 14.27 and 12.05 in the northbound direction). The large spacing of sensors severely limited the accuracy of the estimates of queue length and duration that could be made.
| Queue Measure | Southbound | Northbound | ||
|---|---|---|---|---|
| Based on Field Crew Data | Based on Traffic Sensor Data | Based on Field Crew Data | Based on Traffic Sensor Data | |
| Days of work activity when queuing occurred | 81.4% | 34.9% | 82.9% | 59.0% |
| Amount of work activity time when queue > 1 mi | 17.1% | 1.2% | 21.3% | 4.7% |
| Amount of work activity time when queue > 2 mi | 11.8% | 0.0% | 12.6% | 1.9% |
| Amount of traffic volume through active work zone that encounters a queue | 19.0% | 4.3% | 13.6% | 9.2% |
The effect of the longer distances between usable speed sensors is evident in the other measures as well. Figure 11 illustrates that both queue durations and maximum queue lengths in both directions were shorter based on available traffic sensor data than what the field personnel documented on their data collection forms. Similarly, the percentage of work activity time when queues reportedly exceeded the 1-mile and 2-mile thresholds was much lower for the traffic sensor data than what the field crews reported, as was the amount of traffic estimated to have encountered a queue when traveling through the nightly work zones during the evaluation period.
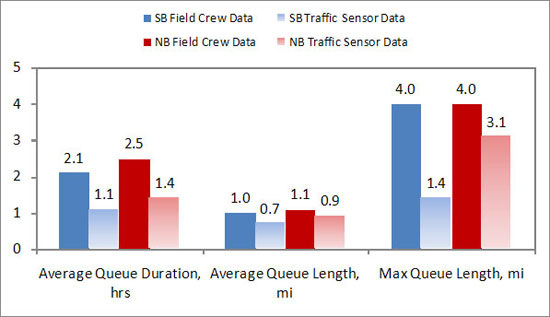
Figure 11. Comparison of Queue Length Measures, I-405 Seattle.
Floating-vehicle travel time studies were performed during September 2-4, 2008 in order to provide a means of comparing the two data collection approaches to a “ground-truth” measure of queues and delays. During that week, the field crews reported small queues on September 2nd and 3rd in the southbound direction, and on all three nights in the northbound direction. Using the available traffic sensor data, however, queues were detected only on September 2nd in both the southbound and northbound directions. Table 23 summarizes the comparison between field crew, traffic sensor and ground-truth queue measures. Overall, the field crews were better able at identifying when queuing conditions developed each night (as would be expected). In terms of queue lengths and duration, the two data sources appeared to be equally accurate compared to the ground-truth travel time data. Although field personnel were not interviewed as part of this testing process, it is likely that there was some degree of approximation occurring in terms of queue lengths, which could explain some of the deviations from the ground-truth values.
| September 2, 2008 | September 3, 2008 | September 4, 2008 | |||||||
|---|---|---|---|---|---|---|---|---|---|
| Based on Field Crew Data | Based on Traffic Sensor Data | Measured via TT Studies | Based on Field Crew Data | Based on Traffic Sensor Data | Measured via TT Studies | Based on Field Crew Data | Based on Traffic Sensor Data | Measured via TT Studies | |
| Southbound: | |||||||||
| Queue Duration (Hrs) | 1.0 | 0.3 | 0.5 | 1.0 | 0.0 | 0.5 | 1.0 | 0.0 | 1.0 |
| Max. Queue Length (Mi) | 0.3 | 0.5 | 1.1 | 0.5 | 0.0 | 0.9 | 0.3 | 0.0 | 1.5 |
| Northbound: | |||||||||
| Queue Duration (Hrs) | 1.0 | 0.3 | 0.5 | 1.0 | 0.0 | 0.0 | 0.0 | 0.0 | 0.0 |
| Max. Queue Length (Mi) | 0.3 | 0.4 | 0.5 | 0.5 | 0.0 | 0.0 | 0.0 | 0.0 | 0.0 |
TT= travel time
The very limited amount of truck transponder data that could be obtained for this site did not allow for a comprehensive comparison to either field-reported or traffic sensor data estimates of queues. Field personnel did report small queues developing each of the four nights (in both directions) for which transponder data were available, but the transponder data was such that slower speeds (15 mph) were detected on only two of the nights, and there was only a single speed observation during each night. These single observations occurred in the northbound direction, and were actually several miles away from the reported location of the work activity. Furthermore, it is not certain that the field personnel and truck transponder frames of reference used the same mile marker system. Ultimately, it would not have been possible to estimate traffic impacts of the work activity based on the limited transponder data.
Delay Measures
The limitations of the effectiveness and accuracy of the traffic sensor data subsequently extended from queue duration and length estimates into delay computations. Table 24 provides a comparison of the delays computed using the field personnel estimates of queuing and the computational procedures for estimating delays based on queue lengths to delay estimates computed from the available traffic sensor data. In general, the total vehicle-hours of delay computed using the project field crew measurements are more than twice those estimated using the available traffic sensor data, even if it was assumed that the queues reported by the field personnel occurred within the work zone rather than upstream (i.e., a speed in queue of 30 mph was used rather than a much lower speed in queue that would have been computed using equation 1). Considering the queues as existing upstream of the lane closure points would have pushed the delay estimates to the upper values shown in the table.
Since field personnel were not asked to note where relative to the temporary lane closures the queues occurred each night, a wide range of potential delay impacts could have occurred at this site during the evaluation period. In Table 24, average delays through a queue may have been as small as 6 minutes per vehicle or as high as 22 minutes per vehicle, depending on the speeds that existed within the reported queues. Table 25 summaries the travel time “ground truth” speed and delay study results from the September 2008 data collection trip, and compares them to the estimates of speed and delays computed for those same days via field personnel documentation and the traffic sensor data.
| Delay Measure | Southbound | Northbound | ||
|---|---|---|---|---|
| Based on Field Crew Dataa | Based on Traffic Sensor Data | Based on Field Crew Dataa | Based on Traffic Sensor Data | |
| Total delay during work activities | 2,905-11,368 veh-hr | 450 veh-hr | 3,653-14,258 veh-hr | 1,197 veh-hr |
| Delay per night of work | 68-266 veh-hr | 10 veh-hr | 94-367 veh-hr | 31 veh-hr |
| Delay per night of work when queues developed | 83-325 veh-hrs | 30 veh-hr | 101-394 veh-hr | 52 veh-hr |
| Average delay per entering vehicle during work\activities | 0.3-1.3 min/veh | 0.1 min/veh | 0.5-1.8 min/veh | 0.2 min/veh |
| Average delay per queued vehicle during work activities | 1.6-5.7 min/veh | 1.0 min/veh | 1.7-6.3 min/veh | 1.3 min/veh |
| Maximum delay per queued vehicle during work activities | 5.9-21.0 min/veh | 2.1 min/veh | 5.9-21.9 min/veh | 4.6 min/veh |
a The lower end of the range shown was computed assuming the queue was located within the work zone and moving at capacity flow speeds; the upper end was computed assuming the queue was located upstream from the lane closure taper and moving at the computed reduced speed in queue from equation 1.
| September 2, 2008 | September 3, 2008 | September 4, 2008 | |||||||
|---|---|---|---|---|---|---|---|---|---|
| Based on Field Crew Dataa | Based on Traffic Sensor Data | Measured via TT Studies | Based on Field Crew Dataa | Based on Traffic Sensor Data | Measured via TT Studies | Based on Field Crew Dataa | Estimated from Traffic Sensors | Measured via TT Studies | |
| Southbound: | |||||||||
| Ave. Speed in Queue (Mph) | 5.7-30 | 30 | 33 | 5.7-30 | --- | 12 | 5.7-30 | --- | 17 |
| Ave. Delay per Vehicle (Min) | 0.3 | 0.5 | 1.0 | 0.5 | --- | 3.6 | 0.3 | --- | 3.8 |
| Northbound: | |||||||||
| Ave. Speed in Queue (Mph) | 5.7-30 | 30 | 30 | 5.7-30 | --- | --- | --- | --- | --- |
| Ave. Delay per Vehicle (Min) | 0.4 | 0.4 | 0.5 | 0.6 | --- | --- | --- | --- | --- |
--- data not indicating presence of queue delay
a The lower end of the range shown was computed assuming the queue was located within the work zone and moving at capacity flow speeds; the upper end was computed assuming the queue was located upstream from the lane closure taper and moving at the computed reduced speed in queue from equation 1.
It is interesting to note the range of speeds in queue that was measured by the travel time studies. On September 2nd, the traffic queue was located almost entirely within the limits of the lane closure, and speeds in queue were very close to those expected to exist when traffic is operating at near capacity flow conditions (i.e., 30-35 mph). However, on the other two nights, the queues tended to develop near the lane closure taper and extend upstream, which led to average speeds in queue of between 12 and 17 mph. Once again, knowing whether any queue that develops is located within or upstream of the work zone lane closure can significantly improve the ability of an analyst in estimating the average speed in queue, and in turn the actual delays being experienced by the traveling public.
KEY FINDINGS FROM I-405 SEATTLE PILOT TEST
The feasibility of having field personnel document daily (nightly) work activity and queue durations and lengths that occur was again validated through this pilot test effort. It appears that the field personnel were quite accurate and meticulous in their documentation efforts; all instances of queues identified during the ground truth travel time studies were noted as queued conditions on the data collection forms.
A key limitation in the proposed data collection and analysis procedures was again identified relative to the use of field personnel documentation of queues. Specifically, it will be necessary for field crews to not only document the lengths and durations of any queues that develop, but also to assess whether the queue is located upstream of the work zone lane closure, or beyond it in the work activity area.
With regard to the use of electronic traffic sensor data for work zone mobility monitoring and performance measure development, a significant amount of effort was required in this pilot test to extract and use data files, only to find out that the files themselves were incomplete or provided only volume counts. The effectiveness of a spot sensor system to reasonably estimate both queues as well as delays due to work zone activity hinges on the availability of speed data at each sensor location. System configurations that provide only occasional sensors with speed data collection capabilities will provide less accurate estimates of work zone mobility impacts. The lack of speed data may be a design constraint, in which case the agency is somewhat limited in its options. However, the lack of data may also be a result of construction activities themselves, which the agency may be able to mitigate to some degree. There were several nights in the evaluation period where certain sensors appeared to “quit functioning” for a period of time in the vicinity where the field personnel documented some work activity occurring. It is likely that the work activities themselves may have disrupted power or communications to and from the sensor to render it unusable during the work activity. Developing and implementing methods of counteracting these type of temporary data losses due to work activities would significantly improve the potential for using traffic sensor data in computing work zone performance measures.
It was hoped that the review of truck transponder data would have provided additional insights into the potential use of this data for work zone traffic mobility monitoring efforts. Unfortunately, even though I-405 is a very high-volume facility, the amount of truck traffic that uses the facility (and is equipped with transponder technology) appears to be fairly small. This is most likely especially true at night once regular commuting traffic has decreased to the point where uncongested speeds (i.e., 55 mph or more) can be maintained on the main north-south freeway through Seattle (I-5). Once again, the usefulness of truck transponder data depends upon having an adequate sample size available, which was not the case here for the I-405 project.
previous | next