6. PILOT TEST LOCATION #1: I-95, LUMBERTON, NC
DESCRIPTION
The first work zone location where the proposed work zone performance data were gathered and measures computed was on Interstate 95 in southern North Carolina, near the town of Lumberton. A 10-mile section of the roadway (milepoint 0 to milepoint 10) was undergoing resurfacing of travel lanes, improvements to the shoulder and other roadside appurtenance improvements in both directions of travel. When work was occurring, one of the two lanes in a given direction of travel was closed to traffic. The length of the lane closure varied each work period, depending on the anticipated work tasks to be completed.
The posted speed limit on this roadway segment is 65 mph. As of 2007, this section of I-95 reportedly serviced approximately 47,000 vpd, a significant portion of them large trucks. The North Carolina Department of Transportation (NCDOT) decided to allow the contractor to perform the work at their discretion anytime between Monday and Friday morning in the northbound direction, and between 10 am and 5 pm Monday through Thursday in the southbound direction; weekend lane closures were not allowed. Although the NCDOT analysis indicated that queues would not be a problem, contract documents also specified that the contractor was not to allow traffic queues due to a lane closure to grow beyond three miles in length.
DATA SOURCES
This section of I-95 is a fairly rural portion of North Carolina, and thus was not within the limits of an existing transportation management center (and its associated data collection devices). Consequently, the primary source of data for this pilot test was manual documentation of queues by field personnel on site each day of work activity. The manual documentation was done using the data collection form previously shown in Table 6. Work zone activities were recorded by project field crews between the dates of August 4 and November 25, 2008. A total of 66 days of work activity occurred during that time period. The summer of 2008 turned out to be extremely wet for southern North Carolina. As a result, the contractor was rained out on many of the potential weekdays that work could have occurred.
At this location, an attempt was also made to utilize the portable traffic surveillance devices previously described (see Figure 7). For this pilot test, the plan was to deploy six of these devices approximately 1-mile apart from each other, three of them upstream of the temporary lane closure taper, and three within the work zone itself.
Figure 7. Portable Traffic Data Collection Device at Pilot Test Location.
Initially, the device did experience some data communications problems. These problems were subsequently corrected. Unfortunately, the end result of the efforts to get these devices to the field was that they were used occasionally over the study period, but not each and every work shift. In addition, the days that the devices were deployed happened to occur when no queues or congestion developed at the site. Consequently, the data that was available from these devices could not be applied to this particular pilot test.
A second source of traffic operational data gathered for this site was truck transponder information from the FHWA Office of Freight Management data collection effort (also previously described). For this work zone monitoring effort, a request was made to query the database on dates of queuing reported by the field crews, and to provide that data in one-mile increments within and upstream of the work zone each of those days. As shown in Table 8, the query yielded five days of truck transponder data. Unfortunately, the sample size at this site was very low, averaging fewer than one truck speed per hour per mile of roadway investigated. There were a few instances where multiple observations were obtained during the same hour in the same mile segment, but those were the exception rather than the rule (and so were not identified specifically in the table).
| Date | Hours of Closure Examined | Length of Section Examined | Truck Transponder Observations | Observations per Mile per Hour |
|---|---|---|---|---|
| August 4, 2008 | 6 hr | 9 mi | 55 | 1.0 |
| August 28, 2008 | 10 hr | 9 mi | 63 | 0.7 |
| November 3, 2008 | 6 hr | 9 mi | 31 | 0.6 |
| November 20, 2008 | 10 hr | 9 mi | 72 | 0.8 |
| November 24, 2008 | 10 hr | 9 mi | 47 | 0.5 |
| 5-Day Average | 8.4 hr | 9 mi | 53.6 | 0.7 |
RESULTS
Exposure Measures
Based on the work day restrictions set forth in the contract documents, a total of 66 days were allowed for the contractor to work during the four-month evaluation period of this pilot test. Of these, the field crew documentation tables indicated that work actually occurred on 31 of those days. As shown in Figure 8, this represents less than 50 percent of the days allowable in the contract. If this effort is compared to all days in the entire four-month period, work actually occurred slightly more than one out of every four days.
Intuitively, such numbers seem fairly small, and would normally be cause for an agency to investigate more closely and/or potentially look into its current methods of estimating work duration and contracting language. However, the rainy weather alluded to previously certainly had much to do with this low level of activity. Because this pilot test is for illustrative purposes only, rain days were not extracted from the total allowable days in the analysis. For actual monitoring purposes, such exclusions might be appropriate in the final calculations by an agency.
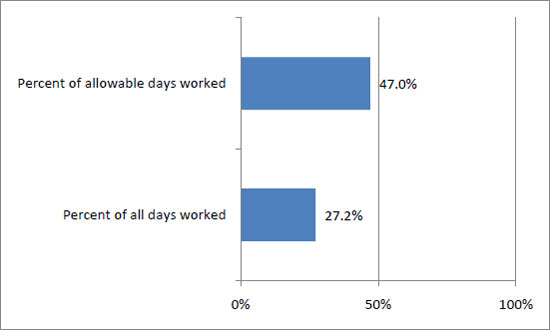
Figure 8. Work Exposure Measures, I-95 Lumberton.
Table 9 summarizes the hours of work activity reported on the field crew data collection forms. Over the 31 days of activity, the contractor performed 290 hours of work, averaging approximately 9.3 hours per work shift. Based on these data, it does appear that the contractor was making full use of available work windows when they did mobilize and initiate a work shift on this project.
| Work Exposure Measure | Value |
|---|---|
| Total hours of work activity during evaluation period | 290 |
| Average number of hours of work per day | 9.3 |
The next facet of exposure data gathered and computed for the North Carolina project were the roadway capacity losses. These are provided in Table 10. At this project, all work activity that occurred involved the closure of one lane of travel in either the northbound or southbound direction. Furthermore, when work crews were not on site, all lane closures were removed from the site. One does see that over the 31 days of work in the evaluation period, a total of 558 lane-mile-hours of roadway capacity loss were required for the project, or an average 1.9-mile lane closure each day of work activity.
| Capacity Loss Exposure Measure | Value |
|---|---|
| Percent of work hours involving 1of 2 lanes closed in a given direction | 100% |
| Percent of inactive hours involving lane closures | 0% |
| Lane-Mile-Hours of closures in evaluation period | 558 ln-mi-hr |
| Average lane closure length per work activity period | 1.9 miles |
The relatively infrequent work activity of this project during the evaluation did have the positive consequence of limiting motorist exposure to the work activity and lane closures. As shown in Table 11, approximately 348,000 vehicles passed through active work zone lane closures during the evaluation period of this project. Overall, this corresponds to less than 7 percent of the total amount of traffic that utilized this section of I-95 during the evaluation period. A total of 661,200 vehicle-miles of travel occurred through the work zone during the evaluation period.
| Capacity Loss Exposure Measure | Value |
|---|---|
| Number of vehicles passing through active lane closures in evaluation period | 348,000 |
| Percent of total traffic in evaluation period encountering work activity and lane closures | 6.5% |
| Total vehicle-miles-traveled past active work zone lane closures in evaluation period | 661,200 veh-mi |
Queuing Measures
Table 12 and Figure 9 both summarize queue measure characteristics at this site. Although this section of I-95 serves a significant amount of traffic during the typical daytime period, the temporary closure of a travel lane did not always result in the creation of queues and congestion at the site. According to field crew documentation, queues developed only about one out of every four days of work activity at the site. On average, queues that did develop on certain days lasted 1.3 hours before dissipating, and were approximately 0.6 miles long. The maximum queue length documented by the field crews during the evaluation period was 2.0 miles, significantly below the 3-mile threshold established by NCDOT. These measures highlight the value of monitoring, gathering, and evaluating work zone mobility-related data on an ongoing basis. In the absence of such numbers, it would be difficult for NCDOT to decide, based on this project, whether to continue to allow daytime lane closures on this section of I-95 on future projects.
| Queue Measure | Based on Field Crew Data | Based on Electronic Truck Transponder Data |
|---|---|---|
| Days of work activity when queuing occurred | 25.8% | 5.6% |
| Amount of work activity time when queue > 1 mi | 1.4% | 2.5% |
| Amount of work activity time when queue > 3 mi | 0.0% | 0.7% |
| Amount of traffic volume through active work zone that encounters a queue | 4.8% | 3.6% |
For comparison purposes, Table 12 and Figure 9 also provide the same queue measures estimated from the available truck transponder data at this location during the evaluation period. It should be noted that the sample size for these estimates was very small, as only one or two truck speed samples were typically available in any given hour in any mile interval within the study segment. In many cases, no data were available when and where queues were documented by the field personnel. Consequently, fewer instances of queuing could actually be identified with the truck transponder data. As Table 12 illustrates, the field crews indicated queuing approximately once every four days of work activity, while the truck transponder data indicated the presence of queues on about once every 20 days of work. Similarly, the queues had to be somewhat larger and longer in duration in order to be detected through the truck transponder data because of the one-mile interval that was used to group the truck transponder speeds. Estimates of average and maximum queue lengths and queue duration via the truck transponder data were somewhat higher than those reported by the field crews, and the truck transponder data did yield a small amount of time (but more than was reported by the field crews) when the queues exceeded the contract-stated threshold of 3 miles.
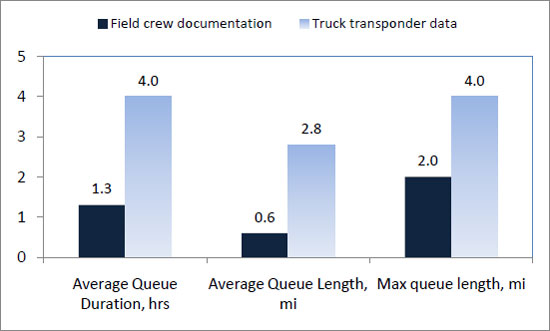
Figure 9. Comparison of Queue Length Measures, I-95 Lumberton.
In addition to the field crew and truck transponder data sources obtained for this pilot test location, a limited amount of “ground truth” travel time and queue length data were gathered during one week in October 2008. Comparison of these data to the field crew documentation indicates reasonable, but not excellent, agreement and accuracy by field personnel in estimating queue conditions at the site. During that week, the field crews reported queues on two of the four days of travel time studies. Unfortunately, truck transponder data were not available to determine how well that data source compared to actual queue lengths at this site. Table 13 summarizes the comparison between field crew and ground-truth measures of queue duration and length on three of the days of travel time data collection. Travel time studies on October 13th supported field crew documentation that no queues developed during work activities on that day. Overall, field crew documentation and travel time studies correlated well on two of the three days in terms of queue duration and maximum queue lengths. However, travel time studies did show some queuing on October 15 that was not documented in the field crew data collection forms.
| October 14, 2008 | October 15, 2008 | October 16 2008 | ||||
|---|---|---|---|---|---|---|
| Based on Field Crew Data | Measured via TT Studies | Based on Field Crew Data | Measured via TT Studies | Based on Field Crew Data | Measured via TT Studies | |
| Queue Duration (Hrs) | 0.5 | 0.8 | 0.0 | 1.8 | 2.0 | 1.5 |
| Maximum Queue Length (Mi) | 1.0 | 1.0 | 1.0 | 0.6 | 1.5 | 2.1 |
TT= travel time
Delay Measures
Computations of delays from the queue length data at this site uncovered a major source of variability that was not anticipated or considered in the pilot test design. Specifically, it became clear that simply noting the existing of a queue and its approximate length over time was not sufficient to reasonably approximate delays being experienced by motorists who are passing through the work zone. This is because delays are highly dependent upon the average speed assumed to exist within the length of queue. In the computational procedures previously described, it was assumed that a queue would develop at the point of a lane closure bottleneck and grow upstream of that point across all approach lanes, leading to very slow speeds in queue. In reality, bottleneck locations often developed farther into the work zone lane closure, and grew upstream from that point in the remaining open lane. The ramifications of this is that the average speed within a queue that forms within the work zone would be expected to be flowing at speeds closer to the capacity flow of traffic than at the previously-defined average speed in queue. If the queue were to grow to a point where it extended beyond the lane closure taper, the section upstream of that taper would then be expected to begin operating at a much slower average speed as vehicles fill in both lanes and begin to take turns moving into the open lane and through the work zone.
The ramifications of the location of the queue (and thus whether it is assumed to be operating at a capacity flow speed or an upstream traffic queue speed) upon delay estimates is dramatic. As noted in Table 14, estimates of the average delay per vehicle caused by the work zone traffic queues that developed vary by a factor of almost 10, depending on the assumptions as to where the queues were located (within or upstream of the lane closure taper). Comparing the truck transponder data, one sees that the delay estimates tended towards the upper end of the range of values computed from the field personnel queue length documentation. It should be remembered, though, that the delays estimated from the truck transponder data correspond to queue lengths that were much longer than those documented by the field personnel. Consequently, the correlation between the two data sources is smaller than it actually appears in the table.
| Delay Measure | Based on Field Crew Data Dataa | Based on Truck Transponder Datab |
|---|---|---|
| Average delay per entering vehicle during work | 0.0-0.4 min/veh | 0.3 min/veh |
| Average delay per queued vehicle during work | 0.9-8.9 min/veh | 9.7 min/veh |
| Maximum delay per queued vehicle during work | 2.0-17.5 min/veh | 13.7 min/veh |
| Total delay during work over entire evaluation period | 246-2485 veh-hrs | 944 veh-hrs |
| Total delay per day of work | 8-80 veh-hrs | 63 veh-hrs |
| Total delay per day of work when queues occur | 31-311 veh-hrs | 944 veh-hrs |
aThe lower end of the range shown was computed assuming the queue was located within the work zone and moving at capacity flow speeds; the upper end was computed assuming the queue was located upstream from the lane closure taper and moving at the computed reduced speed in queue from equation 1.
b This dataset represents fewer days of queuing, and captures only the longer duration and lengthier queues.
The travel time data collected during October 2008 was also compared to these delay estimates and the assumptions regarding the average speed in queue. The results, presented in Table 15, indicate that the speed in queue on October 14 matched more closely to the capacity flow speed (i.e., the queue was located within the work zone). On October 16, the average speed in queue measured through the travel time studies was something between a capacity flow speed and a speed in queue when located upstream of the lane closure taper. This would imply that part of the queue was located within the limits of the work zone, and part extended upstream of the lane closure taper. In fact, notes taken during the travel time studies on that date indicate that the queue was indeed located partially beyond, and partially upstream, of the work zone lane closure taper.
| October 14, 2008 | October 15, 2008 | October 16 2008 | ||||
|---|---|---|---|---|---|---|
| Based on Field Crew Data a | Measured via TT Studies | Based on Field Crew Data | Measured via TT Studies | Based on Field Crew Dataa | Measured via TT Studies | |
| Average Speed in Queue (Mph) | 6.3-30 | 27 | n/a | 25 | 6.3-30 | 17 |
| Average Delay per Vehicle (Min) | 0.4-8.5 | 0.4 | 0.0 | 0.6 | 0.9-10.0 | 3.0 |
a The lower end of the range shown was computed assuming the queue was located within the work zone and moving at capacity flow speeds; the upper end was computed assuming the queue was located upstream from the lane closure taper and moving at the computed reduced speed in queue from equation 1.
TT= travel time, n/a=data not available
KEY FINDINGS FROM I-95 LUMBERTON PILOT TEST
Based on the data obtained and measures computed with this pilot test, it does appear that field personnel were able to document queues fairly accurately when such documentation occurred. It does appear that there may have been a work shift or two in which queue documentation was not performed (as suggested in Table 12 and Table 13). Given that field personnel have multiple job duties and responsibilities at most project sites, an occasional miss of queues was not unexpected.
Overall, the exposure, queue, and delay measures as defined earlier in this report were able to be computed using the data gathered by the field personnel, and yielded results which, for the most part, appeared reasonable and potentially useful for agency work zone policy and procedure assessments in the future. However, a key limitation in the proposed data collection and analysis procedures was identified relative to the use of field personnel documentation of queue durations and lengths at project sites. Specifically, it will be necessary for field crews to not only document the lengths and durations of any queues that develop, but also to assess whether the queue is located upstream of the work zone lane closure, or within the lane closure in the work activity area. Speeds in queue vary by a factor of 5 to 10 depending where it is located relative to the lane closure taper, and so the location of the queue will dramatically alter the delays that would be computed based on a given length and duration of queue.
previous | next