9. PILOT TESTS #4 AND #5: I-15, LAS VEGAS, NV
DESCRIPTION
The fourth and fifth pilot test locations were located on Interstate 15 in Las Vegas, NV. The southern project (5.7 miles long) extended from I-215 on the south to Sahara Avenue on the north (Figure 14). The northern project extended from the I-15/US-93/US-95 interchange (the “Spaghetti Bowl” [SB] interchange) north to Craig Road (Figure 15). South of the SB interchange, the freeway was four lanes wide per direction, which dropped to three lanes per direction north of the interchange. Continued growth in the corridor and to the north created recurrent congestion in both project sections. South of the SB interchange, recurrent congestion northbound occurred in afternoon and early evening hours between Tropicana Avenue and Sahara Avenue (Figure 14), and occasionally in the SB interchange northward. Congestion also developed southbound in the morning approaching the SB interchange from the north, and occasionally approaching Flamingo Road. Traffic volumes throughout this section of I-15 were approximately 170,000 vpd. The posted speed limit in the work zones is 55 mph, reduced from the normal 65 mph speed limit on the facility.
In the south project, the Nevada DOT (NDOT) is constructing an express lane in both directions within the existing highway median as a way to mitigate the recurrent congestion problem in this section. The project began on September 15, 2008 and was targeted for completion in September 2009. In the initial phases of the project, it was necessary to close the right lane of traffic in several sections to accommodate construction activities. Table 37 summarizes the dates and locations of these closures. Unlike the other pilot test locations, these were long-term lane closures that remained in place at all times until the work was completed. Acceleration and deceleration lanes for entrance and exit ramps within the section had to be closed as well (i.e., ramp traffic was funneled directly into mainline traffic). According to NDOT officials, this traffic control created difficulties for motorists at the merge points and was believed to have increased the duration and extent of congestion and queues that occurred. In early December 2008, the contractor switched the long-term lane closures to the median of I-15. Although the total number of lanes remained the same through the section (3 per direction) as in the earlier phase, the elimination of merge point conflicts with entering traffic significantly reduced traffic crashes occurring regularly in that section (according to NDOT officials). It also appeared that this modification allowed traffic to flow more smoothly into and through the work zone, and may have reduced to some degree the length and duration of queues that developed.
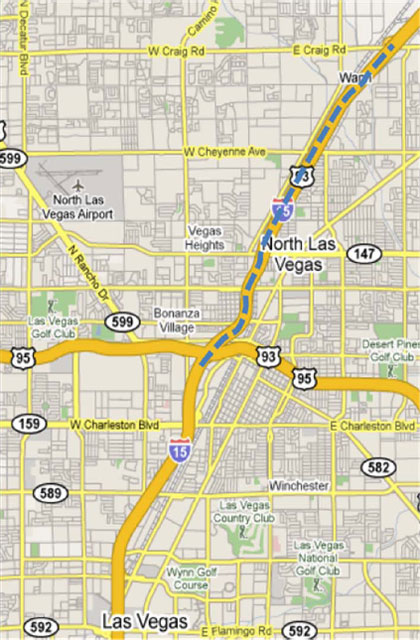
Figure 14. I-15 Express Lanes Widening (South) Project.
Figure 15. I-15 Interchange and Freeway Widening (North) Project.
| Location of Long-Term Lane Closures | Dates |
|---|---|
| Northbound Right Lane: | |
| Russell | September 15 – November 11, 2008 |
| Tropicana | September 22 – November 14, 2008 |
| Flamingo | September 23 – November 18, 2008 |
| Northbound Median Lane: | |
| Russell to Sahara | December 1, 2008 – February 29, 2009a |
| Southbound Right Lane: | |
| Flamingo | October 6, 2008 – January 22, 2009 |
| Tropicana | October 20, 2008 – December 4, 2009 |
| Russell | November 13, 2008 – January 23, 2009 |
| Southbound Median Lane: | |
| Russell to Sahara | December 1, 2008 – February 29, 2009a |
a End of pilot test evaluation period; lane closure extended beyond this date.
The north project was a much larger design-build effort that will ultimately widen the freeway to five lanes per direction. This project began in September 2007 with a target completion date of Fall 2010. Because it was a design-build effort, much of the early effort on the project was design work, and so the actual work zone did not begin until January 2008. During the early portion of the project, no traffic lane restrictions (other than temporary nighttime lane closures) were used. However, in late spring 2008, the contractor requested that one lane in each direction be allowed to be closed long-term between the SB interchange and Lake Mead Boulevard in order to accelerate the rate of construction. The request was approved, and the lanes were closed on July 14, 2008. This meant that, for a distance north of the SB interchange, I-15 consisted of two lanes per direction.
DATA SOURCES AND ANALYSES
The fact that these pilot test sites involved long-term lane closures in a roadway section that was regularly experiencing recurrent congestion complicated the computation of work zone mobility-related performance measures. Specifically, the presence of delays and queues on a particular day during the evaluation period could not be assumed to be solely the result of the work zones (an assumption that could be made in the previous three pilot test locations already discussed). Instead, it was necessary to compare conditions prior to construction to those occurring during construction, with the differences then assumed to be due to the projects. Obviously, this requires that traffic data be available prior to the start of construction of a project. Fortunately, the Las Vegas Freeway and Arterial System of Transportation (FAST) regional TMC had traffic sensors installed since 2007 on a portion of I-15 between I-215 on the south and the SB interchange on the north. On average, traffic sensors are located at approximate 0.3 mile intervals in both directions of travel on I-15 in this area. Although data were not available north of the SB interchange within the actual limits of the north project, its effect upon northbound traffic approaching the interchange could be measured using the FAST data.
Another factor complicating the analyses was the proximity of the two projects themselves. Approximately 2.3 miles separated the north end of the south project (Sahara Avenue) and the south end of the north project (the SB interchange). Prior to the implementation of the long-term lane closures, the pockets of congestion that developed on this facility were separate (between Flamingo Road and Sahara Avenue, and from the SB interchange north along I-15). However, once the closures were installed, queue spillback northbound from the north project occasionally extended upstream beyond Sahara Avenue.
Speed and volume data from the FAST center were obtained for the summer months of 2007 (May-August), and from September and October 2008. Meanwhile, travel times between I-215 and the SB interchange were obtained for the same summer months in 2007 and from September 2008 through February 2009. Although the volumes, speeds, and travel times all come from the same basic sensor data, FAST personnel indicate that the software and database structure makes extraction of the speed and volume data fairly labor-intensive, whereas the travel time data can be directly extracted from information posted on the dynamic message signs (DMS) mounted at strategic locations along the freeway. Consequently, it was much easier to access the travel time data, and so a larger time frame could be examined with those data.
Unfortunately, although detailed traffic sensor data were available before and during the projects, field-collected data regarding work activity and queuing patterns were not. The research team became aware of the projects after they had been initiated, and discussions with NDOT and regional FHWA officials indicated that it would not be feasible to get field personnel to complete the daily data collection forms as had been used in the previous pilot tests, and obtaining access to project diaries would be problematic as well. Project personnel did indicate that the contractors were at the projects “most” days, and could work on both weekdays and weekends. Given that the lane closures remained in place throughout the duration of the evaluation period and were the primary reasons for the increased congestion that developed, the lack of detailed work activity data was less important than at other pilot test locations. Work crews operated behind temporary concrete barrier at both projects, and so influences of work activity upon traffic flows were generally minimal, according to project personnel.
Truck transponder data were requested for the segment of I-15 between Blue Diamond Road to the south and East Craig Road to the north, a distance of approximately 15 miles, including five miles north of the US 93 interchange for which FAST traffic sensor data were not available. A five-day dataset were provided for this segment between January 12 and January 16, 2009. Speed data entries from the database were aggregated hour by hour across each one-mile segment in both directions of travel. Unlike the other pilot test locations, researchers requested data for all hours of the day, since these two pilot test locations both included long-term lane closures that could affect traffic operations throughout the day. As a result, a much larger sample was obtained (1600 + observations). Still, the data were random with pockets of multiple observations occurring within a given mile segment over several hours of the day, but with no observations in other mile segments. In fact, most mile segments did not have any observations in most hours of the day (92 percent of the mile-segment-hours had no observations available). Table 38 summarizes the characteristics of the available truck transponder dataset. Overall, the sporadic nature of these data did not allow for any type of comparison to the other data sources at these sites.
Finally, to assess the accuracy of the FAST data and the truck transponder data, researchers traveled to the project sites to collect travel time data during the week of February 9-13, 2009. Data were collected continuously in both directions of travel daily between 6 am and 7 pm.
RESULTS
Exposure Measures
As previously noted, specific data regarding actual days and hours of work activity were not available for these projects. However, some data were obtained from the south project regarding nights when temporary lane closures installed by the contractor to park a construction vehicle next to the work zone to load and unload materials. During those hours, there were then two lanes closed to traffic (the long-term lane closure plus the nighttime temporary lane closure). Functionally, these temporary lane closures were quite similar to the nighttime temporary lane closures in other pilot test locations previously discussed. Therefore, for comparison purposes, the percentage of calendar nights that involved these types of temporary lane closures was computed for this project, and is presented in Figure 16. One sees that an additional lane was closed on one-third of the nights in the evaluation period. Unfortunately, similar data were not available for the north project.
Table 39 presents the exposure measures pertaining to the loss of roadway lane capacity during the evaluation period at the two projects. For the south project, these values include the single lane closed long term in each direction at each location (each assumed to be approximately 1.5 miles for the various right lane closures and 4.0 miles when the median lane was closed), and an additional 1.5-mile (estimated) lane closure on those nights when a lane was temporarily closed. Assuming that the temporary nighttime lane closures typically lasted 9 hours per work shift as was the case in the previous pilot test locations, a second lane was temporarily closed 3.3 percent of the time during the evaluation period. For the north project, a single lane in each direction was closed for 1.8 of the 5.6 miles of the project during the entire evaluation period. One could argue that the nighttime lane closures at the south project could also be represented in terms of 1 of 3 lanes closed, since there was already a long-term lane closure in place. However, it is shown as the second of four lanes closed in the table.
| Date | Northbound | Southbound | ||||
|---|---|---|---|---|---|---|
| Truck Transponder Observations | Observations per Mile per Hour | Truck Transponder Observations | Observations per Mile per Hour | |||
| Average | Maximum | Average | Maximum | |||
| Jan. 12, 2009 | 175 | 0.5 | 26 | 123 | 0.3 | 19 |
| Jan. 13, 2009 | 185 | 0.5 | 23 | 176 | 0.5 | 25 |
| Jan. 14, 2009 | 244 | 0.7 | 28 | 168 | 0.5 | 25 |
| Jan. 15, 2009 | 149 | 0.4 | 21 | 203 | 0.6 | 23 |
| Jan. 16, 2009 | 129 | 0.3 | 17 | 134 | 0.4 | 14 |
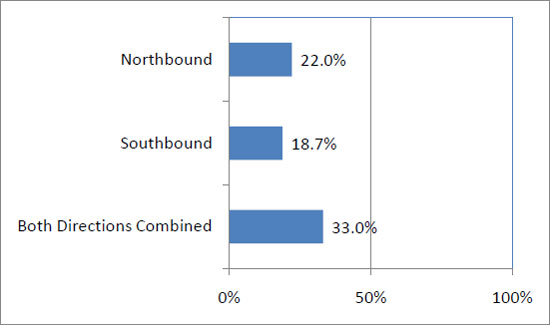
Figure 16. Percentage of Calendar Nights Involving Temporary Lane Closures at the South Project, I-15 Las Vegas.
| Capacity Loss Exposure Measure | South Project | North Project |
|---|---|---|
| Percent of evaluation period involving: | ||
| 1 of 4 lanes closed in a given direction | 96.7% | |
| 2 of 4 lanes closed in a given direction | 3.3% | |
| 1 of 3 lanes closed in a given direction | 100% | |
| Percent of inactive hours involving lane closures | 100% | 100% |
| Average lane-mile-hours of closures per month of evaluation | 5,907 | 1,296 |
| Average lane closure length during evaluation period | 2.2 mi | 1.8 mi |
Since a lane was closed long term in each direction at both projects, all of the inactivity hours during the evaluation period involved a lane closure. In terms of amount of roadway space and time, the project resulted in slightly more than 5,900 lane-mile-hours of losses per month during the evaluation period at the south project, and 1,296 lane-mile-hours of losses per month at the north project. The multiple segments of long-term and nighttime temporary lane closures at the south project resulted in approximately 70 percent of the VMT through the project limits being exposed to lane closures (Table 40). In contrast, 32.1 percent of the VMT passing through the north project was adjacent to long-term lane closures.
| Vehicle Exposure Measure | South Project | North Project |
|---|---|---|
| Number of vehicles encountering long-term lane closures per day during evaluation period | 145,000 | 185,000a |
| Percent of vehicles in evaluation period encountering nighttime work activity and short-term lane closures | 4.5% | n/a |
| Total vehicle-miles-traveled through project limits per day | 940,500 | 924,000 |
| Percent of project VMT past long-term lane closures during evaluation period | 70.3% | 32.1% |
| Percent of project VMT past short-term nighttime lane closures during evaluation period | 0.6% | n/a |
a Traffic volumes just south of the SB interchange. Volumes north of the interchange are unknown, but likely are significantly lower than this value.
n/a = data not available
Queuing Measures
As noted previously, computation of queuing performance measures was more difficult for these projects than for the previous pilot test locations. Specifically, existing congestion patterns and the proximity of the two projects hampered efforts to isolate the effects of each project upon traffic mobility. This can be demonstrated visually through a series of contour plots of speeds over time along the I-15 corridor, as shown in Figure 17 for the northbound direction of travel. Average conditions in the summer of 2007 (when no long term lane closures were present at either project) are provided in part (a) of Figure 17. In part (b), the speeds on I-15 northbound in early September are shown, when the north project had its permanent lane closures in place but before the south project had begun. Finally, in part (c) of the figure, average speeds during the last part of September and all of October are presented, when both the north and the south projects had long-term lane closures in place. In the before condition, a clear congestion pattern is evident from about Sahara Avenue extending upstream, initiating slightly after noon each day until approximately 5 pm or so. Around 3 pm or so each day, this region of slower speeds extended from just north of the I-215 interchange (approximately Russell Boulevard) to Sahara Avenue. Farther north of Sahara, speeds were slightly lower (40 to 60 mph) than free-flow, but not congested.
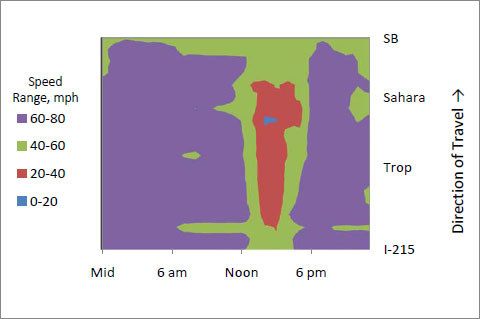
(a) Speed contour map summer 2007 (before north and south project lane closures)
(b) Speed contour map in early September 2008 (north project lane closures only)
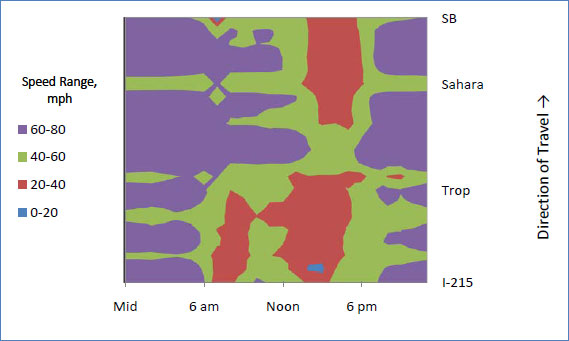
(c) Speed contour map in late September and October 2008 (north and south project lane closures)
Figure 17. Changes in Average Speeds Northbound Before and During Evaluation Period, I-15 Las Vegas.
In contrast, the speed contour plot in early September demonstrates a clear development of congestion and queuing from the SB interchange. More importantly, this congestion extends beyond Sahara Avenue, which is the northern limit of the south project and is where congestion ended northbound back in 2007. Once the south project began in mid-September, one then sees a second region of slower speeds develop around Tropicana Avenue. The new region of queuing began in the AM peak and generally extended upstream into the I-215 interchange during the AM peak and again in the early afternoon hours. Unfortunately, sensors were not available farther upstream on I-15 to assess how much beyond the I-215 interchange congestion actually extended.
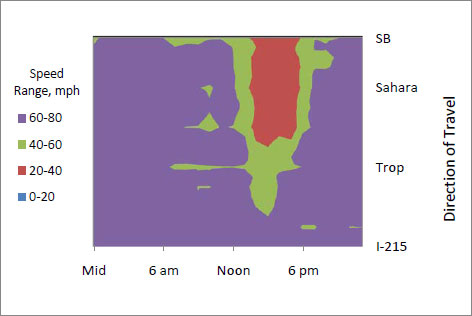
The interdependence between projects is less obvious for the southbound direction, since FAST data were only available south of the north project. Still, one sees different congestion patterns in each of the three conditions (before, north project lane closures only, both south and north project lane closures). In the before condition (Figure 18 (a)), a few hours of congestion are evident just downstream of the SB interchange in the AM peak, and in the late evening/early morning hours from around Flamingo Road to near the I-215 interchange. However, in September 2008 when only the north project lane closures are in place, the late evening congestion at Flamingo Road is no longer evident. Whether this change is due to the north project lane closures acting as a mainlane “meter,” due to some diversion away from I-15 to local routes, or a general reduction in travel volumes as part of the economic recession that began in late 2007 cannot be determined strictly with these speed contour plots (although some additional insights can be gained by examining the traffic volume data as is done later in this chapter). However, in October 2008, the introduction of long-term lane closures southbound in the south project at Flamingo Road (Figure 18(c)) appears to result in a significant slowdown most of the daytime hours (instead of occurring at night as in the before condition). Also, this daytime congestion appears to merge with a slowdown past the SB interchange around 5 pm each weekday.
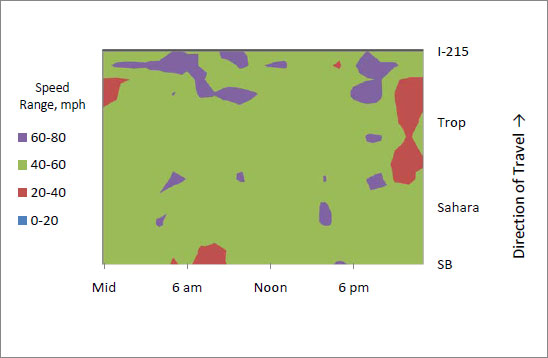
(a) Speed contour map before
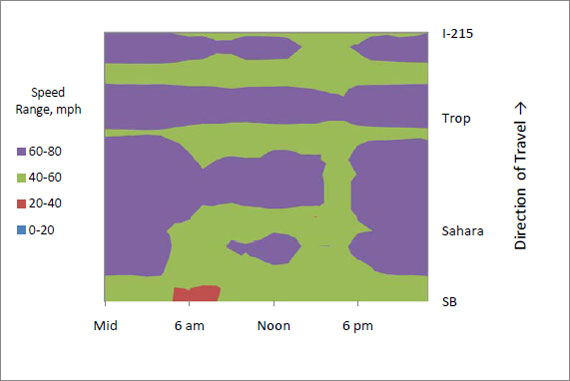
(b) Speed countour map in early September 2008 (north project lane closures only
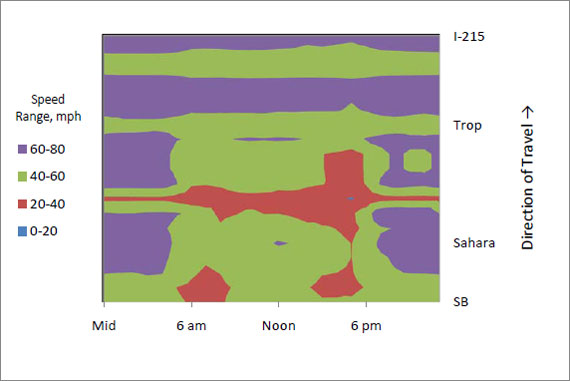
(c) Speed contour map in late September and October 2008 (north and south project lane closures)
Figure 18. Changes in Average Speeds Southbound Before and During Evaluation Period, I-15 Las Vegas.
Overall, then, it is evident that the two projects did result in mobility impacts along I-15. However, exactly how these impacts should be calculated, and then assigned to each project, is not clear. One could decide that the two distinct congestion regions shown for the northbound direction in Figure 17 (c) could be allocated separately to the two projects (i.e., the congestion from before Sahara Avenue to the SB interchange allocated to the north project; the congestion from I-215 to about Tropicana Avenue allocated to the south project). However, this would mean that a portion of the congestion that existed within the limits of the south project in the before condition would be compared against the north project impacts, rather than those from the south project. In addition, this would entail the division of queues on those days when the queue lengths were longer than average and extended farther down in the south section (for northbound traffic). One could also consider all of the congestion that exists south of Sahara Avenue as part of the south project in both the before and during conditions, and just associate the congestion that developed north of Sahara Avenue as part of the north project impacts. In this approach, the length of queuing and delays for the north project northbound would again be truncated, this time to the Sahara Avenue/SB interchange segment. These two approaches would also require the analyst to decide whether to use the summer 2007 congestion patterns, or those in early September 2008 for comparison against the conditions during the south project. As a final option, the entire length of I-15 between I-215 and the SB interchange could be considered as a single segment, and the impacts discussed as the combination of effects of the two projects.
For illustrative purposes, queuing measures for a separate analysis of each project (with the limits of impacts for each project separated at Sahara Avenue) and for a combined analysis of the entire I-15 segment were computed and are compared in Figure 19 through Figure 21. Queues were defined as when and where speeds dropped to below 35 mph. In Figure 19, the average number of hours of congestion per day is shown for summer 2007 before either project began, in early September 2008 when only the north project lane closures were present, and in late September-October 2008 when both the north and the south projects had long-term lane closures in place. Considered in isolation, one sees that the north project lane closures present in early September 2008 had little effect on northbound congestion in the I-215 to Sahara Avenue subsection, but did in the Sahara Avenue to SB interchange subsection. Once the south project lane closures were in place northbound in late September and October 2008, the duration of congestion increased significantly in the south project subsection, but the subsection between Sahara Avenue and the SB interchange remained fairly consistent in terms of the hours of congestion experienced each day.
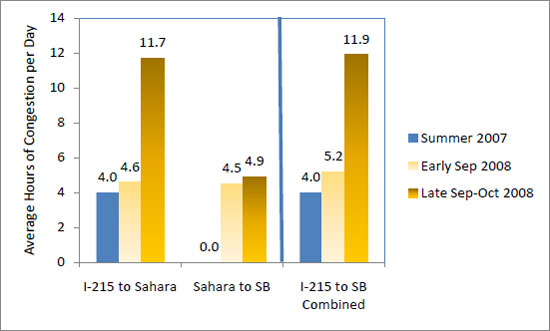
(a) Northbound
(b) Southbound
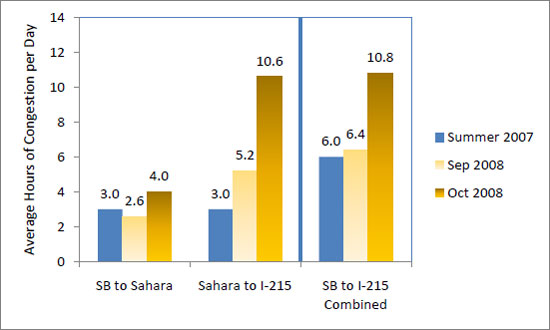
Figure 19. Effects of the Pilot Test Projects on Hours of Congestion, I-15 Las Vegas.
In the southbound direction, the introduction of a lane closure within the north project would not be expected to have a dramatic affect on congestion downstream of the project (i.e., south of the SB interchange). However, one does see a two-hour increase (from 3.0 hours to 5.2 hours) in congestion duration in the section from Sahara Avenue to I-215 in September 2008 when the north project lane closures were in place but not the south project lane closures. The reasons for the longer duration of congestion in that subsection could not be determined from the available data and documentation. Interestingly, though, the entire I-15 section from the SB interchange to I-215 did not experience much of a difference initially in the duration of congestion in the southbound direction when the north project lane closure is in place. Rather, the summer 2007 and September 2008 average hours of congestion are almost identical (6 versus 6.4 hours per day). It is only when the south project lane closures were installed southbound in October 2008 that the duration of congestion increased to more than 10 hours per day.
The interaction between projects is even more evident when one considers their impacts upon queue lengths. Figure 20 presents the average queue lengths each day (when queues were present) for the three time periods of interest in each direction. Northbound, one sees that average queue length in the I-215 to Sahara Avenue section actually declined slightly in both the early September 2008 and the late September-October 2008 periods, but increased in each of the periods in the Sahara Avenue to SB interchange section (by 0.5 miles in the early September 2008 period, by an additional 0.7 miles in the late September-October 2008 period). Looking at the section in its entirety, average queue lengths increased by 0.4 miles in early September 2008, and essentially remained that way into late September-October 2008.
Southbound, the effects of the projects on average queue lengths is more consistent with expectations in each subsection, and overall. Relative to summer 2007, average queue lengths southbound were 0.3 miles longer in the Sahara Avenue to I-215 subsection, and only 0.1 miles longer in the SB interchange to Sahara Avenue subsection. The slightly longer queues in the south subsection could again be due to possible rubbernecking of northbound lane closure conditions by southbound traffic. It is also important to note that while both subsections experienced small queue length increases in this particular period, the effect upon the total SB interchange to I-215 section was only 0.2 miles (from 0.5 to 0.7 miles), less than the sum of the increases of the two subsections. Once the southbound lane closures in the south project were in place (October 2008), average queue lengths grew by an additional 0.2 miles in the southern subsection, but by 0.6 miles (from 0.5 to 1.1 miles) in the SB interchange to Sahara Avenue section. Overall, traffic traveling the entire SB interchange to I-215 section experienced an average 0.9 mile increase in queue lengths (from 0.7 to 1.6 miles) when the south project lane closures were put in place, an amount that is actually greater than the sum of the increases in the two subsections.
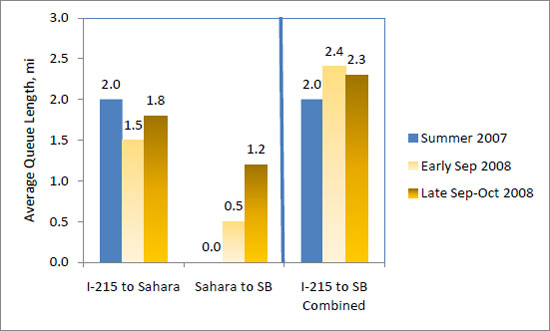
(a) Northbound
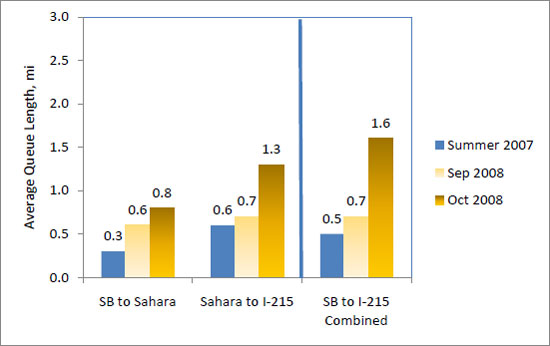
(b) Southbound
Figure 20. Effect of the Pilot Test Projects on Average Queue Length, I-15 Las Vegas.
Figure 21 presents the maximum daily queue lengths estimated during each analysis period. The summer 2007 values are actually a maximum length based on speeds averaged over one summer month (daily values were not available from that time period), whereas those for September and October 2008 are the actual daily maximum lengths. Consequently, the summer 2007 values would be expected to be substantially lower than the September and October 2008 values (which they are). Although direct comparisons to the summer 2007 values are not appropriate, the relative trends are clear and consistent. Northbound, one sees higher maximum queue lengths in both the early September 2008 and the late September-October 2008 periods, with those in the September-October 2008 the highest for both subsections and for the entire I-215 to SB interchange section.
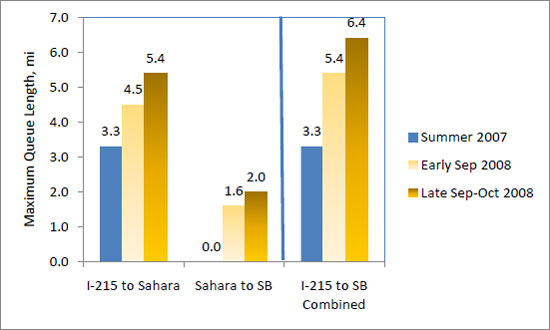
(a) Northbound
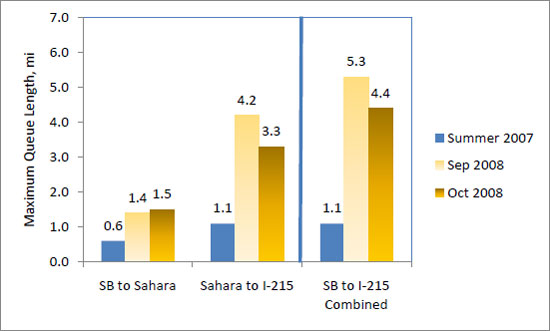
(b) Southbound
Figure 21. Effects of Pilot Test Projects on Maximum Queue Lengths, I-15 Las Vegas.
Southbound, the effects of the projects on maximum queue lengths are less clear. In fact, the value in the September 2008 period was higher than that observed in the October 2008 period for the SB interchange to Sahara Avenue subsection, and for the entire SB interchange to I-215 section.
Table 41 provides a summary of the changes in each of the queue performance measures in each of the subsections and the entire freeway segment when the north project lane closures were installed, and then when the south project lane closures were added.
| Queue Measure of Interest | Northbound | ||
|---|---|---|---|
| I-215 to Sahara | Sahara to SB Interchange | I-215 to SB Interchange | |
| Effect of North Project on: | |||
| Duration of Queues per Day | 0.6 hr ↑ | 4.5 hr ↑ | 1.2 hr ↑ |
| Average Queue Length per Day | 0.5 mi ↓ | 0.5 mi ↑ | 0.4 mi ↑ |
| Maximum Queue Length per Day | 1.2 mi ↑ | 1.6 mi ↑ | 2.1 mi ↑ |
| Effect of South Project on: | |||
| Duration of Queues per Day | 7.1 hr ↑ | 0.4 hr ↑ | 6.7 hr ↑ |
| Average Queue Length per Day | 0.3 mi ↑ | 0.7 mi ↑ | 0.1 mi ↓ |
| Maximum Queue Length per Day | 0.9 mi ↑ | 0.4 mi ↑ | 1.0 mi ↑ |
| Queue Measure of Interest | Southbound | ||
|---|---|---|---|
| SB Interchange to Sahara | Sahara to I-215 | SB Interchange to I-215 | |
| Effect of North Project on: | |||
| Duration of Queues per Day | 0.3 hr ↓ | 2.2 hr ↑ | 0.4 hr ↑ |
| Average Queue Length per Day | 0.3 mi ↑ | 0.1 mi ↑ | 0.2 mi ↑ |
| Maximum Queue Length per Day | 0.8 mi ↑ | 3.1 mi ↑ | 4.2 mi ↑ |
| Effect of South Project on: | |||
| Duration of Queues per Day | 1.4 hr ↑ | 5.4 hr ↑ | 4.4 hr ↑ |
| Average Queue Length per Day | 0.2 mi ↑ | 0.6 mi ↑ | 0.9 mi ↑ |
| Maximum Queue Length per Day | 0.1 mi ↑ | 0.9 mi ↓ | 0.9 mi ↓ |
Next, in Table 42, the amount of time that queues exceeded specified threshold lengths (1, 2, and 3 miles) are presented for each of the three time periods. These measures again show the difficulties of attempting to examine the impacts of the two projects separately, given that the queues extend across the two subsections.
| Queue Measure | Amount of Time Each Day when Queues Exceeded: | ||
|---|---|---|---|
| 1 mile | 2 miles | 3 miles | |
| Northbound: | |||
| I-215 to Sahara Avenue | |||
| Summer 2007 | 14.6% | 10.4% | 6.3% |
| Early Sep 2008 | 14.6% | 5.0% | 0.8% |
| Late Sep-Oct 2008 | 37.2% | 22.5% | 7.6% |
| Sahara Avenue to SB Interchangea | |||
| Summer 2007 | 0.0% | 0.0% | 0.0% |
| Early Sep 2008 | 13.8% | 0.0% | 0.0% |
| Late Sep-Oct 2008 | 13.6% | 0.2% | 0.0% |
| I-215 to SB Interchange | |||
| Summer 2007 | 14.6% | 10.4% | 6.3% |
| Early Sep 2008 | 17.1% | 14.2% | 11.3% |
| Late Sep-Oct 2008 | 38.6% | 26.4% | 16.3% |
| Southbound: | |||
| SB Interchange to Sahara Avenuea | |||
| Summer 2007 | 0.0% | 0.0% | 0.0% |
| Sep 2008 | 1.6% | 0.0% | 0.0% |
| Oct 2008 | 6.0% | 0.0% | 0.0% |
| Sahara Avenue to I-215 | |||
| Summer 2007 | 2.1% | 0.0% | 0.0% |
| Sep 2008 | 2.5% | 0.9% | 0.4% |
| Oct 2008 | 23.9% | 12.3% | 5.3% |
| SB Interchange to I-215 | |||
| Summer 2007 | 2.1% | 0.0% | 0.0% |
| Sep 2008 | 4.4% | 1.1% | 0.4% |
| Oct 2008 | 25.9% | 13.8% | 10.5% |
a This subsection is less than 3 miles long
Northbound, the I-215 to Sahara Avenue subsection appears to have seen a drop between summer 2007 and early September 2008 in the percentage of time when long (greater than 2 miles) queues were present. This is then followed by a large increase once the lane closures in this subsection were installed in late September-October 2008. For the Sahara Avenue to SB interchange subsection, the amount of time that queues were between 1 and 2 miles increased both in the early September 2008 and the late September-October time periods, relative to the summer 2007 period. Overall, the north project lane closures appears to have increased the percentage of time of 2 and 3 mile queues in early September, and these percentages again increased with the installation of additional south project lane closures in late September-October 2008.
Southbound, the effects are more consistent with expectations, since there is less interaction of impacts between the north and the south project within the limits of available traffic surveillance data from the SB interchange to I-215. A clear trend towards higher percentage of times each day with longer queues are evident in both subsections, and in the entire SB Interchange to I-215 segment.
Finally, the extent to which daily traffic is impacted by the presence of queues is presented in Figure 22. Northbound, the interaction of the two projects upon mobility impacts is again evident. The I-215 to Sahara subsection showed just a small (4 percent) increase in the amount of daily traffic that experienced congestion between summer 2007 and early September 2008, indicating that the north project lane closures had little effect upon this measure. Then, once the south project lane closures were put in place, the amount of traffic experiencing congestion more than doubled (from 24 percent of daily traffic in early September to nearly 60 percent in late September-October 2008). For the northern subsection (Sahara Avenue to the SB interchange), the north project lane closure effects are very evident. Between summer 2007 and early September 2008, this subsection of I-15 changed from having no congestion effects (zero percent of daily traffic experiencing congestion) to more than 24 percent of traffic experiencing queuing in the early September 2008 period. This percentage continued even after the south project lane closures were installed in late September-October 2008, which should have had some amount of metering effect upon northbound traffic approaching from I-215.
Southbound, the measures in Figure 22 (b) again mostly reflect the effects of the south project lane closures. The north subsection (SB interchange to Sahara Avenue) actually saw the percent of daily traffic encountering congestion decrease slightly from 17.6 percent to 9.8 percent between summer 2007 and September 2008, and return to slightly higher levels (20.9 percent) once the southbound lane closures in the south project were installed. In the southern subsection, the percent of daily traffic experiencing congestion increased both in the September 2008 and again in the October 2008 time period. As previously discussed, it is hypothesized that rubbernecking of northbound lane closures and congestion in that subsection is responsible for the increase in September 2008, and the southbound lane closures in October 2008 then resulting in the additional amount of traffic exposure to queues. Looking at the entire I-215 to SB interchange section as a whole, one sees the effects of both the north and south projects in the northbound direction, and two levels of effects of the south project (one due to driver rubbernecking and the other due to actual lane closures).
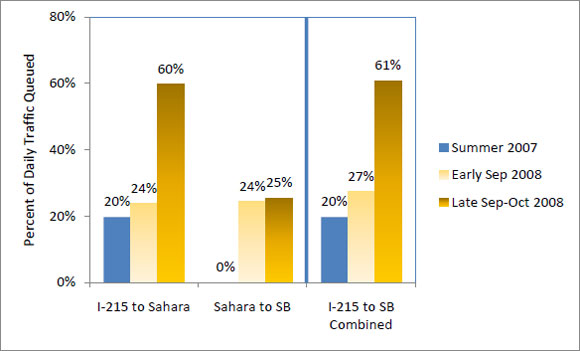
(a) Northbound
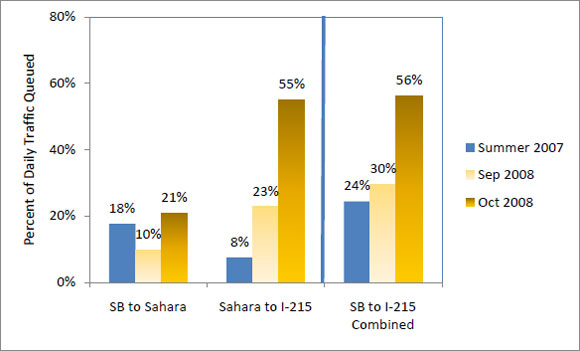
(b) Southbound
Figure 22. Percent of Daily Traffic That Encounters Queuing, I-15 Las Vegas.
Delay Measures
Separate analyses of the two subsections examined with the queuing measures could not performed for delays because the DMS sign travel times from the FAST system used for the analysis were available only for the full section length. These data were available through February 2009, whereas the individual sensor data (speeds, volumes) were only available through October 2008. Use of the DMS travel time data allowed for the analysis of the differences between the right lane and median lane closures (the median lane closures were installed in December 2008).
Delay measures for both northbound and southbound are provided in Table 43. For purposes of this analysis, average speeds less than 55 mph were taken to represent delay. Northbound, recurrent congestion in summer 2007 (before either project began) totaled 1,030 vehicle-hours of delay per day. This equated to an average of less than 1 minute per vehicle using the facility each day, and only an average of 1.2 minutes per vehicle that encountered congestion each day. These values were somewhat higher in early September 2008 when the north project lane closure was in place, but the south project lane closures had not yet began. In this time period, a total of 2,411 vehicle-hours of delay were incurred each day in this section of freeway. On a per vehicle basis, these equated to 1.6 minutes per entering vehicle and 5.9 minutes per vehicle encountering congestion, on average. Depending on the day, however, brief occurrences of delays reached as much as 16.2 minutes during this period.
| Time Period | Minutes of Delay | Veh-Hrs per Day | ||
|---|---|---|---|---|
| Average per Entering Vehicle | Average per Queued Vehicle | Maximum per Queued Vehicle | ||
| Northbound | ||||
| Summer 2007 | 0.8 | 1.2 | n/a | 1,030 |
| Early Sep 2008 | 1.6 | 5.9 | 16.2 | 2,411 |
| Late Sep -Nov 2008 | 2.3 | 5.0 | 21.2 | 3,417 |
| Dec 2008-Feb 2009 | 3.4 | 6.7 | 30.9 | 5,019 |
| Southbound | ||||
| Summer 2007 | 0.4 | 0.4 | n/a | 536 |
| Sep 2008 | 0.2 | 0.5 | 11.8 | 313 |
| Oct-Nov 2008 | 5.4 | 8.1 | 24.2 | 8,621 |
| Dec 2008-Feb 2009 | 5.1 | 7.4 | 29.1 | 7,951 |
The late September through November 2008 time period involved both the north project lane closure and the south project lane closures in the right lane and shoulder. The addition of the south project lane closures further increased congestion, such that 3,417 vehicle-hours of delay per day were experienced by motorists during this period. On a per-vehicle basis, this equated to 2.3 minutes per entering vehicle and 5.0 minutes per vehicle encountering congestion. The restriction of roadway capacity at various points in the south project also caused higher spikes in delay during the period, as the maximum delay per vehicle increased to 21.2 minutes.
Delays northbound increased still more once the right lane and shoulder closures in the south project were replaced with a median lane closure in December 2008. For the December 2008 to February 2009 period, 5,019 vehicle-hours of delay were experienced per day by motorists, nearly five times that of the summer 2007 period before the work zones were in place. This delay equated to 3.4 minutes of delay per entering vehicle, and 6.7 minutes per vehicle encountering congestion on this freeway section. During this period, delays reached as much as 30.9 minutes per vehicle on certain days and times. This was somewhat surprising, given that NDOT officials had commented that they believed that traffic flow had improved when the right lane and shoulder closures were replaced with median lane closures in the project. It is possible that the somewhat contrary results northbound were due to spillback effects from the north project that masked any benefits that the lane closure switch in the south project had upon traffic flow.
As shown in Table 43, delays in the southbound direction also increased significantly as a result of construction activities and lane closures in the south project. Whereas delay in summer 2007 and September 2008 averaged between 313 and 536 vehicle-hours per day, it grew to 8,621 vehicle-hours per day in October-November 2008, more than a 15-fold increase. Average delays per entering vehicle also increased significantly from less than a minute to more than 5 minutes per vehicle, and the average delay per queued vehicle grew to 8 minutes per vehicle. Maximum delays also doubled once the lane closures were installed, from 11.8 minutes per queued vehicle in September 2008 to 29.1 minutes in the December 2008 to February 2009 time period.
It is important to note that delays during the south project lane closures actually did decrease slightly (by about 8 percent) in the December 2008-February 2009 time frame when the median lane was closed as compared to the October-November 2008 time frame when the right lane and shoulder was closed. Although such an improvement was not evident in the northbound delay data, delays southbound did suggest that conditions were improved slightly by the lane closure switch to the median. These results further suggest that the effects of the two projects on northbound traffic are intertwined, making it difficult to isolate the effects of one project or the other upon overall traffic conditions.
Finally, as an accuracy check, the travel times extracted from the DMS FAST database were compared to field-collected travel times gathered during the second week of February 2009. Table 44 summarizes the results of that comparison. Overall, the travel times estimated from the FAST system replicated those obtained in the field fairly well. On average, the FAST travel times averaged about 1 to 2 minutes (10 to 13 percent) longer over the 7-mile section than the field measured values. Meanwhile, Pearson Correlation Coefficients were very high, ranging between 0.790 and 0.913.
| Northbound | Southbound | |
|---|---|---|
| Average Travel Time from FAST | 14.2 min | 12.1 min |
| Average Travel Time from Field Studies | 12.3 min | 11.0 min |
| Difference | 1.9 min | 1.1 min |
| Z-Statistic | 6.49 | 4.75 |
| Pearson Correlation Coefficient | 0.913 | 0.790 |
Travel Time Reliability Measure
The final performance measure examined for these two pilot test projects was the effect of the work zones upon travel time reliability along this section of I-15. Reliability was not a measure examined at the previous pilot test project locations, as travel times in the absence of the work zone lane closures were very steady (there was enough excess roadway capacity available to maintain very stable traffic speeds on the facility). Hence, the total effect of the work zones upon reliability is represented by the additional delays created on those days and nights when lanes were closed and congestion developed due to the capacity restrictions. For the two I-15 projects, however, some degree of travel time unreliability already existed during a portion of the day prior to the start of the projects. Consequently, it was necessary to measure how reliability was changed relative to the before condition, similar to the need to compare queues and delays during the projects to those that existed before the project began.
The term “buffer index” was selected as the main reliability measure evaluated. This index represents the percentage increase in average travel times that a person must allocate to their trip in order to be sure they will arrive on time most of the time. Traditionally, “most” has been defined as arriving early or on time 19 out of 20 trips (i.e., 95 percent of the time). Other definitions are possible, however. For example, a buffer index based on the 80th-percentile trip time would mean that drivers arrive early or on time four out of every five trips (i.e., they would typically be late once every five days).
Table 45 and Table 46 present buffer indices computed for both the 95th and 80th percentile travel time thresholds. Individual travel times by time period each day were not available for the summer 2007 time period; however, overall travel times each hour were obtained for July 2008. Given that the lane closures in the north project were initiated in mid-July, it was possible to estimate the buffer index in early July 2008 as the “before” condition. The other periods reflect the north project effects, the combined effects of the north and south projects with right lane and shoulder closures, or the combined effects of the north and south projects with a median lane closure in place, respectively.
From Table 45, the north project lane closures are seen as increasing the buffer index in both the northbound and southbound directions of travel between I-215 and the SB interchange. The buffer index was already rather large during midday hours northbound, and this was further exacerbated by the introduction of the north project lane closures. Interestingly, the additional lane closures installed in the south project in late September only resulted in a slight incremental increase in the buffer index during this period (from 70.5 to 77.3 percent, and then to 80.3 percent when the median lane closures were installed in December 2008). Meanwhile, the effects of the south project lane closures was more substantial in both the peak periods, rising from a buffer index of 9 percent to 37.3 percent and then to 61.9 percent in the morning peak, and from 46.6 percent to 49.2 percent and then 63.9 percent in the evening peak. In the southbound direction, the north project lane closures have very little influence on travel time reliability. In fact, the buffer index from late July through September 2008 is actually less than in early July 2008 during the midday hours. Once lane closures are installed in the south project, significant increases in the buffer index are seen in all time periods. Interestingly, the buffer index is slightly higher in the midday and evening peak hours when the median lane was closed in the south project as compared to the right lane and shoulder closures, even though NDOT and FHWA reported that traffic flow was smoother in the median lane closure condition (the index did decrease in the morning peak period, however).
| Time Period | AM Peak (6-9 am) |
Midday (9 am – 3 pm) |
PM Peak (3-6 pm) |
|---|---|---|---|
| Northbound | |||
| Early Jul 2008 | 5.5% | 55.0% | 22.2% |
| Late Jul-Early Sep 2008 | 9.0% | 70.5% | 46.6% |
| Late Sep -Nov 2008 | 37.3% | 77.3% | 49.2% |
| Dec 2008-Feb 2009 | 61.9% | 80.5% | 63.9% |
| Southbound | |||
| Early Jul 2008 | 5.6% | 24.7% | 22.3% |
| Late Jul-Sep 2008 | 17.0% | 17.1% | 34.9% |
| Oct-Nov 2008 | 56.3% | 62.5% | 60.6% |
| Dec 2008-Feb 2009 | 35.4% | 77.2% | 70.1% |
The trends are slightly different if the 80th percentile travel time is used as the basis for computing the buffer index. As depicted in Table 46, the lane closures installed on the north project had very little effect on the buffer indices northbound. The only significant change was during the evening peak when the index increased from 11.5 to 22.6 percent. Even more surprising is the fact that the introduction of lane closures in the south project significantly increased the northbound buffer index in the morning peak (from 1.4 percent to 20.5 percent), but had little effect on the midday or evening peak indices. In fact, the midday buffer index actually decreased in the late September to November period, and was only slightly higher (relative to the late July-early September period) once the lane closures were moved to the median lane in December 2008. Southbound, the north project lane closures had no effect whatsoever on the buffer index. Only when the south project lane closures were installed in October 2008 does the buffer index increase substantially in all time periods.
| Time Period | AM Peak (6-9 am) |
Midday (9 am – 3 pm) |
PM Peak (3-6 pm) |
|---|---|---|---|
| Northbound | |||
| Early Jul 2008 | 1.7% | 28.9% | 11.5% |
| Late Jul-Early Sep 2008 | 1.4% | 34.4% | 22.6% |
| Late Sep -Nov 2008 | 20.5% | 32.7% | 25.1% |
| Dec 2008-Feb 2009 | 31.9% | 39.0% | 33.1% |
| Southbound | |||
| Early Jul 2008 | 2.9% | 5.3% | 5.5% |
| Late Jul-Sep 2008 | 3.2% | 2.0% | 4.3% |
| Oct-Nov 2008 | 24.2% | 31.2% | 37.2% |
| Dec 2008-Feb 2009 | 15.0% | 26.9% | 30.0% |
KEY FINDINGS FROM THE I-15 PILOT TESTS
The analysis of impacts from the two pilot test locations on I-15 in Las Vegas, NV proved to be a much more involved process, due to the fact that lane closures which significantly impact capacity were installed on a long-term basis in both projects. Projects which limit lane closure activity to off-peak hours when traffic congestion is not normally present on the roadway allow a reasonable assumption to be made that any impacts are due solely to the work zone lane closure. When long-term lane closures occur in locations where recurrent congestion is already present, such a simplifying assumption cannot be made. Rather, the effects of the lane closures at these I-15 projects were combined with the recurrent congestion already being experienced on this facility before the projects began. Therefore, information about travel conditions before the projects began was required so that incremental changes in performance measures could be estimated during each project. The analysis was also complicated by the fact that both projects were located close enough to each other that their impacts on travel were intertwined. Overall, however, it is apparent that the long-term lane closures at these two projects did have a significant effect on travel conditions within the corridor.
Several useful insights regarding work zone performance measurement were obtained from this analysis. Many of them were similar to those reported for the other pilot test locations as well. However, one unique finding from these two projects is that a travel time reliability measure (buffer index) can be another way of assessing the mobility impacts of work zones in regions already experiencing some degree of congestion on the facility prior to initiating work activity on the project. The roadway capacity reductions caused by long-term work zone lane closures make travel times more susceptible to fluctuations in daily demand, as well as to incidents. Since the available capacity through the roadway segment is constrained, incidents that occur will have a greater affect on travel because they create an incrementally larger reduction in the available capacity than when all lanes were open. The end result is that the predictability of travel times through the work zone may become more unreliable. A travel time reliability measure can be used to track this variability and enable better work zone management and public information.
The results from the I-15 sites also illustrate the value of having a functional TMC available for evaluating work zone mobility impacts in a more complex urban environment. The additional analysis that can be performed with the larger data set is evident by the range of tables and charts in this chapter that were not prepared for the other sites. The availability of TMC data also allows the work zone analyst to compute vehicle exposure much more accurately than would otherwise be possible. Furthermore, when recurrent congestion already occurs on a roadway segment prior to the initiation of the work zone, detailed traffic data that can be obtained from a TMC allow analysts to evaluate both spatial and temporal changes in those congestion patterns. In addition, the effect of work zone capacity reductions upon non-recurrent congestion effects, measured in terms of travel time reliability, can also be evaluated when TMC data are available.
The results of the I-15 pilot tests illustrate the importance of selecting performance measures that are appropriate to the various types of projects and project conditions. For example, for projects like the I-15 ones where there are long-term lane closures, the value of certain exposure measures such as the percent of time when work activities involve lane closures has little meaning. Agencies should consider stratifying projects on the basis of lane closure strategy employed when examining overall trends across projects in a district or region over time.
previous | next