E. Sample Appendices – Minor-to-Moderate Impacts (Sample TMP 1)
A. Operational Analysis Summary
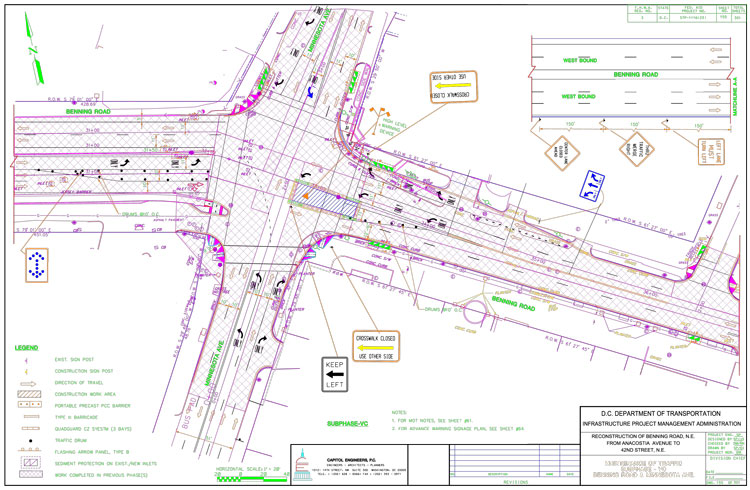
B. Temporary Traffic Control Plans (Sample)
C. Post Project Evaluation Report
A. Operational Analysis Summary
Operational Analysis
Data Collection and Modeling Approach – The study team collected a wide range of geometric, traffic flow, traffic control, and operational data elements. Annual Average Daily Traffic (AADT) values were obtained from DDOT 2007 Traffic Volumes Map. This data was projected by using 1 percent growth factor to obtain the future conditions, 2008 AADT. Turning movement counts were conducted at five locations (shown in Figure: 1) to understand the traffic flow characteristics.
- Benning Road/Minnesota Avenue, NE.
- Benning Road/E. Capitol Street, NE.
- Minnesota Avenue/E. Capitol Street/Ames Street, NE.
- 17th Street SE /Independence Avenue, SE.
- 21st Street NE/C Street, NE.
Existing Traffic Operations – There are 33 signalized intersections (see below) within the study area. The Synchro file for the influence area was obtained from DDOT.
- 17th Street/ Benning Road, NE.
- 17th Street/Gales Street, NE.
- 17th Street/D Street, NE.
- 17th Street/ C Street, NE.
- 17th Street/Constitution Avenue, NE.
- 17th Street/E. Capitol Street, NE/SE.
- 17th Street/ Independence Avenue SE.
- 18th Street/C Street, NE.
- 19th Street/ Benning Road, NE.
- 19th Street/E Street, NE.
- 19th Street/C Street, NE.
- 19th Street/E Capitol Street, NE.
- 19th Street/Independence Avenue, SE.
- E. Capitol Street/22nd Street/ RFK Stadium, NE.
- E. Capitol Street/22nd Street/ RFK Stadium, SE.
- 21st Street/ Benning Road, NE.
- 21st Street/ C Street, NE.
- 24th Street/ Benning Road, NE.
- 26th Street/Benning Road, NE.
- Oklahoma Avenue/ Benning Road, NE.
- Minnesota Avenue/Benning Road, NE.
- Minnesota Avenue/Grant Road, NE.
- Minnesota Avenue/Ames Street/E. Capitol Street, NE.
- Minnesota Avenue/Ridge Road, NE.
- Minnesota Avenue/B Street, SE.
- E. Capitol Street/ Stoddert Place, SE.
- Minnesota Avenue/Dix Street, NE.
- Benning Road/Anacostia Avenue, NE.
- Benning Road/34th Street, NE.
- Benning Road/42nd Street, NE.
- Benning Road/44th Street, NE.
- Benning Road/E. Capitol Street/Central Avenue, NE.
- E Capitol Street/Texas Avenue, SE.
Crash History – Crash history of the influence area indicates a very high percentage of rearend and sideswipe crashes, followed by right-angle crashes. Table 2, below, provides a summary of crashes for the period 2004 to 2006.
| Crash Type | Crash Count | Percentage | Crash Count | Percentage |
|---|---|---|---|---|
| Benning Road NE from Anacostia Avenue NE to E. Capitol Street, NE |
Influence Area, Shown in Figure 1 |
|||
| Right Angle | 58 | 11.46 | 157 | 9.78 |
| Left Turn, Hit Vehicle | 47 | 9.29 | 124 | 7.73 |
| Right Turn, Hit Vehicle | 9 | 1.78 | 32 | 1.99 |
| Rear End | 174 | 34.39 | 449 | 27.98 |
| Sideswipe | 131 | 25.89 | 410 | 25.55 |
| Head On | 10 | 1.98 | 47 | 2.93 |
| Parked Vehicle | 11 | 2.17 | 97 | 6.04 |
| Fixed Object | 14 | 2.77 | 74 | 4.61 |
| Run-Off-Road | 0 | 0.00 | 8 | 0.50 |
| Left Turn, Hit Pedestrian | 3 | 0.59 | 8 | 0.50 |
| Right Turn, Hit Pedestrian | 2 | 0.40 | 8 | 0.50 |
| Backing, Hit Pedestrian | 2 | 0.40 | 5 | 0.31 |
| Straight, Hit Pedestrian | 15 | 2.96 | 64 | 3.99 |
| Backing, Hit Parked Vehicle | 3 | 0.59 | 16 | 1.00 |
| Backing, Hit Moving Vehicle | 3 | 0.59 | 11 | 0.69 |
| Backing, Hit Stopped Vehicle | 5 | 0.99 | 14 | 0.87 |
| Non-Collision Accident | 4 | 0.79 | 5 | 0.31 |
| Other | 15 | 2.96 | 76 | 4.74 |
Based on the crash history, it is recommended that all intersections be monitored throughout construction for an increase in crashes resulting from work zone implementation. In particular, special attention should be paid to Benning Road where it intersects with:
- Oklahoma Avenue, NE.
- Anacostia Avenue, NE.
- 34th Street, NE.
- Minnesota Avenue, NE.
- 42nd Street, NE.
- E. Capitol Street, NE.
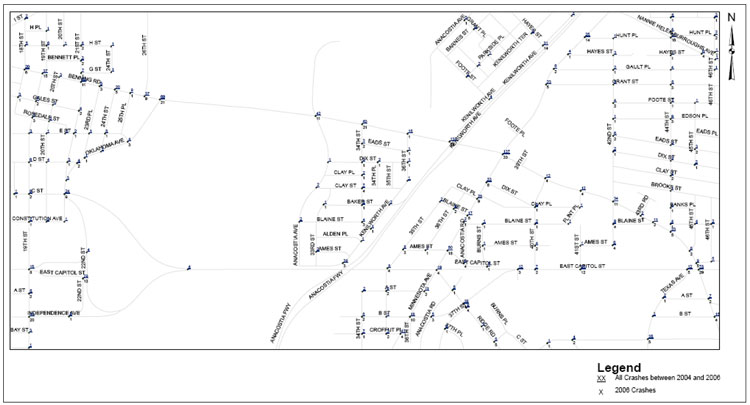
Figure 1: Crash Map of the Influence Area
Work Zone Impact Assessment
The following assessment includes a brief discussion about how the project is expected to affect the work zone vicinity. This provides an estimate of how traffic demand and traffic patterns are expected to change because of the construction. Also, it gives an idea of areas of potential concerns.
TRAFFIC ANALYSIS
The traffic analysis detailed below helps to assess the impact of the construction phasing on motorists delay and queues.
The Study Team used the DDOT Synchro Model as a basis for developing the traffic model of the project influence area. Traffic analysis was performed for existing and proposed construction conditions. The construction is proposed to take place in five phases, each of which was analyzed independently. The analysis did not consider the sub-phases of any phase. Measures of effectiveness (MOEs) such as level of service (LOS), delays, and queue lengths were reported. Table 2 shows the MOEs for the projected construction traffic for each phase as compared against existing conditions.
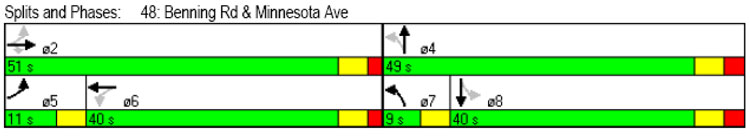
Results – While the LOS decrease on some segments, the overall LOS remained acceptable, as Table 2 shows. The analysis also indicates significant delay at Benning Road and Minnesota Avenue for Phase 1, NE (see Table 2 for WB movement information). It is recommended that DDOT review/modify the signal timing as shown below and monitor the intersection throughout the project.
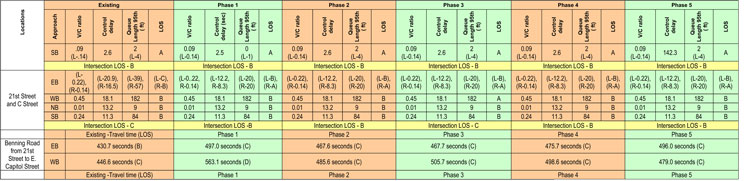
As the projected impacts are below DDOT allowable thresholds[1] for arterials, the proposed TMP (MOT, TO, PI&O) may be implemented in line with the recommendation of this analysis. Figure 2 provides an estimate of travel time (Benning Road from 21st Street to E. Capitol Road) by work zone phasing considering unforeseen conditions.
Table 2: Traffic Analysis Summary (Comparison of Existing with Proposed Phasing I-V)
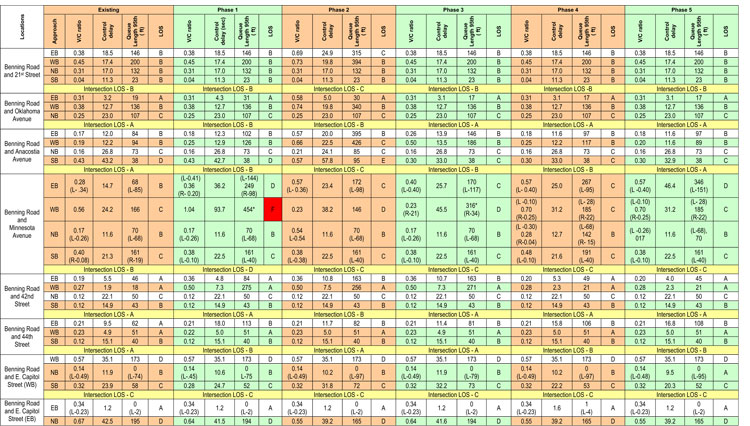
Notes: *95th percentile volume exceeds capacity and queues may be longer. R – Dedicated right-turn, L – Dedicated left-turn
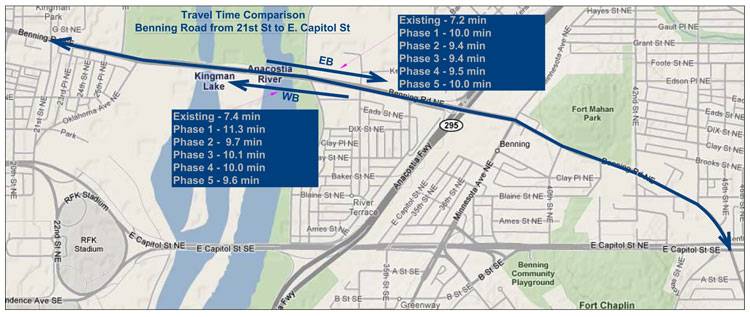
Figure 2: Travel Time Comparison—Benning Road from 21st Street to E. Capitol Street
ANTICIPATED WORK ZONE IMPACTS
Public Transportation – The MOT Plans show bus stop locations affected by lane closures. These and other similarly affected locations must be monitored to minimize public inconvenience and ensure full accessibility. While all bus routes are maintained, they also must be monitored to ensure scheduled viability.
Community Accessibility – The Contractor shall advise residents affected by alley access resulting from temporary closures in writing to take alternative alley egress and ingress. Residents affected by driveway access resulting from temporary closure shall be advised in writing by the contractor to park their vehicles in nearby parking zones. Community meetings are suggested during various stages of the project
Non-motorized Assessment – Temporary crosswalks and all other affected crosswalks and sidewalks, as shown in the MOT plans, must be monitored throughout the construction for safety and full accessibility. All pedestrian temporary provisions must comply with ADA and other District requirements.
Utility – Utility impacts were not included in this analysis.
B. Temporary Traffic Control Plans (Sample)
Only sample TTC plan is included here for reference, to manage the file download size. Generally all the TTC plans are included in TMP.
C. Post Project Evaluation Report
| Describe Areas of the TMP that were Most Successfully Implemented & Why |
|---|
| Describe Areas of the TMP that were Least Successfully Implemented & Why |
| Summarize/Describe all Changes Necessary to Correct Oversight of the Original TMP |
| Summarize the Effectiveness of Each Change Made to the TMP |
| Summarize the Type and Frequency of Legitimate Complaints Received |
| Describe/Summarize Road User Mobility Impacts Observed During Work |
| Describe/Summarize Crashes and Incidents that Occurred During the Work |
| Describe/Summarize Road Safety Impacts Observed During Work |
| Suggested TMP Improvements or Changes for Future Similar Projects |
This completed assessment shall be forwarded to the Project Manager and Team Leader following approval below.
| DDOT Project Manager | DDOT Team Leader |
|---|---|
| Signature: | Signature: |
| Name: | Name: |
| Date: | Date: |