US-131 Kalamazoo, Michigan
In the summer of 2004, the Michigan Department of Transportation (MDOT) deployed ITS technology in a work zone on US-131 in Kalamazoo. MDOT deployed the Dynamic Lane Merge (DLM) System in the northbound direction of US-131 just south of the M-43 freeway. Such systems are deployed to control traffic at merge areas by promoting early merge (smoothing flow by creating a no passing zone upstream of the closure) or late merge (encouraging motorists to use both lanes to minimize queue spillover). Dynamic Early Merge Systems, such as the one deployed at this site, smooth traffic flow at merge areas by activating an enforceable no passing zone upstream of the taper. MDOT has successfully used this type of system on multiple occasions in the past to mitigate impacts caused by work zone capacity reductions. The study team collected data during a two-week period in September 2004 to evaluate the benefits of the system.
The main objectives of the system deployment were to:
- Reduce aggressive driving at the merge point where two lanes were reduced to one in each direction.
- Smooth traffic flow through the merge area.
- Potentially reduce delay from aggressive passing at the merge area.
The main objectives of the evaluation were to:
- Quantify ITS impacts on aggressive driving.
- Quantify safety and mobility impacts.
- Verify that the work zone ITS functioned as designed.
For an early merge DLM system, MDOT previously identified an effectiveness range (demand that warrants use of the system) of 2,000 to 3,000 vehicles per hour for two-to-one lane drop configurations. The effectiveness range exceeds capacity since queue conditions cause aggressive maneuvers and forced merges. While these numbers exceed the capacity of one lane on a freeway, the effectiveness range includes the level of demand that is needed to improve conditions over what would have been observed without the early merge system. As shown in the following figure, a sample set of past peak hour volume counts for I-131 fell within this range.
Figure 11. 2003 Peak Hour Volume Counts on US-131
The system deployment schedule mirrored the construction schedule, leaving little opportunity for establishment of baseline conditions (the "without ITS" scenario). Since demand levels were similar in both directions, the study team had planned to analyze the southbound approach to the merge area as the "without ITS" condition and the northbound approach as the "with ITS" condition. While this approach was not exactly the same as a true before and after study, it was designed to try to provide a reasonable comparison of a traditional merge setup with a dynamic merge setup. From the past volume data, the northbound and southbound afternoon peak period showed the most similar demand levels. The study team collected data for each afternoon peak period.
Study Site Work Zone
US-131 is a four lane divided freeway with a normal speed limit of 70 mph that connects Kalamazoo and Grand Rapids, Michigan. The contractor set up the work zone along US-131 from north of M-43 (exit number 38) to north of M-89 (exit number 49) in the cities of Kalamazoo and Plainwell. MDOT reduced the speed limit through the work zone from 70 mph to 60 mph. The northbound Annual Average Daily Traffic (AADT) is approximately 29,000 and the southbound AADT is approximately 23,000. MDOT deployed the system in the northbound direction, although demand levels in both directions fell within the range for implementation based on the 2003 traffic counts. The work zone was approximately 11 miles in length from beginning sign to end sign. The DLM system was deployed in the approximately one mile section of roadway leading up to the merge point just south of the lane closure.
The contractor commenced construction on June 3, 2004, and finished on November 19, 2004. The construction involved pavement rehabilitation and included concrete and asphalt overlays. The contractor performed the first and second phases on the northbound and southbound sides of the highway, respectively. During the first phase, the contractor shifted traffic and set up two-way traffic (one lane in each direction) on the northbound side. The contractor used the same traffic control configuration for Phase II, but this time transferred all traffic to the southbound side (two way traffic, one lane in each direction). Concrete barriers separated traffic during each phase.
ITS Description
MDOT designed the DLM System to require traffic to merge early to smooth traffic flow and reduce aggressive driving at the merge point. MDOT installed five trailers 1500 feet apart prior to the merge point, each equipped with lighted "Left Lane Do Not Pass When Flashing" signs. The trailer closest to the merge was always flashing. MDOT equipped each trailer with a Remote Traffic Microwave Sensor (RTMS) unit, with the exception of the trailer furthest from the work zone. MDOT procured the system through a vendor subcontract through the prime construction contract.
The closed loop system operated based on traffic occupancy. For example, when sensor #1 detected the threshold occupancy, sensor #1 sent a message to sensor #2 alerting it to activate the flashing lights. The occupancy thresholds for sensors 1, 2, 3, and 4 were 5 percent, 7 percent, 9 percent, and 11 percent, respectively. Each sensor had a 5-minute minimum activation period.
The Dynamic Lane Merge System was comprised of the following components:
- 4 sets of traffic sensors.
- 5 trailers with a flasher, solar power equipment and batteries.
- Message signs.
- Communication devices.
The layout for the system is shown in the following figure.
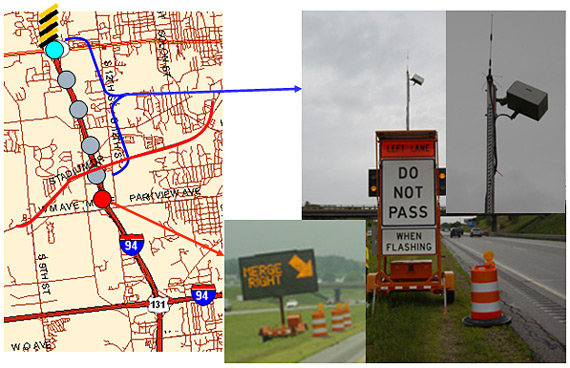
Figure 12. DLM Layout Along Northbound US-131
Measures and Metrics
The study team developed a set of hypotheses and associated measures of effectiveness (MOEs) around the key goals for the system, as shown in Table 11.
| Hypothesis | Measures of Effectiveness | Data Sources |
|---|---|---|
| The use of ITS in work zones will enhance the safety performance of the highway | Crashes, incidents, aggressive maneuvers, citations issued | Crash data, direct observations, citation logs |
| The use of ITS in work zones will reduce traveler delay | Travel times through the merge area, average speeds, and average and maximum queue lengths | Direct observations, system data, travel time runs |
While the study team originally intended to use the southbound side (without ITS) as the comparison site, congestion was not an issue on the southbound side, which meant that it would not be a good comparison. Therefore, the study team compared the time periods when the system was flashing (i.e. activated) with the time periods when the system was not flashing (i.e., not activated—trailers upstream of trailer 1 were not flashing), all for the northbound direction of travel instead of comparing northbound to southbound.
The study team collected data for a 2-week period from September 20 through October 1, 2004. During this period, study team members performed travel time runs, using Global Positioning System (GPS)-equipped vehicles, in each direction from 3:30 p.m. until 6 p.m. each weekday. The study team also collected traffic count data along two mainline areas and seven ramp areas to determine demand at different locations with the merge areas. A modem was installed on one trailer and MDOT archived sensor data for August, September, and October for use in the evaluation.
Findings
Hypothesis 1: The Use of ITS in Work Zones Will Enhance the Safety Performance of the Highway
Since one of the main deployment objectives was to reduce aggressive maneuvers, the study team collected data on several different types of aggressive driving behavior for analysis. During each travel time run, a passenger in each vehicle observed driver behavior within both the northbound and southbound merge areas. Notes were recorded based on the following categories.
- Lane straddling by tractor-trailers or other vehicles to block vehicle passing.
- Motorists illegally passing in the northbound US-131 passing lane when the dynamic lane merge signs are flashing "Do Not Pass."
- Dangerous merges, or forced early merges (people slamming brakes to merge, forcing vehicle into other traffic lane, people responding to flashing "Do Not Pass" signs improperly, etc.)
- Forced merges at/near the lane drop.
Study team members also noted observations that describe the environment at each of six specified areas shown in Figure 13. The study team observed conditions to:
- Document which of the five dynamic merge signs were flashing in the northbound travel direction during each pass through the area
- Document an enforcement presence or lack thereof for each run along with any incidents that may have affected the traffic flow during the travel time run (crash, construction vehicles, stalled vehicle, etc.).
Tables 12 and 13 show the aggregate daily observations within each area for the two-week period. The information in the tables classifies the aggressive maneuvers into separate categories based on type, and also shows whether the study team observed the system flashing (at least one trailer except the first since it was always flashing) and whether police were present. Study team members noted only one instance of queuing in the southbound direction and there were no forced merges observed at the lane drop. While conducting the travel time runs, the study team made observations as noted in the tables for metrics such as whether the system was activated; whether lane straddling, illegal passing maneuvers, or dangerous merge maneuvers occurred; whether police officers were present; whether there were incidents; whether there were forced merges; and whether queues were present.
| Date | # of Runs | On Flash? | Lane Straddling | Illegal Passing | Dangerous Merge | Police | Incident | Forced Merge | Queue |
|---|---|---|---|---|---|---|---|---|---|
| 09-20-04 | 15 | 0 | 0 | 28 | 8 | 0 | 2 | 4 | 0 |
| 09-21-04 | 12 | 0 | 0 | 22 | 3 | 0 | 1 | 2 | 0 |
| 09-22-04 | 13 | 0 | 0 | 25 | 1 | 4 | 3 | 2 | 1 |
| 09-23-04 | 13 | 0 | 0 | 39 | 4 | 0 | 0 | 1 | 0 |
| 09-24-04 | 13 | 52 | 16 | 70 | 5 | 0 | 0 | 0 | 16 |
| 09-27-04 | 12 | 0 | 0 | 26 | 0 | 3 | 8 | 0 | 1 |
| 09-28-04 | 13 | 0 | 1 | 27 | 2 | 0 | 0 | 2 | 0 |
| 09-29-04 | 13 | 0 | 0 | 39 | 0 | 0 | 0 | 5 | 0 |
| 09-30-04 | 13 | 0 | 0 | 30 | 1 | 0 | 0 | 0 | 0 |
| 10-01-04 | 13 | 18 | 2 | 58 | 1 | 0 | 0 | 2 | 2 |
| Total | 130 | 70 | 19 | 364 | 25 | 7 | 14 | 18 | 20 |
| Date | # of Runs | Lane Straddling | Illegal Passing | Dangerous Merge | Police | Incident | Forced Merge | Queue |
|---|---|---|---|---|---|---|---|---|
| 9-20-04 | 12 | 0 | 0 | 5 | 0 | 0 | 0 | 0 |
| 9-21-04 | 13 | 0 | 0 | 20 | 0 | 0 | 0 | 0 |
| 9-22-04 | 12 | 0 | 0 | 18 | 0 | 0 | 0 | 0 |
| 9-23-04 | 11 | 0 | 0 | 12 | 1 | 0 | 0 | 0 |
| 9-24-04 | 12 | 0 | 0 | 15 | 0 | 0 | 0 | 0 |
| 9-27-04 | 12 | 0 | 0 | 19 | 0 | 0 | 0 | 0 |
| 9-28-04 | 12 | 0 | 0 | 26 | 1 | 0 | 0 | 0 |
| 9-29-04 | 12 | 0 | 0 | 15 | 0 | 0 | 0 | 0 |
| 9-30-04 | 12 | 0 | 0 | 22 | 0 | 0 | 0 | 0 |
| 10-1-04 | 10 | 0 | 0 | 22 | 3 | 0 | 0 | 1 |
| Total | 118 | 0 | 0 | 174 | 5 | 0 | 0 | 1 |
Figure 14 highlights the significant differences in observed dangerous merge maneuvers for similar time periods at both approaches to the work zone. Since the probe vehicles were moving during data collection, an accurate exposure value or dangerous merge rate was unknown. While the southbound direction did not experience oversaturated conditions making quantitative comparisons difficult, the study team generally noted much higher total daily dangerous merge observations even with lower volumes in the southbound direction. The percentage of higher northbound traffic is also shown to highlight the fact that, even though traffic was lower in the southbound direction, more forced merges occurred.
Figure 14. Dangerous Merge Maneuvers by Approach
On the northbound approach, several days included traffic conditions that were sufficient enough to activate the DLM "Do Not Pass" flashers. Other days included lighter traffic (the flashers remained off). The study team compared traffic changes on the northbound approach when the flashers were on and off. This approach has the advantage of comparing the traffic and run conditions that existed on the northbound, but it does not constitute a true "without ITS" condition because the flashers on the trailer closer to the taper were always flashing. The flashers on Trailers 2, 3, 4, and 5, which cover locations 5, 4, 3, and 2, respectively, were on 2 out of the 10 days during data collection. Also, the study team noted police presence 2 of the 8 days the flashers were off. The study team excluded data from the days where police were present to avoid issues with traffic behavior and pattern changes due to police presence.
The 2 days that the flashers were on were compared with the 6 remaining days that the flashers were off (see Table 14). Comparisons were made on a "per-run" basis, addressing the issue of unequal number of runs between the two groups.
| System Status | # of Runs | Lane Straddling | Dangerous Merges | Forced Merges | Queue |
|---|---|---|---|---|---|
| Trailer Flashes Off | 79 | 1 (0.01/run) | 18 (0.23/run) | 14 (0.18/run) | 0 |
| Trailer Flashes On | 26 | 18 (0.69/run) | 6 (0.23/run) | 2 (0.08/run) | 18 |
The results of the comparisons show that there was a significant reduction in the number of forced merges when flashers were on, potentially reducing the risk of collisions near the merge taper. Queues were present on the days the flashers were on, indicating that vehicles likely merged in advance of the taper to avoid forced merges at Location 6. Lane straddling was significantly higher on the days that the flashers were on, indicating that some larger vehicles, including trucks, wanted to discourage illegal passing when the flashers were on. As shown in the table, the number of dangerous merges and forced merges were affected by the flashers.
Traffic citation information and crash data were also analyzed for both work zone approach areas. From July 1, 2004 through October 31, 2004, there were 67 warnings and 135 citations issued for violations of the northbound no passing zone. From June 15, 2004, through October 31, 2004, there were 23 crashes at the northbound work zone approach.
From June 1, 2004, through November 30, 2004, law enforcement officers documented 14 crashes at the southbound work zone approach. The time period for this data collection was longer due to additional activity at the north end of the construction area. Sorting data to a less aggregated level would have posed a burden on Sheriff's Office representatives. Therefore, no further analysis was performed.
Based on the effect of "Do Not Pass" flashers in the work zone, the study team concluded that the DLM system enhanced safety by reducing the number of forced merges at the lane drop, thus the hypothesis, "The use of ITS enhanced the safety performance of the highway during construction," is valid. The study team was unable to use crash and citation statistics to further prove the hypothesis.
Hypothesis 2: The Use of ITS in Work Zones Will Reduce Traveler Delay
MDOT also anticipated positive impacts to traveler delay through use of the system. Changes in travel times, average speeds, and queue lengths were the main data sources sought in the evaluation. The system detectors collected volume, speed, and occupancy data in two to three minute time increments. The probe vehicles recorded second by second speed data while traversing the corridor. The study team designed the data collection plans to use the system detector data to estimate average and maximum queue lengths.
The study team compared travel time data for the northbound and southbound directions to determine traveler delay, and analyzed travel time data for the 6 days that the flashers were off compared to travel times on the southbound approach. The data indicate that the travel times were significantly different even though the traffic volumes were similar. This result indicates that there were factors other than ITS that influenced the travel times in the northbound and/or southbound directions. The differences in road and traffic characteristics on northbound and southbound, as well as the length of the probe vehicle run necessary to traverse the corridor in each direction, may have affected the travel times.
Therefore, the study team used the same approach used in Hypothesis 1 to compare travel times on the northbound approach. The study team compared travel time data for 2 days when "Do Not Pass" lights were flashing with data from the 6 days when the lights were not flashing. A t-test showed no significant volume count difference between the two groups (Pvalue = 0.55).
The study team found that the travel time when lights were flashing was significantly higher than when lights were not flashing (Pvalue < 0.001). This increase in travel time (nearly doubled at times from a baseline travel time of 4 to 5 minutes) is expected when drivers obey the "Do Not Pass" sign as vehicles potentially reduce speed and merge at locations further away from the taper, forming an organized queue of vehicles with smoother flow through the bottleneck. Vehicles lining up in the open lane earlier than without the flashers increased the distance drivers traveled on the single lane, thus increasing the lane density and reducing the speed. Lining up vehicles in the open lane, even though slightly increasing the travel time, is a more sound traffic management technique than allowing traffic flow breakdown due to forced merges or dangerous maneuvers. From these results, the study team deems the second hypothesis, "The use of ITS in work zones will reduce traveler delay," inconclusive. The DLM system, such as was used in Michigan, may help reduce traveler delay when traffic is high enough to warrant additional activation time.
Analysis of RTMS Sensor Data
As mentioned previously, the system archived RTMS data at the second, third, fourth, and fifth trailers. Traffic demand levels through several of the locations are the same because no ramps are present. Figure 15 shows daily vehicle counts from a representative RTMS sensor and manual detectors on US 131 between Stadium Rd and route M-43.
The study team compared RTMS and tube count data for 9 of the 10 days during data collection. Data from September the 28, 2004, was discarded because of missing data. A paired t-test showed that average RTMS daily counts were 10 percent higher than daily northbound tube counts (Pvalue = 0.01). The study team is not able to draw additional conclusions from the data other than lessons learned and actions that may enhance the quality of data archived.
MDOT effectively deployed the DLM system on I-94 and, due in part to effective enforcement (a qualitative MDOT observation), realized benefits from use of the system. As noted from the reduction in aggressive maneuvers, the system positively impacted driver behavior and smoothed traffic flow at the work zone taper. One of the two hypotheses was proven valid during this evaluation.
Figure 15. Daily Traffic Counts by Approach and Detection System
Tips and Lessons Learned
Deployment Tips and Lessons Learned
Educating the police enforcement community about the system when it is first deployed is extremely beneficial. MDOT held meetings with the local police agencies to ensure adequate understanding of the system, thereby maximizing the benefits of enforcement. Police presence is an important aspect of this type of deployment, as motorists may be less likely to violate the no passing zone when police are present.
Implementing agencies should use the media to the fullest extent possible to help educate the public on the deployment. In Michigan, the DOT often invites the media to the job site to learn about the system, why it is being used, and how it works. MDOT stated that media representatives were a very important stakeholder in the process of deploying the lane merge system in Kalamazoo.
Evaluation and Research Tips and Lessons Learned
The reliability of the archived data collected was lower than expected. During this evaluation, the study team relied on archived data for some of the analysis. The reliability was lower than expected potentially due to some communication interruptions as detectors sent data back to a main computer.
Evaluators should observe field conditions to the fullest extent possible and feasible. This helps to adequately monitor and validate archived data.
Previous | Next