4. Detailed Results
This section presents the results of the 2011 WZ SA at a more detailed level. The results represent a compilation of ratings and comments submitted from 52 Divisions/States. For each section of the WZ SA, the information includes:
- An explanation of the intent of the section;
- National average ratings for each question in the section and comparative data from the 2010 WZ SA; and
- The questions asked in that section with a question-by-question discussion of the ratings, including the percentage of agencies implementing the practice asked about in the question (meaning they rated themselves at 7 or higher) and a summary of comments included by respondents in the results they submitted.
This section also provides a summary of responses to the 2011supplemental question on work zone process reviews.
Many respondents provided comments for some questions. The respondents that provided comments offer helpful examples of some of the specific practices and efforts being undertaken to make work zones work better. Examples of agency comments are included in the write-up after each question.
Another rich source of examples is the FHWA Work Zone Program website at https://www.fhwa.dot.gov/workzones.htm. The website contains work zone publications, studies, links, training information, technical resources, and best practices, as well as examples of what agencies are doing to support implementation of the Rule. A series of guides published by FHWA to assist transportation agencies in implementing the Rule (23 CFR 630 Subpart J) contains many good examples of State DOT practices in use and provides references to helpful informational resources.
Since 2007, the WZ SA has included linkages, as applicable by question, to the appropriate sections of the Work Zone Rule. As agencies worked to implement the Work Zone Rule by the October 12, 2007 deadline, these efforts have affected the ratings in a positive way.
Leadership and Policy
Agency leadership support should drive overall policy making for the agency. This support fosters an environment conducive to developing an effective work zone program. Project planning, design, and construction and maintenance activities should all incorporate consideration of work zone safety and mobility impacts and mitigation strategies. Agency management should facilitate and encourage a multidisciplinary approach to traffic management throughout all phases in the life of a project. Senior managers should be personally, visibly, and proactively involved in efforts to enhance the safety of motorists and workers in work zones and minimize work zone delays.
Goals provide high-level direction and establish expectations for agency staff. Clear and specific goal statements such as "Reduce congestion and delay in work zones by 10 percent in 5 years" establish a basis on which to develop strategies and actions. Use of performance measures helps to assess progress toward fulfillment of a goal. For example, to track progress toward reduction of work zone delays, an agency may gather information regarding the total vehicle hours of delay for a sample of work zones and track these values over time.
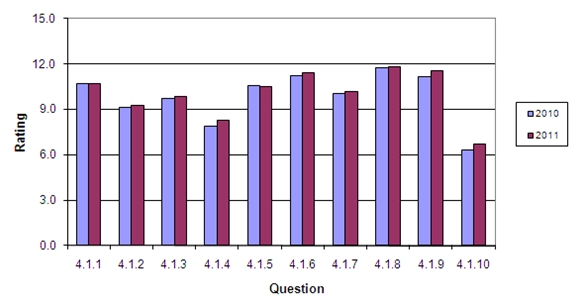
Figure 2 shows the average rating by question for 2010 and 2011 for the Leadership and Policy section. Table 3 shows the numeric ratings along with the percent change from 2010 to 2011 for each question.
Figure 2. Results for Leadership and Policy
Section
| Section | 2010 | 2011 | Change | Percent Change |
|---|---|---|---|---|
| 4.1.1 | 10.7 | 10.7 | 0.0 | 0% |
| 4.1.2 | 9.1 | 9.3 | 0.2 | 2% |
| 4.1.3 | 9.8 | 9.8 | 0.1 | 1% |
| 4.1.4 | 7.9 | 8.3 | 0.4 | 5% |
| 4.1.5 | 10.6 | 10.5 | -0.1 | -1% |
| 4.1.6 | 11.2 | 11.5 | 0.2 | 2% |
| 4.1.7 | 10.1 | 10.2 | 0.1 | 1% |
| 4.1.8 | 11.8 | 11.8 | 0.0 | 0% |
| 4.1.9 | 11.2 | 11.6 | 0.4 | 3% |
| 4.1.10 | 6.3 | 6.7 | 0.3 | 5% |
The average ratings increased for most of the questions in this section. Questions 4 and 10 saw the largest increases (5 percent) for this section from 2010 to 2011. Question 5 decreased slightly, and one agency noted that their rating should improve prior to the next assessment. Each question except for question 10 had a national average rating of 7.0 or greater, indicating that, on average, agencies are implementing the practices covered in this section.
4.1.1 Has the agency developed a process to determine whether a project is impact type I, II, III, or IV? Fifty agencies (96 percent) have developed a process to determine the impact type of projects. After increasing by 6 percent from 2009 to 2010, the average rating on this question remained the same from 2010 to 2011. Several agencies cited use of a process to filter out significant projects without classifying all projects based on impact type I, II, III, or IV. A few agencies cited use of a project classification process, but do not specifically categorize projects as type I, II, III, and IV. Nearly all agencies noted attention to the significance of projects, with focus on mitigating the impacts. One agency noted that this process exists, but is not routinely applied and another agency noted that their process is new and has not yet been fully implemented.
4.1.2 Has the agency established strategic goals specifically to reduce congestion and delays in work zones? Almost three-fourths of agencies (73 percent) indicated that they have strategic goals to reduce work zone congestion and delays, with some agencies noting that they are currently in the process of developing strategic goals. Several agencies cited specific performance measures as they relate to mobility goals. Such performance measures include maximum additional travel time above normal, Level of Service relative to normal, and volume-to-capacity ratio during construction. One agency established a 10 minute maximum delay during construction, level of service no worse than LOS D, and a volume-to-capacity ratio no greater than 0.80. One agency cited a delay goal of no more than two levels of service below the baseline (pre-construction) conditions. Several agencies noted that they do not have specific numeric goals due to a lack of performance measures or that their goals are inherent through process, but not written.
4.1.3 Has the agency established strategic goals specifically to reduce crashes in work zones? Thirty-nine agencies (75 percent) have strategic goals specifically to reduce crashes in work zones. Nine agencies mentioned having work zones as an emphasis area in their Strategic Highway Safety Plan, with two agencies noting that they have already met their goal in reducing work zone crashes. Several agencies mentioned a strategic goal of reducing work zone fatalities, with a small number of States mentioning specific numeric goals such as zero work zone fatalities. Several other agencies noted that they are monitoring work zone crashes, but no specific goals have been set. Two agencies responded that the lack of a specific goal was due to issues related to data. Some agencies noted doing post-construction analysis, such as use of crash statistics and other analysis techniques. One agency noted that they try to anticipate upcoming crash patterns using similar projects and proactively address the anticipated crashes. For many agencies, goals for safety impacts appear more structured, with a clearer separation between goals and performance measures, than those listed in response to Question 4.1.2 for mobility goals.
4.1.4 Has the agency established measures (e.g., vehicle throughput or queue length) to track work zone congestion and delay? Thirty-three (63 percent) of the agencies are implementing measures to track work zone congestion and delay. The average rating for this item increased 5 percent (from 7.9 to 8.3) between 2010 and 2011. Six agencies said that they are using detection equipment to track and monitor work zone congestion and delay. One agency responded that they are conducting a pilot study in which they are contracting with commercial carriers to collect actual travel times. One agency has established a capacity value for a single lane in a work zone as a first step toward establishing performance measures for congestion and delay. Two agencies have established specific delay measures that include a maximum of 30 minutes delay per project (in addition to the three agencies that commented on their policy for maximum delay thresholds in question 4.1.2).
4.1.5 Has the agency established measures (e.g., crash rates) to track work zone crashes? Forty-three agencies (83 percent) have established measures to track work zone crashes. Most agencies cited work zone crashes as the primary performance measure established. One agency noted an emphasis on severe crashes, while another noted crash type as the primary performance measure. Four agencies noted that they have recently implemented improvements to work zone crash reporting. Two of these agencies have had or are in the process of having a crash database created and populated while another two agencies have recently implemented a new crash reporting form. These improvements to data collection and reporting will support analysis and may help agencies further define and establish performance measures.
4.1.6 Has the agency established a policy for the development of Transportation Management Plans to reduce work zone congestion and crashes? Fifty agencies (96 percent) are implementing a policy for the development of Transportation Management Plans (TMPs) to reduce work zone congestion and crashes. Most agencies cited a policy or guidance document that outlines the considerations for development of a TMP. The average rating of this question increased 2 percent (from 11.2 to 11.5) between 2010 and 2011. Since TMPs are required for all Federal-aid highway projects, 100 percent of agencies should be implementing TMPs.
4.1.7 Has the agency established work zone performance guidance that addresses maximum queue lengths, the number of open lanes, maximum traveler delay, etc.? Standards for work zone performance guidance have been established in 44 agencies (85 percent), consistent with the 2010 results. Two agencies responded that they are currently developing thresholds for work zone performance. Several agencies noted use of proactive policies for when to allow lane closures and other capacity restrictions based on time of day and anticipated demand, which are based on estimates of metrics such as queue lengths and delay. Another agency cited use of maximum queue lengths, maximum delay, and Level of Service as referenced in their lane closure analysis guidelines. Some agencies cited specific values for maximum delay (e.g. 10 minutes additional travel time caused by the work zone) and Level of Service (e.g. LOS D). Many agencies have allowable lane closure tools that are used at the project level.
4.1.8 Has the agency established criteria to support the use of project execution strategies (e.g., night work and full closure) to reduce public exposure to work zones and reduce the duration of work zones? Forty-eight agencies (92 percent) have established criteria to support the use of project execution strategies. While the average rating for this question did not change from 2010, one agency rating fell below the implementation phase and into the development phase with their rating decreasing from a 7 to a 6. Several agencies noted use of lane closure strategies or nighttime construction to reduce public exposure. One agency noted that traffic volumes are generally used to establish hours of construction and lane closures schedules. Multiple agencies responded that strategies used to reduce public exposure to work zones are used on a case-by-case basis, generally for more significant work zones or those in urban areas.
4.1.9 Has the agency developed policies to support the use of innovative contracting strategies to reduce contract performance periods? Fifty agencies (96 percent) have developed policies to support the use of innovative contracting strategies to reduce contract performance periods. The average rating on this question increased three percent from 11.2 to 11.6 due to increases in ratings from 13 agencies. Strategies used include A+B bidding, delayed start specifications, design-build, lane rental, and incentives/disincentives on major projects. One agency noted specifically using innovative contracting techniques to accelerate the delivery of bridge projects. An agency noted that it does not use some innovative contracting strategies such as A+B bidding and lane rental because of legislative limitations. Another agency noted that a new policy on A+B bidding is currently being developed.
4.1.10 Has the agency established formal agreements, such as Memoranda of Understanding (MOU), with utility suppliers to promote the proactive coordination of long-range transportation plans with long-range utility plans, with the goal of reducing project delays and minimizing the number of work zones on the highway? Only 26 agencies (50 percent) have established an MOU with utility suppliers to promote the proactive coordination of long-range transportation plans with long-range utility plans. This continues to be one of the lowest rated questions of the WZ SA and is tied with two other questions for the lowest number of agencies who have implemented the practice. However, this question had one of the larger increases in average rating (increasing 5 percent to 6.7, from 6.3 in 2010) due to increases in average ratings by 13 agencies. The wording of this question changed in 2011 to include a broader interpretation of agreements that qualify, rather than solely MOUs. This may help explain the large increase in average rating. Two agencies responded that they hold monthly meetings with utility suppliers to discuss utility issues and project schedules. Another agency includes utility construction coordination as a section within their TMP guidebook and provides training to regional office utility coordinators on use of their lane closure decision support tool. While many agencies do not have a formal MOU, several agencies have agreements and cooperative understandings in place with utility suppliers.
Project Planning and Programming
While transportation planning and implementation processes differ significantly from State to State, they all focus on developing increased capacity and efficiency in the transportation system. They do this by developing long-range transportation plans (LRTPs), transportation improvement program plans (TIPs), unified planning work programs (UPWPs), and in some cases congestion management system (CMS) plans.
Transportation management and operations (M&O) – including work zone management – is increasingly important to the planning professional. Metropolitan areas account for 83.5 percent of the Nation's population4 and 90 percent of its economic output.5 They are centers for social as well as economic activity and are the hubs of the national transportation system. To meet the challenge of continued mobility, the planning community needs to take an active role in the development and implementation of transportation system M&O strategies.
The complexity of our transportation systems and the impact of congestion on our Nation necessitate input from planners during project development in order to better assess and manage work zone impacts. The following are some example roles for planners:
- Using analytical traffic models to assess the system-wide impacts of specific project requirements;
- Evaluating programming estimates to ensure that the proper level of funding is included to mitigate traffic congestion and improve safety through work zones; and
- Providing the critical "bridge" of knowledge between the planning world and the design world to reduce the impacts of work zones on the traveling public.
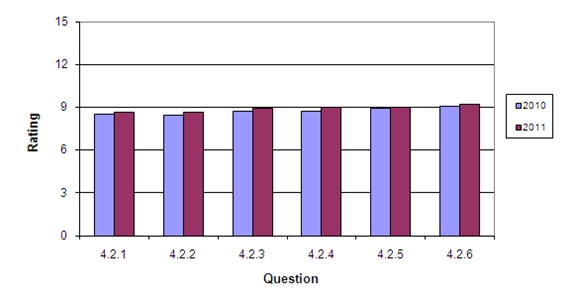
Figure 3 shows the average rating by question for 2010 and 2011 for the Project Planning and Programming section. Table 4 shows the numeric ratings along with the percent change in average rating from 2010 to 2011 for each question. The average ratings increased slightly for all of the questions in this section.
Figure 3. Results for Project Planning and
Programming Section
| Section | 2010 | 2011 | Change | Percent Change |
|---|---|---|---|---|
| 4.2.1 | 8.5 | 8.6 | 0.2 | 2% |
| 4.2.2 | 8.4 | 8.6 | 0.2 | 2% |
| 4.2.3 | 8.7 | 8.9 | 0.2 | 2% |
| 4.2.4 | 8.8 | 9.0 | 0.2 | 3% |
| 4.2.5 | 8.9 | 9.0 | 0.1 | 1% |
| 4.2.6 | 9.1 | 9.2 | 0.1 | 1% |
4.2.1 Does the agency's planning process actively use analytical traffic modeling programs to determine the impact of future type I and II road construction and maintenance activities on network performance? Nearly three-quarters (73 percent) of agencies actively use analytical traffic modeling programs to determine the impact of future type I and II project activities. The average rating for this question increased by 2 percent from 2010, and four agencies crossed the implementation threshold in 2011. Some agencies perform analysis at the corridor level to identify cumulative road user impacts from multiple projects, while others reported using modeling on the project level on a case-by-case basis. Agencies cited use of a fairly broad range of proprietary software applications, including QuickZone, VISSIM, TransCad, FreeVal, HCS, CO3, CORSIM, Paramics, and Quadro for modeling construction impacts and network performance. The tools cited range from macroscopic to microscopic and require varying levels of input detail; they can provide more or less detailed output data depending on the type of model used.
4.2.2 Does the agency's regular planning process analyze the network to develop adequate alternate options for routing traffic in anticipation of various needs for future road construction and maintenance? Thirty-seven agencies (71 percent) reported developing alternate network options for traffic volumes that could be delayed due to future road construction. One agency noted that in collaboration with a university, they developed a tool to visually represent traffic volumes and will begin using this tool to determine alternate network options that can be used during future lane closures from implementation of temporary traffic control plans. Another agency responded that these options are reviewed in conjunction with large planning studies. The same agency produces a congestion management plan that shows areas of potential impact by planned construction activities. One agency noted that alternative network options for traffic during construction are planned by consultants, and another noted that alternative network options for traffic during construction are planned informally. One agency noted that they lowered their score based on the rewording of this question in 2011.
4.2.3 Does the agency's planning process manage the transportation improvement program to eliminate network congestion caused by poorly prioritized and uncoordinated execution of projects? Thirty-nine agencies (75 percent), a decrease of one agency from 2010, indicated they make efforts during the planning process to manage the transportation improvement program to eliminate network congestion caused by poorly prioritized and uncoordinated execution of projects. One agency responded that their TMP Guidelines encourage coordination between projects. Another agency noted that they employ an Interstate Corridor Engineer to assist in coordinating Interstate projects. Other practices mentioned for facilitating coordination include: using internal applications and a public traveler information map, participating on committees to discuss upcoming construction activities, and conducting an online shared resources review of projects. An agency which is not facilitating coordination responded that programming occurs too far out for coordination to be considered.
4.2.4 Does the agency's transportation planning process include a planning cost estimate review for project types I, II, and III that accounts for traffic management costs (e.g., incident management, public information campaigns, positive separation elements, uniformed law enforcement, and intelligent transportation systems [ITS])? Forty agencies (77 percent) have a process for estimating traffic management costs during the transportation planning process. The average rating for this question increased by 3 percent from 2010, with three agencies crossing the implementation threshold in 2011. One agency noted that they are implementing a policy to require estimating traffic management costs during the transportation planning process. Another noted that a planning cost estimate review is detailed in their Design Guidelines. Several agencies stated that traffic management costs for these types of strategies are not included until the design phase, as more specific information is known about each project during design.
4.2.5 Does the agency's transportation planning process include the active involvement of planners during the project design stage to assist in the development of congestion mitigation strategies for type I and II projects? Planners assist in developing congestion mitigation strategies in 40 agencies (77 percent). Comments on this question reveal a range of involvement by planners during the project design stage. Levels of involvement include fully and actively involved, involved on significant projects, informally involved, invited but generally not involved, and not involved. One agency noted that this involvement occurs on secondary routes and safety projects only. Several of the agencies which responded that planners were not involved during the design stage acknowledged it would be beneficial.
4.2.6 Does the agency's transportation planning process engage planners as part of a multidisciplinary/multiagency team in the development of Transportation Management Plans involving major corridor improvements? For 41 agencies (79 percent), the transportation planning process engages planners as a part of a multidisciplinary team in the development of TMPs. The rating for this question increased slightly from 9.1 to 9.2 between 2010 and 2011. Many agencies indicated that planners are included as part of the team for overall project development, including TMP development and review. One agency said that city planners are now involved in TMP development while others responded that they use internal stake holders as well as MPO and TMA planners in the process. Another agency noted that their planners attend a revised Traffic Mobility Academy to expose them to the TMP process. One agency responded that their TMPs are reviewed by multi-disciplinary teams consisting of planners, designers, and other professionals.
Project Design
Project designers, working in concert with other functional experts, should consider work zone maintenance of traffic issues early in the design process. Designers should examine the use of different project execution strategies that can accelerate construction, thereby reducing construction time and minimizing the exposure of travelers to work zones. In addition, designers should actively lead the preparation of Transportation Management Plans (TMPs) that will mitigate the impact of work zone activities.
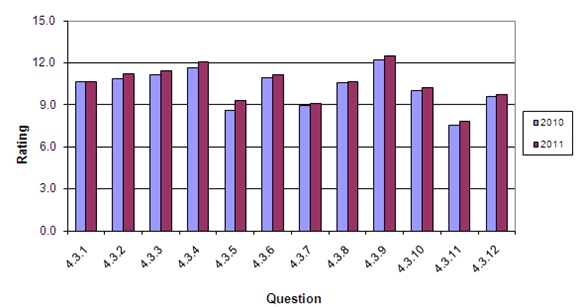
Figure 4 shows the average rating by question for 2010 and 2011 for the Project Design section. Table 5 shows the numeric ratings along with the percent change in average rating from 2010 to 2011 for each question. The average ratings increased for all but one of the questions in this section. Question 5 had the largest increase (8 percent) of all questions in the WZ SA. All the questions are at or beyond the implementation stage (rating of 7 or higher), meaning on average agencies are implementing the practices addressed in this section. Many agencies are now in the assessment phase (rating of 10-12).
Figure 4. Results for Project Design Section
| Section | 2010 | 2011 | Change | Percent Change |
|---|---|---|---|---|
| 4.3.1 | 10.7 | 10.7 | 0.0 | 0% |
| 4.3.2 | 10.9 | 11.2 | 0.3 | 3% |
| 4.3.3 | 11.1 | 11.4 | 0.3 | 3% |
| 4.3.4 | 11.6 | 12.1 | 0.4 | 4% |
| 4.3.5 | 8.6 | 9.3 | 0.7 | 8% |
| 4.3.6 | 10.9 | 11.2 | 0.2 | 2% |
| 4.3.7 | 9 | 9.1 | 0.1 | 1% |
| 4.3.8 | 10.6 | 10.7 | 0.1 | 1% |
| 4.3.9 | 12.2 | 12.5 | 0.3 | 2% |
| 4.3.10 | 10 | 10.2 | 0.2 | 2% |
| 4.3.11 | 7.6 | 7.8 | 0.3 | 4% |
| 4.3.12 | 9.6 | 7.9 | 0.2 | 2% |
4.3.1 Does the agency have a process to estimate road user costs and use them to evaluate and select project strategies (full closure, night work, traffic management alternatives, detours, etc.) for type I and II projects? Forty-four agencies (85 percent) have a process to estimate road user costs. The average rating for this question did not change from 2010. Multiple agencies noted the use of tools used to estimate road user costs. Other agencies noted that while they do not specifically use road user costs to evaluate and select strategies, they use a lane closure chart or strategy to minimize work zone exposure, resulting in reduced road user costs. One agency noted that a study had just been completed to give managers a tool to evaluate strategies based on road user costs, but the final report had not been released at the time of the WZ SA. A few of the agencies noted that this type of evaluation is conducted on an as-needed basis, generally on select significant or mega projects.
4.3.2 Does the agency develop a Transportation Management Plan that addresses all operational impacts focused on project congestion for type I and II projects? Fifty-one agencies (98 percent) develop a TMP that addresses all operational impacts with a focus on project congestion for type I and II projects. While all 52 responding agencies have not achieved the implementation level for this question, the average ratings for 19 agencies increased from 2010 to 2011 and the overall average rating for this question increased by 3 percent over the same time period. Ratings for two agencies reached the implementation threshold in 2011. The rating remained the same from 2010 for the one agency that has not reached the implementation threshold. That agency gave itself the below implementation rating because it could improve its analysis of operational impacts. Several agencies referenced TMP development for significant projects. One agency noted that they have added an event date in their project scheduling system to ensure that the TMP is reviewed in advance of the project.
4.3.3 Does the agency use multidisciplinary teams consisting of agency staff to develop Transportation Management Plans for type I & II projects? All 52 agencies have reported that they use multidisciplinary teams in 2011, with three agencies crossing the implementation threshold between 2010 and 2011. Agencies responded that these multidisciplinary teams consist of agency staff from many areas such as design, planning, maintenance, traffic operations, and construction. Additionally, some agencies reported that they included other stakeholders such as local agencies (e.g. MPOs or TMAs), emergency response teams, citizens, and elected officials. Some agencies cited a specific policy requiring these teams, and some noted that the scope of the team is dependent on the type and size of the construction project.
4.3.4 Does the agency perform constructability reviews that include project strategies to reduce congestion and traveler delays during construction and maintenance for type I and II projects? All 52 agencies responded that they use constructability reviews on projects. Eighteen agencies (35 percent) increased their ratings from 2010 and two agencies reached the implementation threshold. Many agencies noted that these constructability reviews are integrated into the project development process, with one agency noting that these reviews are conducted and tracked at designated milestones. One agency noted that they host biannual TMP Constructability workshops where they share case studies of best practices with multi-disciplinary stakeholders. Another agency noted that reviews take place between the design and construction phases for projects. Another agency said that constructability reviews are required on all projects and are performed in conjunction with the development of the project's TMP.
4.3.5 Does the agency use independent contractors or contractor associations to provide construction process input to expedite project contract time for type I and II projects? Forty-four agencies (85 percent) use contractor associations to provide construction process input, an increase of 8 percent over 2010. This question had the highest percentage increase in average rating from 2010, and three agencies crossed the implementation threshold in 2011. The comments do not provide a clear indication of why the scores increased over the past year. Many agencies noted that independent contractors or contractor associations are used to provide input on a case by case basis, with some agencies citing the need in more urban areas or bridge projects. A few agencies responded that this process is carefully used due to a potential conflict of interest.
4.3.6 Does the agency use scheduling techniques that are based on time and performance, such as the critical path method or parametric models, to determine contract performance times for type I and II projects? Forty-five agencies (87 percent) are using a technique to determine contract performance times for type I and II projects. While the overall average ratings for this question increased by 2 percent due to an increase in ratings by 11 agencies, one agency decreased to below the implementation threshold in 2011 from 2010. This agency did not provide any comments that help explain the decrease. Several agencies noted use of the critical path method (CPM), especially for type I and II projects. Some agencies noted the use of software such as Construction Analysis for Pavement Rehabilitation Strategies (CA4PRS) Software or agency-developed spreadsheet tools to assist with scheduling. Two agencies noted that they require contractors to supply schedule information for review and approval by the agency. No agencies referenced the use of parametric models specifically.
4.3.7 Does the agency have a process to evaluate the appropriate use of ITS technologies to minimize congestion in and around work zones for type I, II, and III projects? Forty-three agencies (83 percent) have a process to consider ITS technologies to minimize work zone congestion. Several agencies noted use of ITS, especially on significant projects. Agencies noted the use of speed trailers, variable message signs, and iCones. One agency noted that all ITS equipment is tied to their 511 traveler information system and this system is being upgraded in 2012. Another agency noted that their Office of Safety has recently hired several new employees with experience using ITS technologies and that ITS technologies may be further considered in the future. Several agencies noted that ITS technologies are included in TMP guidelines, checklists, or policies. One agency noted that ITS technologies are used informally and with proper documentation their rating could be increase on a future WZ SA.
4.3.8 Does the agency use life-cycle costing when selecting materials to reduce the frequency and duration of work zones for type I, II, and III projects? Life-cycle costing (LCC) is used by 44 agencies (85 percent) to reduce the frequency and duration of work zones. One agency reduced their rating below the implementation threshold in 2011 and commented that they do not have a policy in place, but are working on one. Several agencies responded that they use life cycle costing on pavement and bridge material selection, often citing that longer lasting material results in fewer future disruptions to traffic for maintenance. One agency noted that they have a formal process for selecting pavement materials on projects exceeding $1 million. One agency cited the use of a rapid set concrete for slab replacement to accelerate the construction process while another cited the development of alternate pavement specifications. A few agencies noted that life cycle costing is performed on a case-by-case basis while one agency noted that it is integrated into the project design process.
4.3.9 Does the agency have a process to assess projects for the use of positive separation devices for type I and II projects? Fifty agencies (96 percent) have a process to assess projects for the use of positive separation devices for type I and II projects. Two agencies increased their ratings above the implementation threshold from 2010, and the overall average rating for this question increased 2 percent from 12.2 to 12.5. Practices range from having multiple policies and guidelines encouraging the use of positive separation devices to an informal process to assess the need for positive separation devices. For example, one agency noted that although no written policy exists, the agency's position is to always consider the use of positive barrier systems on Interstates and during major construction projects on high-speed facilities. One agency responded that a study is underway to define criteria for use of positive protection and results will be used to assess current practice. Several agencies have decision tools for determining when to use portable concrete barriers.
4.3.10 Does the agency anticipate and design projects to mitigate future congestion impacts of repair and maintenance for type I, II, and III projects? Forty-nine agencies (94 percent) incorporate features into their project designs that accommodate the need for future repair and/or maintenance activities. Ratings for two agencies crossed the implementation threshold since 2010. Many agencies responded that wider shoulders or additional lanes are considered in the design process for use in enhancing capacity and reducing delay during future rehabilitation projects. Another agency noted that it installs longer lasting pavement markings to mitigate future congestion impacts from maintenance and repair.
4.3.11 When developing the Traffic Control Plan for a project, does the agency involve contractors on type I and II projects? Contractors are involved with the development of traffic control plans (TCPs) in 33 agencies (63 percent). This represents three additional agencies implementing this practice in 2011 compared with 2010. This question received the lowest rating in the Project Design section, but is tied for the second largest percentage increase (4%) from 2010 for this section. The average rating for this question increased from 7.6 to 7.8 due to an increase in ratings from 10 agencies. Many agencies noted that contractors are allowed to submit proposed revisions to the TCP following the award of the contract to prevent any conflicts of interest. Some agencies noted that contractors did provide input on a project-by-project basis, specifically if the project was complex or unique. One agency noted that contractors provide input on value engineering team reviews for projects exceeding $25 million, and another responded that contractors are permitted to submit a Value Engineering Change Proposal during construction to reduce the cost of a project.
4.3.12 When developing the Traffic Control Plan for a project, does the agency use computer modeling to assess Traffic Control Plan impacts on traffic flow characteristics such as speed, delay, and capacity for type I and II projects? Forty-five agencies (87 percent) implement computer modeling in the development of traffic control plans. Ratings for three agencies increased above the implementation threshold from 2010 to 2011, while one agency decreased their rating below the implementation threshold. This agency commented that they are currently working on using computer modeling to assess project impacts on traffic flow as part of an effort to improve the operational component of their TMPs. Agencies reported using software such as QuickZone, CORSIM, Synchro/SimTraffic, VISSIM, TREX, COSMIX, Quadro, CA4PRS, HCM, and CO3 for analyzing impacts. Additionally, two agencies noted that they have developed a spreadsheet to assist in analyzing impacts. One agency noted that they still use a demand versus capacity analysis to determine allowable hours for construction, but they have used modeling and will continue to develop modeling expertise. One agency noted they have provided training sessions for the use of modeling software.
Project Construction and Operation
A roadway construction or maintenance site can be a very complex orchestration of activities that affect the public in many ways. There are many pieces to the project delivery process and everyone has a critical role, but what the public mostly sees and experiences is the construction phase of the process. The use of letting strategies, quality-based contractor selection, time-sensitive bidding, efficient operations, traffic management, aggressive contract management, and good public information can help agencies improve the execution and public perception of transportation improvements.
Complaints from the traveling public often focus on the proper use and maintenance of traffic control devices, work zone lane closures when no work is occurring, and inadequate traveler information. Some common problems include signs that inform travelers of conditions that do not exist, striping that is misleading, changeable signs that show the wrong message, cones/drums that are improperly spaced, and lack of advance notice about lane closures, detours, or expected delays. These issues have an impact on agency credibility with the traveling public. Drivers develop work zone habits that are based on past observations. Agencies can require and provide incentives for work zone contractor personnel to be trained in the proper application and maintenance of traffic control devices in work zones and the implementation of other TMP strategies.
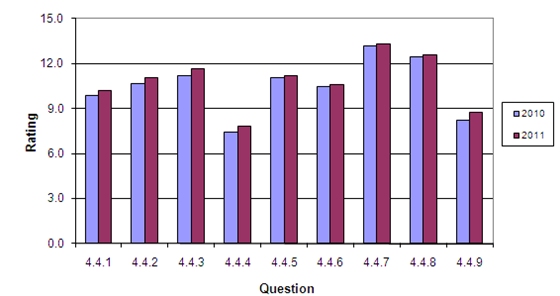
Figure 5 shows the average rating by question for 2010 and 2011 for the Project Construction and Operation section. Table 6 shows the numeric ratings along with the percent change in average rating from 2010 to 2011 for each question. Overall, this section had the second highest average rating (10.8) of the six sections. The average rating increased slightly for most of the questions in this section, with a couple of questions showing larger increases of 5% to 6%. All the questions are at or beyond the implementation stage (rating of 7 or higher), meaning on average agencies are implementing the practices addressed in this section.
Figure 5. Results for Project Construction
and Operation Section
| Section | 2010 | 2011 | Change | Percent Change |
|---|---|---|---|---|
| 4.4.1 | 9.9 | 10.2 | 0.3 | 3% |
| 4.4.2 | 10.7 | 11.0 | 0.4 | 4% |
| 4.4.3 | 11.2 | 11.6 | 0.4 | 4% |
| 4.4.4 | 7.4 | 7.9 | 0.4 | 5% |
| 4.4.5 | 11 | 11.2 | 0.2 | 2% |
| 4.4.6 | 10.5 | 10.6 | 0.1 | 1% |
| 4.4.7 | 13.2 | 13.3 | 0.2 | 1% |
| 4.4.8 | 12.4 | 12.6 | 0.2 | 2% |
| 4.4.9 | 8.3 | 8.8 | 0.5 | 6% |
4.4.1 Is the letting schedule altered or optimized to reflect the available resources and capabilities of the construction industry? Forty-three agencies (83 percent) alter or optimize their letting schedule based on contractor resources and capabilities. Ratings for two agencies increased above the implementation threshold in 2011, while the rating for one agency decreased below the implementation threshold. The agency did not provide any comments regarding the decrease. Several agencies noted that they spread out project advertisements so that a larger number of contractors have a chance to bid on jobs. One agency lets projects early in the year and provides a flexible notice to proceed to contractors. One agency noted that it uses a quarterly distribution of funds (20-30-30-20) to spread out its budget and construction industry contractor resources. One agency said it is developing a master schedule which would allow schedule optimization. One agency noted that its letting schedule is often driven by fiscal process constraints. Another agency said that it does review the letting schedule based on available construction industry resources, but that a more significant factor in its letting schedule is the time needed to complete the job since the agency tries to minimize the number of projects carried over winter.
4.4.2 Is the letting schedule altered or optimized to minimize disruptions to major traffic corridors? Fifty-one agencies (98 percent) are minimizing disruptions on major traffic corridors by optimizing the letting schedule. The average rating for this question increased four percent (from 10.7 to 11.0) due to increases in ratings from 13 agencies. Additionally, four agencies crossed the implementation threshold in 2011. Projects are reviewed to make sure that multiple projects do not adversely impact traffic along certain corridors. One agency noted that schedules are frequently optimized for major corridors. One agency noted flexibility in the start time if the same contractor is awarded two projects in close proximity to one another. The same agency said it may not issue a notice to proceed until the next season if a similar situation exists but involves two different contractors. One agency noted that its letting process has been adjusted in anticipation of traffic issues, and in some instances where the letting schedule cannot be adjusted, the construction schedule can. Another agency noted that its intent is to optimize the letting schedule, but funding can be an obstacle preventing the optimization.
4.4.3 When bidding type I and II projects, does the agency include road user costs in establishing incentives or disincentives (e.g., I/D, A+B, or lane rental) to minimize road user delay caused by work zones? Forty-eight agencies (92 percent) include road user costs in establishing incentives/disincentives (I/D) to minimize road user delay in work zones. The overall rating for this question increased four percent (from 11.2 to 11.6) due to the increase in ratings by 15 agencies. The rating for one agency decreased below the implementation level. This agency did not comment on the decrease. Some examples of the strategies used by agencies include A+B bidding, lane rental, and liquidated damages clauses. Agencies generally did not specify how RUC is determined. One agency responded that it has a draft directive in place which encourages the use of A+B bidding for all projects exceeding $1 million, regardless of RUC. Many other agencies noted that they have been using A+B bidding and lane rental for some time. One agency noted that A+B bidding is not permitted due to State law.
4.4.4 When bidding type I, II, and III projects, does the agency use performance-based criteria to eliminate contractors who consistently demonstrate their inability to complete a quality job within the contract time? Thirty-two agencies (62 percent) use performance-based selection to eliminate contractors that regularly have difficulty completing quality jobs on-time. The average rating on this question increased 5% from 7.4 to 7.8. This increase was due to an increase in ratings by 12 agencies, and is probably due at least in part to a change in the wording of the question to indicate it pertains to performance-based criteria, such as that used in prequalification, rather than performance-based selection. Many agencies noted the use of a prequalification process to reduce or eliminate the eligibility of contractors to bid on projects when contractors have demonstrated poor performance. One agency noted that they have establish contractor evaluation criteria and are beginning to collect data, while another notes that they evaluate the contractor at the end of each contract, but these evaluations do not disqualify the contractors from the bidding process regardless of performance.
4.4.5 When bidding type I and II project contracts, does the agency use incident management services (e.g., wreckers, push vehicles, and service patrols)? Incident management (IM) services such as wreckers, courtesy patrols, and off-duty highway patrol officers are used by 47 agencies (90 percent). Most agencies indicated that project-specific IM services are used on a case-by-case basis. Several agencies noted that IM services may already be available in the area of a project and that the need for additional services is assessed as part of the project development process. Several agencies referenced a linkage between service patrols and traffic management center technologies such as cameras that assist with incident verification and response. One agency noted that they found it was not cost effective to keep IM services on site, but they do keep such services on stand-by if needed. Two agencies noted that IM services are managed by local agencies (e.g. city or TMA).
4.4.6 When bidding contracts, does the agency use flexible starting provisions after the Notice to Proceed is issued? Forty-four agencies (85 percent) routinely use flexible starting provisions after the Notice to Proceed (NTP) is issued. One agency noted that this activity is generally done indirectly and due to weather, while another responded that it has permitted contractors to use flexible starting provisions due to a material shortage. Another agency noted that all projects have some flexibility between award and notice to proceed. The same agency said that the NTP is normally within 45 days of award; however, the NTP may be extended to after winter if a winter shutdown date occurs during or immediately after the 45 day window. This agency also noted that it may include a two-part NTP in a contract to allow for procurement of materials prior to actual construction. One agency routinely uses flexible starting provisions and uses past results to determine future projects on which to use them. Another agency noted that they do not use flexible starting provisions because their project schedule is based on the end date and not project duration.
4.4.7 During type I, II, and III projects, does the agency use uniformed law enforcement? Fifty-one agencies (98 percent) use uniformed law enforcement on projects. This question has the second highest rating of any question in the WZ SA, indicating that the use of law enforcement in work zones is a well-established and assessed practice in many agencies. Some agencies use law enforcement personnel on a project-by-project basis, but most agencies noted that the use of law enforcement is well-integrated into the agency project development process. A few agencies noted that they are evaluating the use of law enforcement in work zones to ensure effective use. One agency noted that several years ago law enforcement was present in 100% of the state's work zones and their duties included flagging (when needed), but now those duties are split and flagging is done by flaggers, resulting in a reduced need for law enforcement and reduced cost. Two agencies noted that they had established memorandum of understanding (MOU) with local law enforcement agencies.
4.4.8 Does the agency provide/require training of contractor staff on the proper layout and use of traffic control devices? Forty-nine agencies (94 percent) indicated that they provide and/or require training of contractor staff on proper use of traffic control devices. Some agencies hold training course on traffic control that they make open to contractor staff, while many of the respondents cited that contractor personnel are required to complete training specific to their role from an approved set of courses such as those offered by the American Traffic Safety Services Association (ATSSA) or the National Safety Council (NSC). One agency responded that training is not currently required, but there has been positive movement in the area. Another agency noted that classroom training is offered, but not required.
4.4.9 Does the agency provide training to uniformed law enforcement personnel on work zone devices and layouts or ensure law enforcement personnel receive proper training elsewhere? Thirty-eight (73 percent) of the responding agencies provide training to uniformed law enforcement or otherwise require it. Ratings for four agencies increased above the implementation threshold, and one agency's rating decreased below the implementation threshold. This agency noted that they do not directly provide nor ensure training for law enforcement, but such training is available. One agency responded that they are currently using FHWA's "Safe and Effective Use of Law Enforcement Personnel in Work Zones," while others mentioned the use of FHWA training material and train-the-trainer options. A few agencies have used the FHWA material to develop their own online course for law enforcement. One agency noted that they are currently developing law enforcement training materials. Another agency conducts incident responder workshops in 6 of its 7 regions and is hoping to expand the geographic presentation of these workshops in the future. Two agencies noted limited funding and availability of law enforcement officers make it difficult to ensure all staff members receive work zone training.
Communications and Education
To reduce public anxiety and frustration regarding work zones, it is important to sustain effective communications and outreach with the public about road construction and maintenance activity, and the potential impacts of the activities. This also increases the public's awareness of such activity. Lack of information is often cited as a key cause of frustration for the traveling public; therefore, the agency should identify and consider key issues from a public outreach and information perspective.
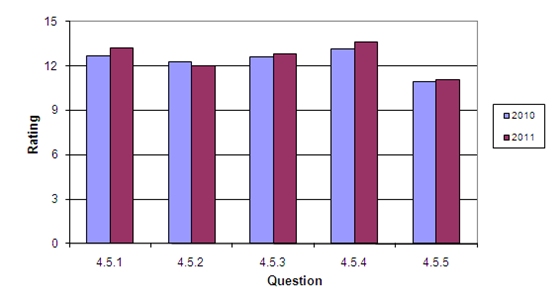
Figure 6 shows the average rating by question for 2010 and 2011 for the Communications and Education section. Table 7 shows the numeric ratings along with the percent change in average rating from 2010 to 2011 for each question. The average ratings increased for four out of the five questions in this section, while the question on Work Zone Awareness week activities experienced a slight decrease. The ratings in this section have consistently been among the highest in the WZ SA and remain so this year. Many agencies are now in the assessment phase (ratings of 10-12).
Figure 6. Results for Communications and Education
Section
| Section | 2010 | 2011 | Change | Percent Change |
|---|---|---|---|---|
| 4.5.1 | 12.7 | 13.2 | 0.5 | 4% |
| 4.5.2 | 12.3 | 12.0 | -0.3 | -2% |
| 4.5.3 | 12.6 | 12.8 | 0.3 | 2% |
| 4.5.4 | 13.2 | 13.6 | 0.5 | 4% |
| 4.5.5 | 10.9 | 11.1 | 0.2 | 1% |
4.5.1 Does the agency maintain and update a work zone Web site providing timely and relevant traveler impact information for type I, II, and III projects to allow travelers to make effective travel plans? Fifty-one agencies (98 percent) implement a Web site to provide traveler impact information on projects to allow travelers to make effective travel plans. The average rating of this question increased 4 percent (12.7 to 13.2) due to an increase in ratings from 16 agencies. One agency's rating increased above the implementation threshold. Several agencies have a Web site that provides information on various types of congestion whether due to work zones or other causes (e.g., a 511 traveler information site), and supplement that with project specific Web sites for large projects. Many agencies did not note the interval at which its sites are updated, but one noted that its site provides updates every minute. A number of agencies also provide interactive maps that specify the location of lane closures and restrictions. Two agencies mentioned using social media sites (e.g., Facebook, Twitter) to provide updates to the traveling public.
4.5.2 Does the agency sponsor National Work Zone Awareness week? Most agencies (88 percent) sponsor National Work Zone Awareness week. This question was one of only two questions in the WZ SA with a lower average rating in 2011 compared with 2010, with the average rating for this question decreasing 2 percent (12.3 to 12.0). One agency noted that full attention has not been given to these activities over the past two years, and another agency noted that activities had not seemed as effective as in previous years. Some agencies have no formal campaign but still support the program while others have planned activities throughout the week. One agency hosts an annual memorial during National Work Zone Awareness Week in honor of workers who have died in the line of duty. This same agency reported over 1,000 people in attendance at the previous year's annual memorial. Two agencies responded that they do not sponsor the National Work Zone Awareness week because it falls prior to the start of their construction season. One of these two agencies noted that they sponsor events starting in May that coincide with the start of their construction season.
4.5.3 Does the agency assume a proactive role in work zone educational efforts? Forty-nine agencies (94 percent) are developing educational materials to inform the public on work zone safety. One agency decreased their rating below the implementation threshold from 2010 to 2011 and only commented that educational campaigns are implemented at the district level. Most agencies that provided comments cited the use of educational efforts such as public service announcements, press releases, brochures, and other marketing strategies. Two agencies noted conducting work zone educational efforts targeted at younger drivers through driver education programs and a kid's calendar project. One agency noted a reduction in the amount of time spent on this task due to limited staffing.
4.5.4 During type I, II, and III project construction, does the agency use a public information plan that provides specific and timely project information to the traveling public through a variety of outreach techniques (e.g., agency Web site, newsletters, public meetings, radio, and other media outlets)? This practice is implemented by all 52 agencies. Similarly to 2010, this question has the highest rating of all questions in the WZ SA, with many agencies commenting that it is a normal part of project delivery. The most frequently mentioned public information techniques used by agencies are publishing information on the agency's Web site and providing information to media outlets. Other techniques mentioned by agencies include highway advisory radio messages, press releases, radio, TV, newspaper ads, telephone hotlines, ITS technology, 511, RSS feeds, newsletters, and outreach to businesses. One agency noted the development of a mobile phone application to assist in advertising work zone project information.
4.5.5 During type I, II, and III projects, does the agency use ITS technologies to collect and disseminate information to motorists and agency personnel on work zone conditions? Forty-seven agencies (90 percent) use ITS technologies to collect and disseminate work zone information. Fourteen agencies reported an increased rating, while the average rating for this question increased one percent (10.9 to 11.1). One agency's rating increased above the implementation threshold, while two agencies decreased below the implementation threshold. Agencies noted use of portable and permanent changeable message signs to give the traveling public specific and timely project information, as well as the use of iCones, portable cameras, highway advisory radio, and speed display trailers. One agency submitted a comment citing use of Bluetooth technology for information dissemination. Two agencies noted collaboration with transportation management centers to provide this information. One agency noted that in areas without ITS technologies, they work with the state police for incident verification and response.
Program Evaluation
Evaluation is necessary to identify successes and analyze failures. Work zone performance monitoring and reporting at a nationwide level can increase the knowledge base on work zones and help lead to the development of better tools to help agencies better plan, design, and implement road construction and maintenance projects. At the local level, performance monitoring and reporting provides an agency with valuable information on the effectiveness of congestion mitigation strategies, contractor performance, and work zone safety.
Figure 7 shows the average rating by question for 2010 and 2011 for the Program Evaluation section.
Figure 7. Results for Program Evaluation Section
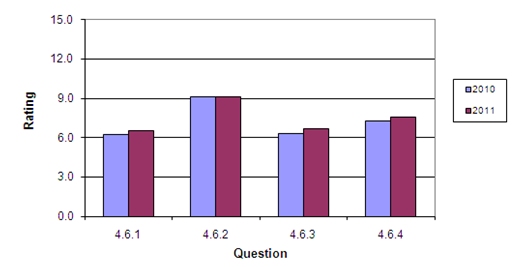
Table 8 shows the numeric ratings along with the percent change in average rating from 2010 to 2011 for each question. The average ratings increased for most of the questions in this section, with Question 2 remaining unchanged. This section remains the lowest rated in the WZ SA.
| Section | 2010 | 2011 | Change | Percent Change |
|---|---|---|---|---|
| 4.6.1 | 6.3 | 6.6 | 0.3 | 5% |
| 4.6.2 | 9.1 | 9.2 | 0.0 | 0% |
| 4.6.3 | 6.3 | 6.7 | 0.3 | 5% |
| 4.6.4 | 7.3 | 7.6 | 0.3 | 5% |
4.6.1 Does the agency collect data to track work zone congestion and delay performance in accordance with agency-established measures? (See section 4.1.4.) Half of the responding agencies collect data to track work zone congestion and delay performance against agency measures. The average rating for this question remains below the implementation threshold; however it increased by five percent, indicating that more agencies are moving toward using data to track work zone congestion and delay. Ratings for four agencies increased above the implementation threshold, while ratings for two agencies decreased below the implementation threshold. One of the agencies that lowered their rating noted that while they collect data, there are no established measures. The second agency did not provide a comment. Variation exists in agency practice, ranging from agencies that have not yet defined measures, to agencies collecting data mainly through visual observation, to field engineers reporting performance on agency data collection forms or using travel time runs, to the use of technology to collect data. One agency purchased a data report software package which will be able to track total delay in hours for work zones using ITS devices. This agency will begin tracking delay to obtain a baseline for construction and then monitor the delay against the baseline for observations of trends. Some agencies noted that they focus their data collection on a sample of projects, generally significant projects. One agency noted use of more qualitative measures such as public input and feedback as opposed to quantitative measures. One agency noted that they have district offices conducting data collection tasks to monitor delay, but it is not yet done on an agency-wide level.
4.6.2 Does the agency collect data to track work zone safety performance in accordance with agency-established measures? (See section 4.1.5.) Thirty-eight agencies (73 percent) are collecting data to track work zone safety performance, representing a decrease in rating below the implementation threshold for three agencies and an increase in rating above the implementation threshold for two agencies. Two agencies whose ratings decreased below the implementation threshold noted that they collect data, but do not have any established measures. This question prompted a range of responses. An agency noted that they track work zone fatalities but stated that they are often unable to determine whether the crash was caused by the work zone. Another agency noted that work zone crashes, injuries, and fatalities are tracked on a yearly basis by district and roadway type and used for the development of district and statewide changes to their work zone safety policy and Strategic Highway Safety Plan. Several agencies noted that training is or will be conducted with law enforcement officers to provide a better understanding on work zones and a better understanding on the need to properly track work zone crashes.
4.6.3 Does the agency conduct customer surveys to evaluate work zone traffic management practices and policies on a statewide/area-wide basis? Twenty-six agencies (50 percent) are using customer surveys to evaluate work zone performance. Ratings for two agencies increased above the implementation threshold from 2010 to 2011, and the average rating for this question increased 5 percent, indicating that more agencies are making use of surveys and similar mechanisms for public feedback. Customer surveys provide qualitative information for agencies to use in evaluating their work zone operations. Agencies that mentioned doing surveys indicated they were often specific to a project or an outreach campaign, or were part of a larger State or agency survey effort. Several agencies noted use of electronic resources such as Web sites to gather public input on programs and projects. One agency noted that it is receiving more input from the public due to the increased usage of social media. Another agency responded that informal 'coffee house' meetings are held for the public to provide feedback on work zones during construction.
4.6.4 Does the agency develop strategies to improve work zone performance on the basis of work zone performance data and customer surveys? Thirty-one agencies (60 percent) develop strategies to improve work zone performance based on work zone data and customer surveys. The average ratings for four agencies increased above the implementation threshold, while one agency rating decreased below the threshold. The agency whose rating decreased below the implementation threshold did not provide comments. Agencies cited using information from public and worker feedback mechanisms to make policy and practice improvements and target marketing campaigns. One agency mentioned development of several specific strategies, including Web sites for contractor safety information, measures to define work zone limits to classify how queues are studied and establish best practices on queue analysis, and on-site efforts such as portable speed monitoring for data collection. One agency responded that they have multiple work zone teams that help assess and develop strategies for work zone performance improvement. Another agency noted that more attention has been given to user delay to confirm that project delays were not exceeded relative to the TMP.
4 U.S. Census Bureau, Current Population Reports, "Population Change in Metropolitan and Micropolitan Statistical Areas: 1990-2003," P25-1134, by Paul J. Mackun, (Washington, DC: September 2005) [ Return to note 4. ]
5 U.S. Bureau of Economic Analysis , "Metropolitan Economic Growth Widespread in 2006 - 2006 and Revised 2004-2005 GDP-by-Metropolitan-Area Statistics," News Release BEA 08-44, Regional Economic Accounts web page, December 13, 2011. (http://www.bea.gov/newsreleases/regional/gdp_metro/2008/gdp_metro0908.htm) [ Return to note 5. ]