| |
The error correction step is essential in developing a working model so that the calibration process does not result in parameters that are distorted to compensate for overlooked coding errors. The succeeding steps of the calibration process rely on the elimination of all major errors in demand and network coding before calibration.
Error checking involves various reviews of the coded network, coded demands, and default parameters. Error checking proceeds in three basic stages: (1) software error checking, (2) input coding error checking, and (3) animation review to spot less obvious input errors.
The analyst should review the software and user group Web sites to ensure that he or she is aware of the latest known "bugs" and user workarounds for the software. The analyst should ensure that he or she is using the latest version and "patch" of the software.
A checklist for verifying the accuracy of the coded input data is provided below:
The following techniques may be useful to increase the efficiency and effectiveness of the error-checking process:28
Animation output enables the analyst to see the vehicle behavior that is being modeled and assess the reasonableness of the microsimulation model itself. Running the simulation model and reviewing the animation, even with artificial demands, can be useful to identify input coding errors. The analyst inputs a very low level of demand and then follows individual vehicles through the network. Aberrant vehicle behavior (such as unexpected braking or stops) is a quick indicator of possible coding errors.
A two-stage process can be followed in reviewing the animation output:
The animation should be observed in close detail at key congestion points to determine if the animated vehicle behavior is realistic. If the observed vehicle behavior appears to be unrealistic, the analyst should explore the following potential causes of the unrealistic animation in the order shown below:
Error in Analyst Expectations: The analyst should first verify in the field the correct vehicle behavior for the location and time period being simulated before deciding that the animation is showing unrealistic vehicle behavior. Many times, analyst expectations of realistic vehicle behavior are not matched by actual behavior in the field.29 Field inspection may also reveal the causes of vehicle behavior that are not apparent when coding the network from plans and aerial photographs. These causes need to be coded into the model if the model is expected to produce realistic behavior.30
Analyst Data Coding Errors: The analyst should check for data coding errors that may be causing the simulation model to represent travel behavior incorrectly. Subtle data coding errors are the most frequent cause of unrealistic vehicle behavior in commercial microsimulation models that have already been subjected to extensive validation. Subtle coding errors include apparently correctly coded input that is incorrect because of how it is used in the model to determine vehicle behavior.31
A comparison of model animation to field design and operations cannot be overemphasized. Some of the things to look for include:
If the analyst has field-verified his or her expectations of traffic performance and has exhausted all possible input errors, and the simulation still does not perform to the analyst's satisfaction, there are still a few possibilities. The desired performance may be beyond the capabilities of the software, or there may be a software error.
Software limitations can be identified through careful review of the software documentation. If software limitations are a problem, then the analyst will have to work around the limitations by "tricking" or "forcing" the model to produce the desired performance.32 If the limits are too great, the analyst might seek an alternate software program without the limitations. Advanced analysts can also write their own software interface with the microsimulation software (called an "application program interface" (API)) to overcome the limitations and produce the desired performance.
Software errors can be tested by coding simple test problems (such as a single link or intersection) where the result (such as capacity or mean speed) can be computed manually and compared to the model. Software errors can only be resolved by working with the software developer.
The completion of error checking is a key decision point. The next task -- model calibration -- can be very time-consuming. Before embarking upon this task, the analyst should confirm that error checking has been completed, specifically:
Once the error checking has been completed, the analyst has a working model (though it is still not calibrated).
Continuing with the same example problem from the previous chapters, the task is now to error check the coded base model.
Software: The latest version of the software was used. Review of the model documentation and other material in the software and user groups' Web sites indicated that that there were no known problems or bugs related to the network under study and the scenarios to be simulated.
Review of Input Data and Parameters: The coded input data were verified using the input files, the input data portion of the output files, static displays, and animation.
First, the basic network connectivity was checked, including its consistency with coded geometry and turning restrictions. All identified errors were corrected. For example, one link with exclusive left- and right-turn lanes (no through traffic) was coded as feeding a downstream through link.
Static network displays were used extensively to verify the number of lanes, lane use, lane alignment (i.e., lane number that feeds the downstream through link), and the location of lane drops. At this step, the consistency of link attributes was checked. For example, is the free-flow speed of 87 km/h (55 mi/h) coded for all freeway links?
Next, the traffic demand data were checked. Input volumes at the network entrances were specified in four time slices. The input values were checked against the collected data.
Special attention was given to the traffic patterns at the interchange ramp terminals to avoid unrealistic movement. The software provisions (and options) were exercised to force the model not to assign movements to travel paths that were not feasible.33
The vehicle characteristics and performance data were reviewed.
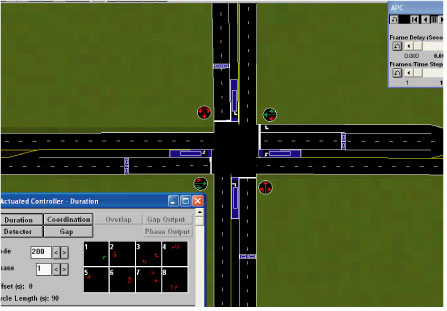
The model displays and animation were used to verify the input data and operation of the traffic signals coded at each intersection. For fixed-time signals, the phasing and signal settings were checked (see Figure 6). For actuated signals, initial simulations were performed with reduced, but balanced, volumes to ensure that all phases were activated by the traffic demand. This was done because often the inappropriate settings of the phase flags cause signals to malfunction within the simulation and produce unreasonable results. This step also involves checking the location of the detectors and their association with the signal phases.
Review Animation: Following the checking of the input data, the model was run using very low demand volumes to verify that all of the vehicles travel the network without slowdowns. This step uncovered minor errors in the links alignments that needed to be adjusted.
Next, the traffic demands were specified to about 50 percent of the actual volumes and the simulation model was rerun. Animation was used to verify that all demands were properly loaded in the network links and the traffic signals were properly operating. The link and system performance measures (travel time, delay) were also checked for reasonableness (i.e., they should reflect free-flow conditions).
Careful checking of the animation revealed subtle coding problems. For example, the coded distance of a warning sign (for exiting vehicles) or the distance from the start of the link to the lane drop affects the proper simulation of driver behavior. These problems were corrected.
Key Decision Point: The model, as revised throughout the error-checking process, was run with all the input data (actual demands) and the default model parameters. The output and animation were also reviewed and discussed with other agency staff who were familiar with the study area. The conclusion is that the model is working properly.
Table of Contents | List of Tables | List of Figures | Top of Section | Previous Section | Next Section | HOME