
Managing Travel for Planned Special Events
Chapter Two. Characteristics and Categories of Planned Special Events
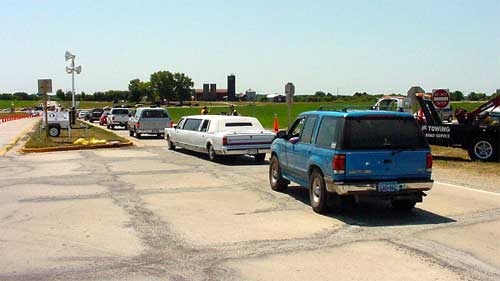
Figure 2-1. Event Traffic Management (Photo courtesy of the Wisconsin DOT.)
Purpose 
This chapter presents planned special event operations characteristics and associated factors defining the scope of event impact on transportation system operations. It describes planned special event classification in terms of event categories and event impact level. This chapter also introduces the stakeholder groups organized under the various phases of managing travel for planned special events.
Planned Special Event Classification
Characteristics
A planned special event impacts the transportation system by generating an increase in travel demand in addition to possibly causing a reduction in roadway capacity because of event staging. The first step toward achieving an accurate prediction of event-generated travel demand and potential transportation system capacity constraints involves gaining an understanding of the event characteristics and how these characteristics affect transportation operations. In turn, practitioners can classify the planned special event in order to draw comparisons between the subject event and similar historical events to shape travel forecasts and gauge transportation impacts.
Figure 2-2 shows typical operational characteristics of a planned special event. Each characteristic represents a variable that greatly influences the scope of event operation and its potential impact on the transportation system. These variables include:
- Event time of occurrence defines the time of day(s)
the event is open for business, a key variable when comparing
event-generated traffic to background traffic.
- For example, weekday events may face constraints on roadway, transit, and parking capacity because of commuter travel.
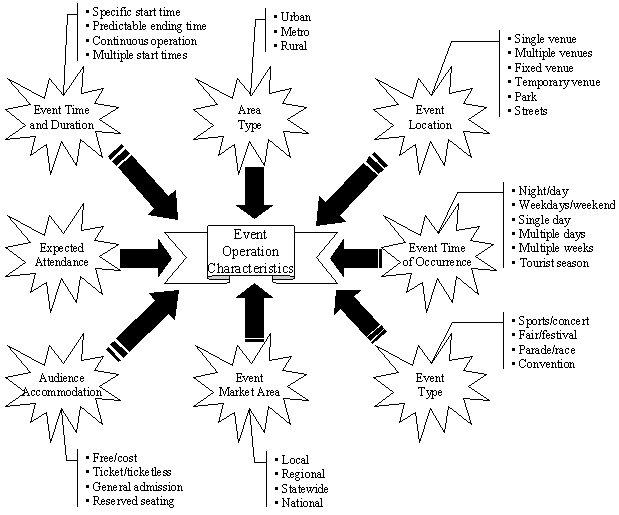
Figure 2-2. Event Operation Characteristics D
- Event time and duration defines whether the event features a specific main event start time, likely to condense event patron arrival, or operates continuously throughout the day where patrons may freely come and go.
- Event location defines the characteristics of the
venue(s) location and connection to the existing transportation infrastructure.
- Typically, fixed venues, such as stadiums or arenas, feature high-capacity parking areas adjacent to the venue and good access to/from adjacent freeways and principal arterial streets.
- Temporary venues may lack these features, thus requiring the development of a detailed site access and parking plan.
- Area type defines the scope of available transportation services, the characteristics of background traffic traversing the area, and the various stakeholders that may become involved in event planning and management. These characteristics influence the event operations planning process and day-of-event travel management, yet significantly vary across rural, urban, and metropolitan areas.
- Event market area defines the area from where event
patrons originate and the scope of event exposure.
- For example, the Summerfest music festival in downtown Milwaukee drew over one million in attendance over eleven days in 2002. Demographic surveys indicated 56 percent of Summerfest patrons lived in the four counties comprising the greater metropolitan Milwaukee area, 22 percent of patrons lived in other areas of Wisconsin, and 22 percent of patrons lived outside Wisconsin.(1) The event clearly had a regional/statewide market area.
- Political conventions or major industry exhibitions feature a national scope where the majority of attendees do not reside in the host city.
- Expected attendance defines the maximum, estimated
number of event patrons.
- Attendance estimates may include the anticipated number of VIPs, advance ticket holders, patrons with an assigned parking pass, and patrons requiring special assistance.
- With regard to sporting events, key components in estimating attendance involve home team performance and visiting team attraction.
- Games involving high-profile visiting teams or performers may sell-out far in advance of the event, allowing stakeholders sufficient notice to take appropriate measures.
- Attendance impacts traffic operations in the immediate vicinity of the event venue depending on the access and parking capacity furnished at the venue.
- Audience accommodation defines the potential to predict
the number and origins of event-generated trips in addition to the type
of trip patrons may make to the venue.
- Attendance at free events is hard to predict and may vary considerably based on weather conditions and other factors on the day-of-event.
- Events featuring advance ticket sales and reserved seating may decrease the number of event patrons making a spur-of-the-moment decision to attend an event.
- Event type defines the type of event that may be subject to special regulations and permit requirements. The event type includes many of the previously defined characteristics of planned special events that influence event-generated travel demand and level of impact on the transportation system. Event planners may refer to event type when researching impacts on travel caused by similar events.
Categories
The event operation characteristics described in the previous section create five categories of planned special events, listed in Table 2-1.
| Special Event Category |
|---|
|
Table 2-2 contrasts some general characteristics specific to each defined event category. Figure 2-3 illustrates events representing four event categories. The fifth category, regional/multi-venue event, includes any combination of the first three event categories listed in Table 2-1.
This technical reference makes exclusive reference to the defined categories of planned special events when referencing or profiling particular event types. In recognizing the unique characteristics of each category of planned special event regarding trip generation and event impact on transportation system operations, many jurisdictions across the country have developed distinct planning processes, policies, and regulations specific to particular event categories. The balance of this section describes each of the five defined event categories.
Discrete/Recurring Event at a Permanent Venue
A discrete/recurring event at a permanent venue occurs on a regular basis, and it has a specific starting time and predictable ending time. Events classified under this category have predictable peak arrival and departure rates relative to other categories of planned special events. These events generate high peak travel demand rates because of patron urgency to arrive at the venue by a specific event start time. Moreover, these events end abruptly upon game time expiration or the conclusion of a final song, which creates high peak departure rates.
Stadiums and arenas occasionally host weeknight events that may conflict with commuter traffic, especially if media broadcasting the event mandates a specific start time. For instance, a Monday Night Football game held in San Diego, San Francisco, Oakland, or Seattle usually begins at 6:00 p.m. Pacific time to satisfy television broadcast requirements.
Continuous Event
A continuous event occurs over a single or multiple days. Unlike a discrete/recurring event at a permanent venue, continuous events do not exhibit sharp peak arrival and peak departure rates. Event patrons typically arrive and depart throughout the event day.
Aside from conventions and state/county fairs, many continuous events take place at a temporary venue, a park, or other large open space. As a result, roadway and parking capacity issues may arise in the immediate area surrounding a temporary venue. Temporary venues may not have a defined spectator capacity, thus creating uncertainties in forecasting event-generated trips since a "sell-out" cap does not exist.
| Characteristic | Planned Special Event Category |
|---|---|
| Event Location |
|
| Event Time of Occurrence |
|
| Event Time and Duration |
|
| Area Type |
|
| Event Market Area |
|
| Expected Audience |
|
| Audience Accommodation |
|
| Event Type |
|
| Characteristic | Planned Special Event Category |
|---|---|
| Event Location |
|
| Event Time of Occurrence |
|
| Event Time and Duration |
|
| Area Type |
|
| Event Market Area |
|
| Expected Audience |
|
| Audience Accommodation |
|
| Event Type |
|
| Characteristic | Planned Special Event Category |
|---|---|
| Event Location |
|
| Event Time of Occurrence |
|
| Event Time and Duration |
|
| Area Type |
|
| Event Market Area |
|
| Expected Audience |
|
| Audience Accommodation |
|
| Event Type |
|
| Characteristic | Planned Special Event Category |
|---|---|
| Event Location |
|
| Event Time of Occurrence |
|
| Event Time and Duration |
|
| Area Type |
|
| Event Market Area |
|
| Expected Audience |
|
| Audience Accommodation |
|
| Event Type |
|
| Characteristic | Planned Special Event Category |
|---|---|
| Event Location |
|
| Event Time of Occurrence |
|
| Event Time and Duration |
|
| Area Type |
|
| Event Market Area |
|
| Expected Audience |
|
| Audience Accommodation |
|
| Event Type |
|

Figure 2-3. Examples of Planned Special Events
Street Use Event
A street use event occurs on a street requiring temporary closure. These events generally occur in a city or town central business district; however, race events or motorcycle rallies may necessitate temporary closure of arterial streets or limited-access highways.
A street use event significantly impacts businesses and neighborhoods adjacent to the event site from the perspective of parking and access. A street use event closes a segment(s) of the roadway network and causes background and event traffic to divert onto alternate routes, thus increasing traffic demand on other streets in the roadway network.
Filming activities may require the closure of major roadways for an extended
duration, but stakeholders can work with production companies on day-of-the-week
scheduling.
Regional/Multi-Venue Event
A regional/multi-venue event refers to multiple planned special events that occur within a region at or near the same time. The collection of events may have different starting times and differ in classification category. For instance:
- On August 31, 2002, downtown Denver hosted the Grand Prix of Denver (attendance 20,000), the Taste of Colorado festival (attendance 150,000), and a college football game (attendance 76,000).(2) Grand Prix races and the Taste of Colorado also occurred simultaneously on two other days of Labor Day weekend 2002.
- Major fireworks displays warrant consideration under this event category since large crowds may spread out over a large area depending on the number of good vantage points available.
- The lack of overflow parking and roadway congestion represents some of the key concerns when planning for multiple events occurring within a small area.
A number of major metropolitan areas have two or more adjacent fixed venues or venues utilizing the same freeway corridor. Multiple venues may occasionally host events on the same day.
- Figure 2-4 illustrates an example of a regional/multi-venue event that occurred in Anaheim, CA. The Anaheim Angels baseball team hosted a playoff game at Edison Field, and the Mighty Ducks of Anaheim hockey team played against a high-attendance drawing team from Detroit at the Arrowhead Pond, located on the opposite side of State Route 57 and Katella Avenue from Edison Field. Both events sold-out, but the baseball game had been scheduled only days before its occurrence due to the baseball playoff system. Broadcast media likely required the game start time of 1:05 p.m. As a result, high departure rates from Edison Field and high arrival rates to Arrowhead Pond occurred at approximately the same time.
- Although special circumstances surrounded the above example event, stakeholders managing all planned special events within a region emphasize coordination of event times to reduce peak parking demand and impact on transportation system operations.
Rural Event
Rural events encompass any discrete/recurring event or continuous event occurring in a rural area. Planned special events occurring in rural areas deserve a stand-alone classification category for several reasons:
- Need for stakeholders to assume new and/or expanded roles.
- Existence of limited road capacity to access the event venue and potentially limited parking capacity at the venue.
- Existence of fewer alternate routes to accommodate event and background traffic.
- Lack of regular transit service and hotels near the venue.
- Existence of limited or no permanent infrastructure for monitoring and managing traffic.
Impact Level
Stakeholders responsible for planning and managing travel for planned special events must gauge the potential severity of a planned special event. Agencies must determine with certainty if a planned special event will affect or impede the normal flow of traffic and if yes, how much impact will the event have. Answers to these questions determine the scope of the transportation management plan required to mitigate event-generated impacts on travel in addition to the number of stakeholders that become involved in advance planning and day-of-event travel management activities.
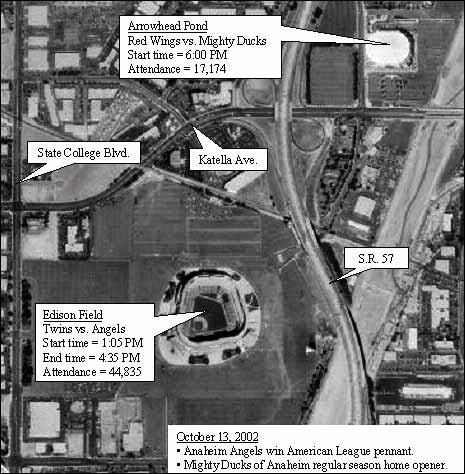
Figure 2-4. Example Regional/Multi-Venue Event D
Example Incident Management Protocol
The stakeholders and resources involved in traffic incident management and managing travel for planned special events overlap. The following examples of classifying a planned special event under a traffic incident severity level illustrate how traffic incident responders determine the resources and level of effort required to manage traffic during a planned special event:
- A new chapter included in the proposed amendments to the 2000 Manual
on Uniform Traffic Control Devices (MUTCD), entitled "Control of
Traffic Through Traffic Incident Management Areas," defines an
incident as follows:(3)
A traffic incident is an emergency road user occurrence, a natural disaster, or a special event that affects or impedes the normal flow of traffic.
The proposed MUTCD amendment classifies traffic incident severity by duration of incident. Incident classification levels include:
- Major – expected duration of more than 2 hours;
- Intermediate – expected duration of 30 minutes to 2 hours; and
- Minor – expected duration under 30 minutes.
Planned special events having a duration of two hours fall within the classification of "major incident."
- The Colorado Department of Transportation (DOT) – Region 6 maintains the following criteria for classifying a planned special event as a Level III Modified Incident, the highest Region 6 traffic incident severity level: special or planned events that have major impacts.(4)
Planned Special Event Severity
It is important to recognize that the impact of a planned special event on traffic and transit operations depends on a combination of several dynamic factors. Collectively, planned special event impact factors differ from those considered in determining the severity of other types of planned and unplanned events.
As illustrated in Figure 2-5, the three core factors include travel demand, road/site capacity, and event operation. Available resources and external factors represent secondary aspects that also affect the impact a planned special event has on transportation system operations. Key considerations include:
- Travel demand refers to the expected number of event patrons and their arrival and departure rates. Modal split has a significant influence on the level of event impact, particularly on traffic operations. Event patrons may travel to the event via personal vehicle, transit, walking, or a combination of modes. A planned special event travel forecast involves estimating travel demand magnitude, travel demand rate, and modal split.
- Road/site capacity concerns the available venue access and parking background capacity in addition to the capacity of roadways and transit serving the event venue. Capacity must take into account: (1) background parking occupancy in parking areas serving the event venue and (2) volume of background traffic that normally traverses the road system serving the event venue. Capacity influences travel demand to a limited extent, as "seasoned" event patrons in some locales may choose to use transit to access an event venue, because of severe traffic congestion experienced in the past, although they may not represent regular transit users.
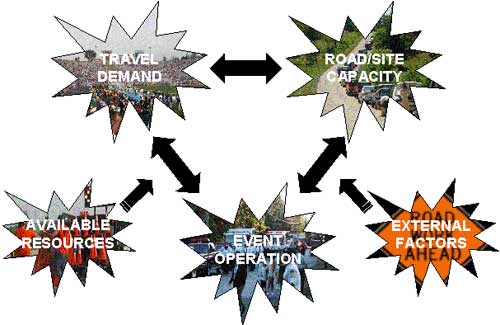
Figure 2-5. Planned Special Event Impact Factors
- Event operation essentially defines the scope of
travel demand, including market area, and may reduce available background
capacity because of event staging requirements. Event operations impact
the effect a planned special event has on travel. For instance:
- A venue may open earlier to better spread the rate of arrivals for a concert or sporting game.
- Event patrons may be given special advance instruction on specific parking options.
- An event organizer may relocate an event to a different venue when roadway capacity deficiencies can not be adequately mitigated.
- On the other extreme, corporate hospitality tents at the 2003 Super Bowl in San Diego reduced the amount of available on-site parking from 19,600 spaces to 3,400 spaces.(5)
- Available resources refer to the quantity of personnel and equipment available to plan for and conduct day-of-event travel management operations. The occurrence of regional/multi-venue events or other unplanned events may strain available stakeholder resources needed to manage a particular planned special event.
- External factors include concurrent roadway construction
activities on roadway corridors serving a venue and prevailing weather
conditions on the day-of-event. Weather conditions have a significant
impact on attendance (e.g., travel demand) or the rate of arrivals and
departures at some events. For example:
- Event patrons will attend an open-air sporting event in extremely hot weather, but patrons may bypass arriving at the venue early to tailgate, thus concentrating patron arrivals.
- Rain events may flood unpaved parking lots and venue access roads, rendering them impassable and reducing available road/site capacity. Rain events may also cause sharp arrival and departure rates in addition to safety problems.
When determining the level of impact each of the five stated planned special event factors has on travel, consider each of the following components:
- Duration – temporal impact.
- Extent – spatial impact or scope of area affected.
- Intensity – volume of impact.
Planned Special Event Impact Classification
Jurisdictions have established defined planned special event impact classification levels for the purpose of determining: (1) event permit requirements, (2) transportation management plan deployment, and (3) scope of potential impact on the transportation system.
The balance of this section summarizes various frameworks, based on a range of event impact factors and thresholds, applied to estimate the severity level of a particular planned special event for advance planning purposes.
Event Permit Requirements
A number of communities with planned special event permit guidelines have also developed criteria to categorize various sizes of planned special events. As a result, one proposed special event may have to meet more stringent permitting requirements than other events based on its severity classification. Decision criteria include expected attendance and scope of street closure.
The following examples summarize the permit classification standards of several jurisdictions, and the collective category thresholds specific to each jurisdiction vary by jurisdiction population:
- Alpine County, CA (pop. 1,208) specifies three planned special event
category sizes:
- Minor event – 75–100 people.
- Mid-size event – 101–500 people.
- Major Event – 501+ people: requires public hearing with the Alpine County Planning Commission.
- West Sacramento, CA (pop. 31,615) maintains three planned special
event category sizes:
- Category 1 event – 50 to 499 people.
- Category 2 event – 500 to 2,999 people.
- Category 3 event – 3,000 or more people: requires major police support and traffic control.
- Louisville, KY (pop. 256,231) specifies three planned special event
category sizes:
- Small Event – maximum peak attendance of 500 people or less.
- Special Event – maximum peak attendance of more than 500 and less than 5,000 people.
- Major Event – maximum peak attendance of 5,000 or more people.
- Clarksville, TN (pop. 103,455) states a "minor event" must meet the following transportation impact criteria: (1) event must last no longer than one day and (2) street closures will be less than four hours and limited in scope.
- Palo Alto, CA (pop. 58,598) developed three street use event impact
classifications based on the spatial characteristics of proposed street
closures. The street use event categories are:
- Class A – A celebration, parade, local special event, festival, meeting, procession, concert, rally, march, or any similar occurrence which exceeds one city block in length or obstructs more than one intersection, whether or not such occurrence is moving.
- Class B – A Class A closure or a block party of any similar occurrence not exceeding one city block or one intersection on other than arterial or collector streets, and along which at least two-thirds of the area is in a residential zone.
- Class C – A local special event or similar occurrence involving the display, exhibition, advertisement, or sale of merchandise, etc., upon a portion of the public sidewalk. Cannot exceed 50% of width of sidewalk.
Venue Transportation Management Plan Deployment
Stakeholders often develop transportation management plans specific to a permanent venue, such as a stadium, arena, or amphitheater. Development of site access and parking plans usually occur during venue construction. Transportation agencies and law enforcement may develop traffic control plans, based on a generic or recurring event, for managing transportation operations on streets adjacent to the venue and/or corridors serving the venue during future planned special events. These program planning activities do not focus on a single, known planned special event. Therefore, stakeholders must establish transportation management plan deployment thresholds to ensure availability and placement of adequate resources to maintain satisfactory site and transportation operations during any future planned special event occurring at the venue.
- The parking and transportation management plan for Investco Field
in Denver contains separate traffic management and operations plans,
categorized under four attendance scenarios, for future planned special
events occurring at the venue:(6)
- Sold-out Denver Broncos (football) games.
- Other large events with an attendance of more than 60,000.
- Medium events with an attendance between 40,000 and 59,000.
- Small events with an attendance between 20,000 and 39,000.
The traffic management and operations plans for each scenario vary based on: (1) event patron modal split prediction, (2) site parking lot usage, (3) Investco Field transit service, and (4) level of personnel and equipment resources for traffic control in the vicinity of Investco Field.
Regional Traffic Operations Impact Level
The State of Wisconsin and the City of Los Angeles assign event impact levels for a proposed planned special event:
- The organization of the Traffic Incident Management Enhancement (TIME)
program in southeastern Wisconsin includes a 40-plus agency Freeway
Incident Management Team responsible for providing technical guidance
toward TIME implementation. This group maintains a subcommittee on special
events. The special events subcommittee proposed a concept of creating
a special event traffic management planning tool applicable to any planned
special event proposed in the greater Milwaukee metropolitan area. The
tool proves particularly useful for assessing the required multi-agency
response to a planned special event proposed with relatively brief advance
notice. Based on the input of information related to the previously
described five event impact factors, the tool assigns one of five event
impact levels to a proposed event. The following numerical thresholds
define the five event impact levels:
- Traffic Condition Level 1 = 15
- Traffic Condition Level 2 = 25
- Traffic Condition Level 3 = 35
- Traffic Condition Level 4 = 45
- Traffic Condition Level 5 = 65
Figure 2-6 shows a draft version of the planning tool, including the numerical values assigned to each event impact factor answer. TIME stakeholders plan to develop an action plan corresponding to each identified planned special event level. The action plan will list recommended practices for stakeholders that regularly manage traffic during the occurrence of a planned special event, including the Wisconsin DOT – District 2, county highway departments, law enforcement, and event venue personnel. These recommended practices would detail required staffing levels, on-call equipment, alternate route usage, traffic signal system modifications, available transit options, and other information.(7)
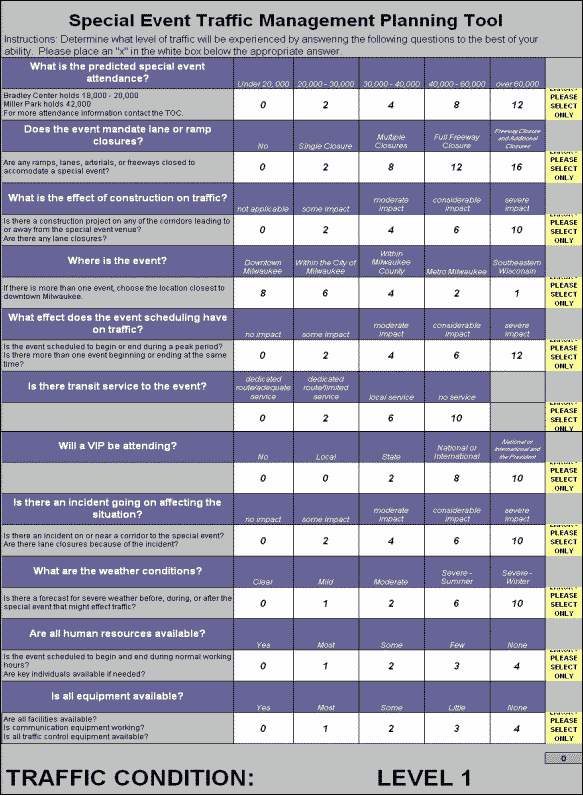
Figure 2-6. Wisconsin TIME Program Special Event Traffic
Management Planning Tool
(Graphic courtesy of the Wisconsin DOT.) D
- The City of Los Angeles DOT (LADOT) and Los Angeles Police Department
(LAPD) maintain a database of planned special events scheduled to occur
within the agencies' jurisdiction. The LADOT and LAPD assign an event
impact level to each event to describe the general scope of each agency's
involvement in advance planning and day-of-event traffic management.
The event impact levels include:
- Level 1: Install and enforce temporary parking restrictions.
- Level 2: Level 1 and deployment of traffic officers (LAPD).
- Level 3: Level 2 and engineering/ATSAC support (LADOT).
- Level 4: Coordinated major event response effort.
ATSAC refers to LADOT's Automated Traffic Surveillance and Control System. Initially deployed for the 1984 Summer Olympic Games, ATSAC is a computer traffic signal system that monitors traffic conditions and system performance, selects appropriate traffic signal timing strategies, and performs equipment diagnostics and alert functions. Operators at the ATSAC Operations Center receive real-time information from signalized intersection detectors and signal controllers, and operators have access to closed-circuit television images at critical locations throughout the City.(8)
Stakeholder Groups
Transportation system performance during a planned special event affects numerous stakeholders. Achieving seamless and efficient transportation operations between freeways, streets, parking facilities, and transit serving a special event venue requires a sound multidisciplinary, inter-jurisdictional, and inter-modal approach. The organization and coordination of planned special event stakeholders is paramount to meeting the goals of planned special event management: achieving predictability, ensuring safety, and maximizing efficiency. Steps toward meeting this objective begin in the advance planning of traffic management plans and other initiatives and continues through implementation and day-of-event travel management.
Planned special events can involve a wide range of stakeholders with diverse goals and incentives. One of the biggest challenges to consistently achieving effective planned special event management is coordinating and integrating the responses of all involved stakeholders, each with responsibility to serve the public, but with sometimes divergent priorities and performance objectives. Each stakeholder has its own norms, guidelines, sense of authority, and internal culture. The involvement of multiple stakeholders can threaten the sense of security and authority of each, causing such groups to unconsciously de-emphasize the public good each has set out to serve.(9) As a result, the objectives of the collective stakeholder group are left unfulfilled.
Several stakeholders active in the advance planning and management of planned special events also team to mitigate the occurrence of unplanned events, such as traffic incidents and other emergencies, through proactive planning and response. These stakeholders include transportation agencies, law enforcement, and emergency service agencies. It should be recognized that the roles and responsibilities of stakeholders involved in managing unplanned events change under planned special events. However, the important partnerships and level of trust established between stakeholders carry over to groups formed to plan and manage planned special events.
Figure 2-7 shows that advance planning and day-of-event management of travel for planned special events involves stakeholders comprising the following three distinct groups:
- The oversight team involves stakeholders participating in program planning activities to improve the management of travel during future planned special events. These stakeholders include mid-to-upper level representatives of transportation agencies and law enforcement. Additional stakeholders include elected officials, regional organizations, and other government agencies. Members of an oversight team work to establish policies, regulations, procedures, and task forces for future application to a specific planned special event. Team members may interact with an event planning team, consulting on feasibility study results and evaluating conceptual transportation management plan components. Stakeholders may also work independent of the team to evaluate potential new technology applications that may improve their performance and capabilities while meeting team objectives.
- The event planning team involves stakeholders participating in event-specific operations planning and traffic management plan implementation tasks. Stakeholders comprising the oversight team typically have mid-level representatives serving on the event planning team. Other stakeholders include the event organizer, media, emergency service agencies, private industry, and the public. Due to the wide range of advance planning tasks and potential event management initiatives, an event planning team may create a number of satellite task forces. Example task forces include a communications subcommittee or task force on evaluating potential travel demand management strategies.
- The traffic management team involves stakeholders responsible for managing travel on the day-of-event. These stakeholders include operations managers and field personnel representing transportation agencies, law enforcement, the event organizer, media, and private industry. An event traffic management team typically interacts with the event planning team during implementation activities. The traffic management team may also debrief the oversight team and event planning team during post-event evaluation activities.
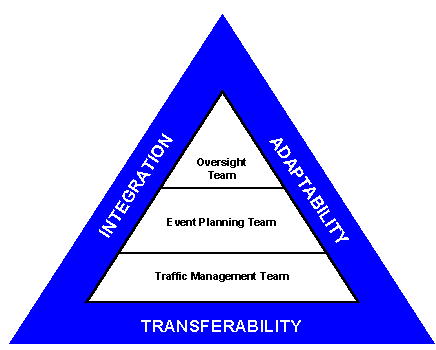
Figure 2-7. Planned Special Event Stakeholder Groups
Major annual event or venue task forces exist in some jurisdictions that serve the role of both an oversight team and event planning team. The task force may meet year-round to mitigate lessons learned from past events, then expand to include additional event operations stakeholders as the next event nears.
The success of each identified stakeholder group in meeting the goals of managing travel for planned special events depends on three criteria: integration, adaptability, and transferability:
- Integration refers to achieving stakeholder cooperation and coordination across disciplines and jurisdictional boundaries. Interagency resource sharing represents a product of such stakeholder coordination.
- Adaptability concerns the ability of stakeholders to adapt to new roles and responsibilities unique to managing travel for planned special events. These new roles may involve changes in stakeholder authority compared to roles under other types of planned and unplanned events.
- Transferability refers to maintaining continuous interagency communication, sharing of expertise to effect interagency training, and exchanging observations and lessons learned relative to stakeholder experiences.
The discussed criteria facilitates good management that, in turn, helps meet the needs of all road users and achieve satisfactory outcomes for each involved stakeholder.
References
1. "FIMT 2002 Event Season Wrap Up – Summerfest Round Table," Milwaukee World Festival, Inc., Milwaukee, Wisconsin, 2002.
2. Shell Grand Prix of Denver – Parking and Traffic Management Plan, Prepared for the Grand Prix of Denver by URS Corporation, August 2002, 33 pp.
3. "MUTCD Millennium Edition, Proposed Revision No. 2, 5/21/2002," Federal Highway Administration, Washington, D.C., 2002 [Online]. Available: http://mutcd.fhwa.dot.gov/kno-millennium_npa.htm. [2003, March 11].
4. "Protocols for Incidents in Region 6," Colorado Department of Transportation – Region 6, Denver, Colorado, March 1999.
5. Smith, M.C., "King of Super Bowl Roads," Orange County Register, January 25, 2003.
6. Parking and Traffic Management Plans for Investco Field at Mile High, Prepared for the City and County of Denver by Turner/HNTB, June 2002.
7. Silverson, S., Wisconsin Department of Transportation – District 2, Personal Communication, February 18, 2003.
8. "Los Angeles City Traffic Info," City of Los Angeles Department of Transportation, Los Angeles, California, 2003 [Online]. Available: http://trafficinfo.lacity.org. [2003, May 14].
9. Strategic Highway Research: Saving Lives, Reducing Congestion, Improving Quality of Life, Special Report 260, Transportation Research Board, Washington, D.C., 2001, 220 pp.
Planned Special Events Traffic Management | Privacy Policy