An Assessment of the Expected Impacts of City-Level Parking Cash-Out and Commuter Benefits OrdinancesAppendix D. Additional ResultsThis appendix summarizes some additional results of extensions to the core analysis performed by the research team. Daily Citywide VMT Reductions for Affected Commuters Only: Scenarios 1 and 2While Scenarios 3, 4, and 5 apply to all employees, Scenarios 1 and 2 only apply to a subset of the citywide employee population. Namely, Scenario 1 is a policy impacting employees whose employers offer free parking as a commuter benefit and who do not already receive parking cash-out. The population impacted under Scenario 2 is slightly less than that impacted under Scenario 1. That is, Scenario 2, like Scenario 1, applies to employees who have free workplace parking and who do not already receive parking cash-out, but additionally only to those who do not already receive employer-paid transit commuter benefits. Recall that results in VMT reduction were reported as the percent change in daily citywide commute VMT. Commuters citywide are impacted by Scenario 3, 4, and 5 unlike under Scenarios 1 and 2. Scenarios 1 and 2 could, however, have major impacts on commuters subjected to their requirements. To highlight this, the VMT reductions produced by Scenarios 1 and 2 can also be presented in terms of the percent change in daily affected commuters’ VMT. Percent changes for affected commuters only, since this is a subset of commuters citywide, will be larger than for workers citywide, as the latter includes workers not affected by the policies. The raw reduction being considered (assuming 2x post-pandemic telework rates, in this case) remains the same. VMT reductions as a percent of affected commuters’ VMT are displayed in Table 14 alongside the baseline citywide reductions. Even though Scenario 1 is estimated to produce larger raw VMT reductions compared to Scenario 2 (as is demonstrated by the greater impact of Scenario 1 in the citywide reductions), in some cases (i.e., Washington, D.C.) the percent reduction in affected commuter VMT for Scenario 2 is higher than the percent reduction in affected commuter VMT for Scenario 1. In a market like Washington, D.C., where a high proportion of commuters already receive transit benefits (66 percent) and where transit commute costs approach the market value of parking, the additional benefit received for the population already receiving transit benefits (the majority of the employee population impacted) would be relatively low. Namely, that benefit would be what remains from the market-rate of parking after applying the value toward transit benefits pre-tax, or approximately $60 a month taxable cash. In contrast, the benefit for the population affected under Scenario 2 (those receiving free parking who do not already have transit benefits) would reflect the full value of their transit commute costs, approximately, or $150 a month. This is a relatively high value compared to what the majority of commuters impacted under Scenario 1 would receive. This results in a greater VMT percent reduction for affected commuters under Scenario 2 versus Scenario 1 in this market.
*The baseline affected commuter VMT for Scenario 1 is commute VMT for employees with access to fully subsidized parking, without existing parking cash-out; the baseline for Scenario 2 starts with the Scenario 1 baseline and then also excludes VMT from employees who already have access to employer-paid transit commuter benefits. Scenario Extensions to Exempt Small Employers: Scenarios 1A and 3AResults from the Scenarios 1 and 3 extensions to exempt small employers are displayed in Table 15 and figure 10 (percent reductions in citywide commute VMT, all commuters), and Table 16 and figure 11 (raw VMT reductions under most likely telework scenario). As expected, the reduction potentials of Scenarios 1A and 3A are lower than those for Scenarios 1 and 3, respectively. However, these differences are sometimes (but not always, as explored in the following paragraph) minor, likely because the majority of employees in the analyzed cities (more than 80 percent) work for larger employers. Examining these scenarios through the lens of excluding small employers is valuable, given the number of real-world commuter-benefits ordinances, described earlier, that exempt small employers. The reductions under this extension to exempt small employers differ more from the base scenarios in some cities (i.e., Chicago, Los Angeles, Philadelphia) than others. This is due to disproportionate differences in the baseline employees impacted under the base and small employer exemption cases. In the case of Los Angeles, for example, VMT reduction potential is more significantly reduced when excluding small employers under Scenarios 1A and 3A, given a greater proportion of employees in Los Angeles than elsewhere working for smaller employers (almost 20 percent compared to 13 percent on average across the other cities).Chicago and Philadelphia, by contrast, have a higher employee population in the biggest employer category (>70 percent) and low starting numbers for the percentage of employees offered transit benefits (10 percent and 15 percent for Chicago and Philadelphia, respectively).Based on the Seattle scaling data presented in the previous section (see Table 10), the proportion of employees working for “large” firms (with 20 or more employees) receiving transit benefits (69 percent) was higher than the proportion receiving transit benefits (44 percent) of employees working for “small” firms (with less than 20 employees), which impacted modeled results. Specifically, the policy impacts would affect employees working for larger employers less than those working for smaller employers (as the change in benefits experienced by employees offered cash-out who were not also offered transit benefits to start would be greater than for those who already had been offered transit benefits), and thus, exempting smaller employers would reduce overall benefits disproportionately. Note that Houston, San Diego, and Indianapolis also have 70 percent or more of their employee population working for large employers and have low starting numbers for the percentage of employees offered transit benefits. However, the percentage change impact of this is not as prominent as in Chicago and Philadelphia for these cities, since the base scenario VMT reductions in these cities were lower to begin with (this trend is more visible when looking at the raw reductions in figure 11). For New York, the differences in impacts between Scenarios 1 and 1A are minimal, given the city’s low starting percentage of employees with access to free workplace parking (4 percent). However, once the entire employee population is considered under Scenario 3, the impact of exempting small employers is significant in New York. Additionally, the absolute reductions in VMT reported for New York are, as shown in Table 16, large (indeed, the largest of any of the cities for Scenarios 3 and 3A) due to the size of the employee population (>4 million).
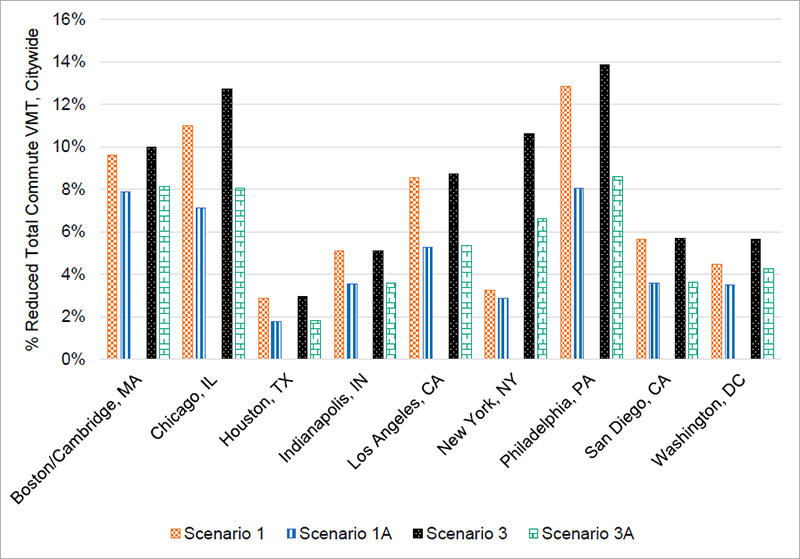
Source: FHWA. A bar graph where the y-axis shows the percentage reduced total commute VMT, citywide and the x-axis shows Boston/Cambridge, Chicago, Houston, Indianapolis, Los Angeles, New York City, Philadelphia, San Diego, and Washington DC results for Scenarios 1, 1A, 3, and 3A. For Scenario 3A, Philadelphia, PA saw a 9% reduction in daily citywide commute VMT compared to 14% for Scenario 3. The data in this bar graph is shown in full in Table 15.
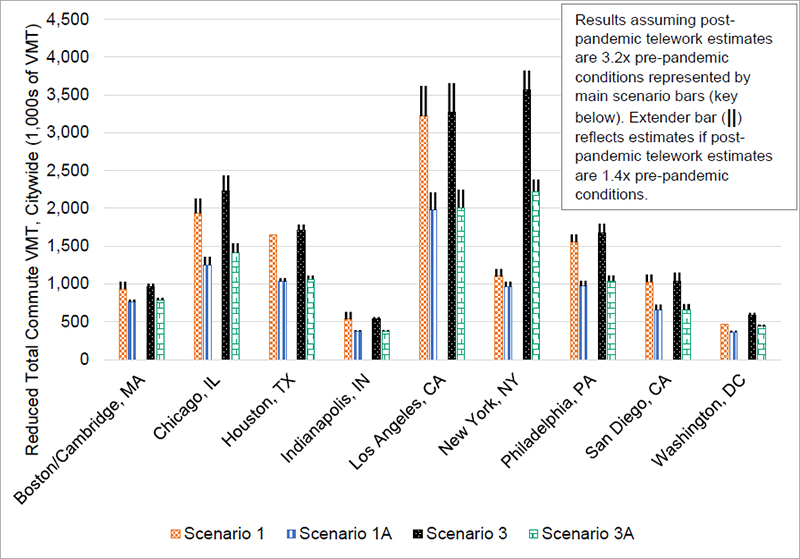
Source: FHWA. A bar graph where the y-axis shows the thousands of daily reduced total commute VMT, citywide and the x-axis shows Boston/Cambridge, Chicago, Houston, Indianapolis, Los Angeles, New York City, Philadelphia, San Diego, and Washington DC results for Scenarios 1, 1A, 3, and 3A. For Scenario 3A, New York City saw a daily commute VMT reduction of 2.3 million, compared to 3.7 million in Scenario 3. The data in this graph is presented in Table 16 in full.
In the case of the Washington, D.C., law, employer-owned parking is also excluded (until it is sold).34 Because of this, the research team investigated limiting this analysis to consider employers who lease their parking only. The research team was not able to identify a recent data source that described the proportion of employees receiving free parking by employer size and whether or not their employers owned parking. A recent independent dataset describing owned-parking rates was also not identified. Two reports, albeit not recent ones, show that between 45 percent and 69 percent of employers or facilities have owned parking, with higher rates for large employers (~78 percent) (Shoup and Breinholt, 1997; DVRPC, 1993). As such, the outright exclusion of owned parking from the studied scenarios may be very detrimental to affecting travel behavior and negative driving-related externalities. One cautionary note in considering the use of these reports, in addition to their age, is that, at least anecdotally, it does seem that leased parking may be much more prevalent in serving city office populations than others (although, as noted, good data on this is unavailable). While Washington, D.C., excludes owned parking once sold, another alternative is to institute a date-end requirement limiting the exemption for owned parking to no more than, for example, 5 years instead of exempting owned parking entirely for the studied scenarios. Such a requirement could help mitigate the limited reduction potential for related commuter benefits and parking cash-out policies if owned parking is excluded. Free Versus Partially Subsidized ParkingThe referenced data sources to determine the percentage of employees receiving parking subsidies often either did not differentiate between free and partial parking subsidies or relied on questions that, while touching on this difference, were asked vaguely. Additionally, responses sometimes did not provide details on the level of subsidies provided. The current analysis assumes that employees without free workplace parking receive no other parking subsidy. Partial subsidy exclusion from analysis may result in impacts being underestimated. To investigate what the impact of this assumption would be, the research team reviewed what information was provided by each source referenced for parking subsidies and tried to put this information in the context of Scenario 1. Of the referenced sources, the following gave some information about partial versus full subsidies (for other cities, the only data provided was on free parking or worded vaguely such that other subsidy levels could not be separated out35):
Table 17 summarizes the percentage of employees receiving free and subsidized parking for Chicago (based on the data provided) and for Washington, D.C. (based on the applied estimation).
To evaluate how partial subsidies might impact the policy scenario results, the research team ran a sample analysis for Scenario 1 using subsidy level estimations for Chicago and Washington, D.C. For Chicago, the midpoint of the subsidy ranges provided were used to estimate actual subsidy levels (e.g., 0.4 percent of the employee population received a 13 percent subsidy (midpoint of 1 percent and 25 percent), 0.1 percent of the employee population received a 50.5 percent subsidy (midpoint of 26 percent and 75 percent), and 0.4 percent of the employee population received an 87.5 percent subsidy (midpoint of 76 percent and 99 percent)). Given that no additional information was provided about partial subsidy levels in Washington, D.C., the research assumed a 50 percent parking subsidy for the 2 percent of the employee population reporting to receive partial parking subsidies. Recall that, under Scenario 1, the research team calculated an opportunity cost for parking based on the monthly average parking rate (assumed parking rate for CBD parking) and the monthly average transit pass cost (assumed rate for non-CBD parking) for each city, adjusting for the fact that some employers were already offering subsidized transit or (in California) parking cash-out, and also that some benefits would be tax free (e.g., employer-paid transit passes), while other benefits would be taxable (e.g., cash). This process was repeated for this sample analysis (as outlined in Equation 3 through Equation 5 from Calculating Travel Impacts in Appendix C. Data and Analysis Methodology), except parking cost values (both the CBD and non-CBD assumed values) were scaled to reflect the amount of parking subsidy offered. Table 18 shows the calculations for the different subsidy values.
Using these additional opportunity costs for the populations receiving partial subsidies in Chicago and Washington, D.C., the research team re-estimated Scenario 1 to additionally consider this partial-subsidy receiving population. The team ran separate analyses (as defined for Scenario 1 in Appendix C. Data and Analysis Methodology) for each population with their respective opportunity costs of driving, and then added the weighted results (proportionate to their representation) together. The results from this sample analysis are displayed in figure 12. These estimates are reductions for citywide commute VMT and not only affected commuters. The values between the base Scenario 1 and the re-run accounting for partial subsidies are not differentiable at the nearest percentage point. This is likely due to the small (<1 percent in Chicago, and 2 percent in Washington, D.C.) employee populations estimated to be receiving partial subsidies, plus the policy being less impactful to shift behavior for partial versus fully subsidized parking cases (because the average benefit received in partial subsidy cases is less than what employees with fully subsidized parking would be eligible for). 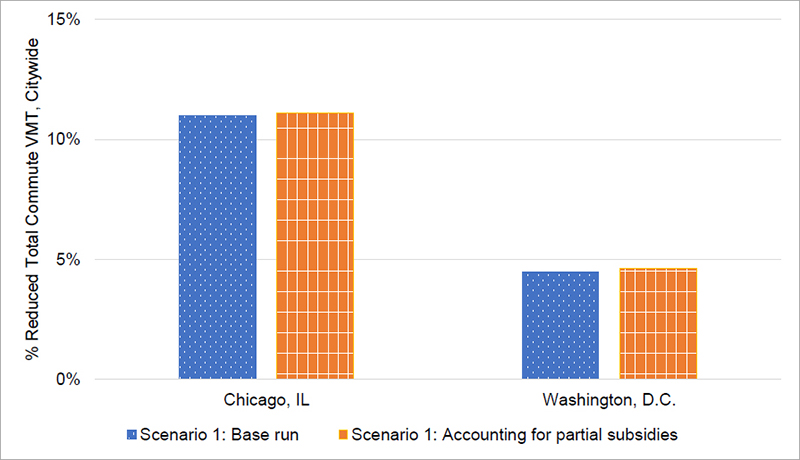
Source: FHWA. A bar graph where the y-axis shows the percentage reduced daily total commute VMT, citywide and the x-axis shows Scenario 1 base and partial subsidy results for Chicago and Washington, DC. For Chicago, IL, the Scenario 1 partial subsidy run saw a reduction of 11.1%, compared to 11% in the base run.
A number of factors may impact the influence of considering partial subsidies (or not), including the proportion of commuters receiving partial versus full subsidies, the proportion of commuters receiving partial subsidies overall, the amount of the subsidy received, the price of parking, and the estimated opportunity cost of continuing to drive and park. This analysis also assumed the same starting mode shares for those receiving full and partial parking subsidies; if the driving mode shares for those receiving partial subsidies are lower, this sample analysis would overestimate the impacts of accounting for partial subsidies (i.e., if less of the partial subsidy receiving population is driving to start, the raw VMT reduction added to the fully subsidized parking reduction would be lower, producing a lower overall impact). Additionally, these results may change if a higher or lower subsidy amount was actually received by commuters. Given the unique characteristics of each city in this analysis, as well as the lack of additional data for other cities, the estimates for Chicago and Washington, D.C., should not be accepted as a rule of thumb adjustment for other cities. That being said, these two case studies strongly suggest that accounting for partial subsidies should not drastically impact results in cities where low proportions of the population receive parking subsidies. 34 See more about Washington, D.C.’s cash-out law here: https://code.dccouncil.gov/us/dc/council/laws/23-113 [ Return to Note 34 ] 35 Houston’s survey included two different response options to indicate the offering of a parking subsidy. One response option clearly indicated that the parking was free, while the second was more ambiguous. Given that Houston shares many characteristics of other lower-density cities that FHWA analyzed with relatively high rates of free and subsidized parking, FHWA considered adding the positive responses (for a sum of 41 percent) from the survey together to be reasonable. [ Return to Note 35 ] | ||||||||||||||||||||||||||||||||||||||||||||||||||||||||||||||||||||||||||||||||||||||||||||||||||||||||||||||||||||||||||||||||||||||||||||||||||||||||||||||||||||||||||||||||||||||||||||||
|
United States Department of Transportation - Federal Highway Administration |
||