Chapter 4. Lessons LearnedUse Case SummaryThe project team presented use cases for Cruise Detector. All the cases were analyzed for time of day cruising and general geography, and, in all but one case, included a longitudinal analysis. The Seattle case analyzed two specific meter pricing policies and also, as briefly noted in Chapter 3, acquired data from two distinct sources for the analysis. The Washington, DC, use case illustrated different cruising patterns around different land uses, focusing on sports arenas/concert venues and rail transit stations. The Atlanta use case highlighted mixed use streets and the differences in trip destinations and cruising that arose from travel changes related to the pandemic. The Chicago use case presented a year-on-year longitudinal analysis. Bringing all the cases together suggests that parking is hardest to find in the late afternoon/early evening. In Chicago, Seattle, and Atlanta the most cruising occurred between 4 and 6 p.m. (in Washington, DC, the most cruising occurred at noon). A general lag in cruising trips occurs shortly after the higher volumes of all trips likely due to earlier trips ending in the use of on-street parking, and the subsequent lack of availability of such parking leading to cruising. Cruising as a percent of trip making varies in a narrow band throughout the day and across cities. The latter fact is illustrated in Figure 66. Seattle is shown twice in Figure 66, given the two different data sources. 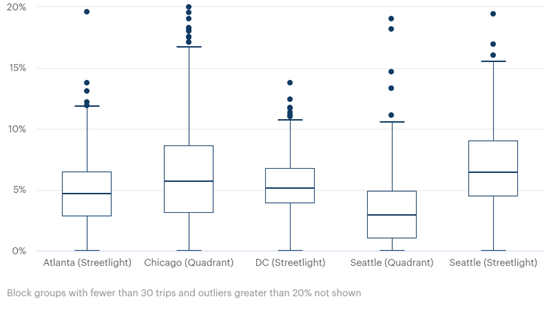
Source: FHWA. Figure 66. Cruising across geographies.
This figure is a bar chart with box and whisker plots representing StreetLight and Quadrant data for Atlanta, Chicago, DC, and Seattle. The y-axis ranges from 0 to 20 percent. The x-axis depicts datasets for Atlanta (StreetLight), Chicago (Quadrant), DC (StreetLight), Seattle (Quadrant), Seattle (StreetLight). The Atlanta (StreetLight) dataset has a minimum of 0 percent, a first quartile of approximately 3 percent, a median just under 5 percent, a third quartile just over 6 percent, and a maximum at approximately 12 percent. Four known outliers are between the 12-percent maximum and 15 percent and one outlier at just below 20 percent. The Chicago (Quadrant) dataset has a minimum of 0 percent, a first quartile of approximately 4 percent, a median of approximately 6 percent, a third quartile of approximately 7.5 percent, and a maximum of approximately 16 percent. Seven known outliers are between the 16-percent maximum and 20 percent. The DC (StreetLight) dataset has a minimum of 0 percent, a first quartile of approximately 4 percent, a median at slightly more than 5 percent, a third quartile at approximately 6 percent, and a maximum at approximately 11 percent. Several known outliers are between the 11-percent maximum and 15 percent. The Seattle (Quadrant) dataset has a minimum of 0 percent, a first quartile of slightly more than 1 percent, a median slightly greater than 2.5 percent, a third quartile at approximately 5 percent, and a maximum of approximately 10.5 percent. Five known outliers are between the 10.5-percent maximum and 20 percent. The Seattle (StreetLight) dataset has a minimum of 0 percent, a first quartile of slightly less than 5 percent, a median of approximately 6.5 percent, a third quartile of approximately 9 percent, and a maximum of approximately 15.5 percent. Three known outliers are between the 15.5-percent maximum and 20 percent.
Table 4 summarizes the findings across the various use cases. Cruising here was found to add, on average, under 2 minutes to travel. In Chicago, in the base case, it added fewer than 3 minutes. The highest rates of cruising were found in Seattle and Chicago where 7.3 and 6.8 percent of trips, respectively, showed some portion as cruising.
ConsiderationsThis section covers lessons learned on data quality and implementation of the tool. Third-Party Processing or Raw Location DataIn this project raw location data were juxtaposed with processed data. Each approach has advantages and disadvantages. In terms of this project, using a third-party processor was costly, time consuming, and required a well-defined sense to begin with of how data should ultimately be aggregated. The delivery of point data (i.e., where cruising and non-cruising trips ended) prevented a detailed analysis of which streets had been traversed. In Seattle, where output showed more cruising trip ends on blocks where meter prices had increased, it was only by using the raw location data that the project team was able to show that those trips had traversed primarily metered streets. Hence, it is assumed drivers were looking for available parking and not necessarily looking for free parking. Relying only on trip-end data, the notion that the meter price increase meant accommodating more trips rather than causing more cruising (due to searching for free parking or lower-cost meters) is a plausible explanation rather than a provable or disprovable hypothesis. Using traces that show the entire cruising path would convert plausible into provable. Another disadvantage of using the third-party processor is that once the data were run and aggregated, there were no opportunities to redefine the study areas or more deeply investigate questions that might have arisen from initial analysis. The advantages of raw location data are the complements to the disadvantages of using the third-party processed data. At the same time, the raw location data have their own disadvantages. These data were of varied consistency with fewer guarantees of their quality, primarily due to volume. They appeared to be sensitive to or biased by the times of day that applications are used, rather than the times of day that people travel. The processed data may have had similar shortcomings. The third-party data, being opaque to the analysts, could not be assessed in this regard. Computing ResourcesCruise Detector requires a high-performance central processing unit and at least 32 gigabytes (GB) of random access memory. Parallel processing capability is recommended, and therefore a multicore processor with a minimum of eight cores is recommended. The tool was developed and tested using a machine with an Intel® Xeon® W-2265 processor* with 3.5 gigahertz and 12 cores. On that machine 20 GB of GPS point location data took approximately 10 days to process. Users should ensure they have enough hard disk space to store both the raw GPS data and the Cruise Detector database. When processing, Cruise Detector may need as much as twice the hard drive space as the size of the raw data. The amount of hard drive space can be reduced by running the data in smaller batches. Running Cruise Detector in smaller batches also reduces the risk of errors or crashes. Data Quality ConcernsCruise Detector relies on relatively high-resolution GPS traces (recommended minimum of 1 ping per minute; twice that density is preferred) that identify discrete vehicle trips. In-car navigation devices may be likely to provide the most reliable data, but many GPS data vendors offer only location data mined from smartphone applications. Often they do not specify the data source. Data quality can vary from vendor to vendor, from month to month from the same vendor, and across cities from the same vendor. For example, in this project the same vendor provided data for Seattle and Chicago. The Chicago data for June 2019 and 2020 were robust; Chicago data for June 2021 were of insufficient quality to use. Meanwhile, Seattle data for 2021 from the same vendor were highly reliable while Chicago data for 2021 were not. Seattle data in 2019 were of limited use. When negotiating with GPS data providers, analysts should consider obtaining samples of data to assess the resolution, quality, and any steps that may be needed to turn the sequence of GPS points into discrete trips. Information on how the sample was collected (e.g., whether the GPS points are from particular applications) may help analysts assess potential biases. Where available, analysts should also consider using GPS data that have a known source and sampling mechanism, such as those collected as part of GPS-enabled household travel surveys. Poor quality data, even if a seemingly large base, can yield too few usable trips. In this case and other cases where there may be an insufficient sample size, too few samples will produce unreliable results. Results can be confounded by time of day use patterns for smart-phone applications. The applications-based data generally showed a sharper PM peak than would have been expected based on other sources of trip data. This may reflect the greater likelihood that people use their applications more frequently later in the day. To the extent possible, trip data should be weighted against other sources. The rate of cruising, however, remained consistent regardless of the number of trips and regardless of the time of day, with the exception of early morning hours (1–4 a.m.) where cruising was a higher proportion of all trips. ApplicationsDescribed below are potential applications of Cruise Detector:
ConclusionsAcross all the cities in this analysis, the level of cruising is consistent, even when using different data sources. The estimates in this report are also comparable to earlier work using a similar methodology. Supplementing Table 4 with findings from San Francisco (4 percent or 6 percent cruising, depending on the source) and Ann Arbor (3 percent)27 further illustrates the consistency. In those cases, cruising was found to occur for on average about 500 meters—as long as it would take a driver to access the top floor of a typical parking structure. The consistency, even at times of day or in places where parking is readily available, suggests that many trips identified as cruising may not be people searching for parking, but rather people taking a longer route for other reasons. For example, longer trips may be due to people taking a detour to pick up or drop off other passengers, missing a turn because of inattention or unfamiliarity with the route, or having arguments with other passengers about where to eat or park. Thus, estimates of cruising may overstate a potential parking problem. Consistency in the cruising estimates also point to an equilibrium level of cruising. Other work indicates that where parking is perceived to be scarce, drivers will often park short of their destination, taking the first space they find.28 Where parking is readily available, drivers may be more selective about their choice of a parking space. An analogy is how roadway congestion reaches an equilibrium as users switch modes or departure times based on their tolerance for traffic delay. In general, cruising is a localized issue. Cruise Detector can identify hot spots, but even in these hot spots, the average time spent cruising is typically brief, and cruising only impacts a relatively small percentage of trips. Cruising in the peak city at the peak hour still affects fewer than 10 percent of trips. A car that parks on the top floor of a parking garage will spend more time finding parking than the average driver cruising for an on-street space, although congestion and other externalities may be greater for the latter. * Intel, the Intel logo, and Xeon are trademarks of Intel Corporation or its subsidiaries. [ Return to Note * ] 25 Millard-Ball, Adam, Rachel Weinberger, and Robert Hampshire, “Comment on Pierce and Shoup: Evaluating the Impacts of Performance-Based Parking,” Journal of the American Planning Association 79, no. 4 (2013): 330–36, https://doi.org/10.1080/01944363.2014.918481. [ Return to Note 25 ] 26 Millard-Ball, Adam, Rachel Weinberger, and Robert Hampshire, “Is the Curb 80% Full or 20% Empty? Assessing the Impacts of San Francisco’s Parking Pricing Experiment,” Transportation Research Part A: Policy and Practice 63 (2014): 76–92, https://doi.org/10.1016/j.tra.2014.02.016. [ Return to Note 26 ] 27 Weinberger, Rachel & Millard-Ball, Adam & Hampshire, Robert. “Parking search caused congestion: Where’s all the fuss?” Transportation Research Part C: Emerging Technologies 120, (2020). https://doi.org/10.1016/j.trc.2020.102781. [ Return to Note 27 ] 28 Millard-Ball, Adam, Robert C. Hampshire, and Rachel R. Weinberger, “Parking Behaviour: The Curious Lack of Cruising for Parking in San Francisco,” Land Use Policy 91 (2020), https://doi.org/10.1016/j.landusepol.2019.03.031. [ Return to Note 28 ] | |||||||||||||||||||||||||||||||||||||
|
United States Department of Transportation - Federal Highway Administration |
||