Appendix A. Data Comparability
Comparison of Data Sources
The project team acquired output analysis for Seattle from two different sources: proprietary data were processed by Cruise Detector, but behind a data secure firewall. Output was provided in the form of particular metrics, including number of trips, number of cruising trips, date, and time of day for 15,000 units of analysis. The units were a mix of metered streets, streets within half a mile of a metered street, and for census block groups beyond that. In addition, the research team acquired and processed raw location data for several of the same date periods. The outputs of the two sets were compared to understand comparability and whether the sets might be used interchangeably.
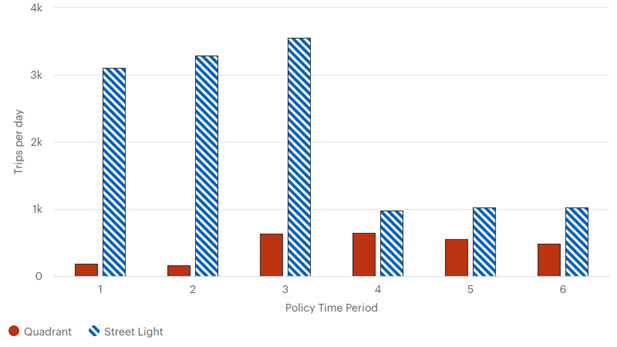
The pre-processed output was aggregated into nine policy time periods, six of which overlap with the second data source (i.e., the raw location data). The first three time periods correspond to most of January and February 2020, divided into before and after the price change. Subsequent periods correspond to late March and early April 2020 (before and after the Seattle parking meters had been temporarily decommissioned). The two data sets varied widely in terms of the volume of trips identified. Trips reported by the third-party processor gradually increased in the first three periods, then dramatically dropped for the remaining time periods—consistent with local stay-at-home orders. The number of trips per day in the raw location sample increased as users (new data sources) were added to their data collection base.
Source: FHWA.
Figure 67. Chart. Volume comparison.
This bar chart shows trips per day for Quadrant and StreetLight data. The y-axis is labeled trips per day and ranges from 0 to 4,000. The x-axis is labeled policy time period and ranges from 0 to 6. The policy time period 1 dataset shows a Quadrant value of approximately 200 trips per day and a StreetLight value of approximately 3,100 trips per day. The policy time period 2 dataset shows a Quadrant value of approximately 200 trips per day and a StreetLight value of approximately 3,300 trips per day. The policy time period 3 dataset shows a Quadrant value of approximately 600 trips per day and a StreetLight value of approximately 3,500 trips per day. The policy time period 4 dataset shows a Quadrant value of approximately 600 trips per day and a StreetLight value of approximately 1,000 trips per day. The policy time period 5 dataset shows a Quadrant value of approximately 500 trips per day and a StreetLight value of approximately 1,000 trips per day. The policy time period 6 dataset shows a Quadrant value of approximately 500 trips per day and a StreetLight value of approximately 1,000 trips per day.
The frequency of cruising was also relatively consistent within each data source, but the raw location data showed consistently lower cruising than the processed data. There was also one notable drop in cruising in the third policy time period in the raw location data set.

Source: FHWA.
Figure 68. Chart. Cruising frequency by policy time period.
This bar chart shows cruising frequency data for Quadrant and StreetLight values. The y-axis is labeled cruising frequency and ranges from 0 to 0.08 percent. The x-axis illustrates policy time period and shows 10 datasets labeled 0 through 9. The policy time period 0 dataset shows a Quadrant value of approximately 0.057 percent and a StreetLight value of approximately 0.07 percent. The policy time period 1 dataset shows a Quadrant value of approximately 0.065 percent and a StreetLight value of approximately 0.07 percent. The policy time period 2 dataset shows a Quadrant value of approximately 0.06 percent and a StreetLight value of approximately 0.072 percent. The policy time period 3 dataset shows a Quadrant value of approximately 0.027 percent and a StreetLight value of approximately 0.072 percent. The policy time period 4 dataset shows a Quadrant value of approximately 0.052 percent and a StreetLight value of approximately 0.058 percent. The policy time period 5 dataset shows a Quadrant value of approximately 0.05 percent and a StreetLight value of approximately 0.058 percent. The policy time period 6 dataset shows a Quadrant value of approximately 0.057 percent and a StreetLight value of approximately 0.06 percent. The policy time period 7 dataset shows no Quadrant value and a StreetLight value of approximately 0.06 percent. The policy time period 8 dataset shows no Quadrant value and a StreetLight value of approximately 0.065 percent. The policy time period 9 dataset shows no Quadrant value and a StreetLight value of approximately 0.059 percent.
In terms of distribution throughout the day, both data sets show the bulk of trips between 8 a.m. and 8 p.m. but there are important differences between these extremes. The raw location data show trips climbing in the morning to an inflection point, after which they continue to climb but at a slower rate. There is a large spike in the afternoon. The processed data displays a diurnal pattern more similar to the expectation of a traditional morning and early evening peak.

Source: FHWA.
Figure 69. Graph. Time-of-day trip distribution Seattle data sources.
This line graph plots trip distribution by Quadrant and StreetLight data. The y-axis is labeled share of trips and ranges from 0 to 12 percent. The x-axis is labeled end hour and ranges from 0 to 24 hours. The Quadrant line starts at 2 percent at hour 0 and steadily declines just above 0 percent at hour 4. It then steadily rises to approximately 5 percent at hour 9 before slightly dipping to approximately 4.5 percent at hour 11. It then steadily rises to approximately 6.5 percent at hour 15 before jumping up and peaking at 10 percent at hour 16. It then rapidly drops to approximately 7.5 percent at hour 17, rises slightly to 8 percent at hour 18 before steadily decreasing to 2.5 percent at hour 24. The StreetLight line starts at approximately 1 percent and gradually decreases to just above 0 percent at hour 3. It sharply increases to just above 8 percent at hour 9. It then steadily decreases to approximately 5.5 percent at hour 12 and flattens at 6 percent between hour 13 to hour 15. It then spikes up to just above 8 percent at hour 18 before steadily declining and ending at approximately 1.5 percent at hour 24.
While the data sets differ temporally, spatially their distribution is much more similar. When the data were grouped by the neighborhood in which the trips end, the comparison is much more similar (Figure 70). This pattern suggests that both data sets are drawing from a similar cross section of Seattle neighborhoods, and the raw location set may be influenced more by when people use applications relative to the processed set, which may better describe when people make trips. The discrepancy is not important for some of the possible analysis, but it suggests the benefit of having independent trip counts in which to weight against. The need for such a step would depend on the kind of analysis required.

Source: FHWA.
Figure 70. Chart. Spatial distribution of trips Seattle data comparison.
This bar chart represents datasets for the share of trip percentages between Quadrant and StreetLight data based on area. The y-axis is labeled share of trips and ranges from 0 to 20 percent. The x-axis is labeled area and has datasets for Ballard, Beacon Hill, Capitol Hill, Central Seattle, Downtown, Georgetown, Magnolia, North Beach/Greenwood, North Gate/Lake City, Olympic Hills, Phinney Ridge/Fremont, Queene Anne/Cascade, Rainier Valley, University District, and West Seattle. The Ballard dataset shows a Quadrant value of slightly more than 5 percent and a StreetLight value of slightly more than 5 percent but slightly less than the Quadrant value. The Beacon Hill dataset shows a Quadrant value of 5 percent and a StreetLight value of slightly more than 5 percent. The Capitol Hill dataset shows a Quadrant value of slightly more than 5 percent, and a StreetLight value of slightly more than 5 percent but slightly less than the Quadrant value. The Central Seattle dataset shows a Quadrant value of 5 percent and a StreetLight value of slightly more than 5 percent. The Downtown dataset shows a Quadrant value of approximately 12.5 percent and a StreetLight value of slightly more than 15 percent. The Georgetown dataset shows a Quadrant value of slightly more than 12.5 percent and a StreetLight value of slightly less than 12.5 percent. The Magnolia dataset shows a Quadrant value of approximately 2 percent and a StreetLight value of slightly less than 2 percent. The North Beach/Greenwood dataset shows a Quadrant value of approximately 7.5 percent and a StreetLight value of slightly less than 7.5 percent. The North Gate/Lake City dataset show a Quadrant value of slightly less than 7.5 percent and a StreetLight value of slightly less than 7.5 percent. The Olympic Hills dataset show a Quadrant value of slightly more than 5 percent and a StreetLight value of slightly more than 5 percent. The Phinney Ridge/Fremont dataset show a Quadrant value of approximately 7 percent and a StreetLight value of slightly less than 7 percent. The Queene Anne/Cascade dataset show a Quadrant value of approximately 6 percent and a StreetLight value of slightly less than 6 percent. The Rainier Valley dataset show a Quadrant value of approximately 7.5 percent and a StreetLight value of approximately 7 percent. The University District dataset show a Quadrant value of approximately 4 percent and a StreetLight value of approximately 5 percent. The West Seattle dataset show a Quadrant value of approximately 7.5 percent and a StreetLight value of approximately 7 percent.
These data sources offer policy analysts new opportunities to gain insights into trip making, cruising, and parking behavior. These analyses have demonstrated that although there is great potential, limitations in research design may arise from lack of data. Additionally, given the lack of transparency in how most data vendors obtain and process their data, researchers should use caution when drawing conclusions from any single data set. Nevertheless, Cruise Detector and location data can be used to identify potential issues that can be verified with additional data.