Weather-Responsive Management Strategies (WRMS) – Agency Tools to Manage Infrastructure Impacts during Flood EventsPrintable version [PDF 596 MB]
U.S. Department of Transportation FHWA-HOP-21-013 WEATHER-RESPONSIVE MANAGEMENT STRATEGIES FACT SHEET BackgroundThe Weather Responsive Management Strategies (WRMS) initiative under the Federal Highway Administration (FHWA) Every Day Counts – Round 5 (EDC-5) program promotes the use of road weather data from mobile and connected vehicle (CV) technologies to support traffic and maintenance management strategies during inclement weather. The goal is to improve safety and reliability, as well as reduce environmental impacts on the transportation system resulting from adverse weather. WRMS can mitigate the impact of major flooding events through preparation efforts that leverage and build data, tools, and agency relationships. As a result, agencies are better equipped for response and recovery efforts. During flooding events, protecting and preserving roadway infrastructure from damage and ensuring structural integrity for use are critical activities for agencies. Post-event inspections are also necessary to identify any long-lasting damage. Although flood events may occur either after a major storm event or seasonally from the spring thaw, similar tools can be leveraged for both kinds of flooding to support management efforts. Flood-related WRMS provide agency staff an understanding of the potential impacts of the event and where the greatest impacts may occur in order to best determine how to use available resources and tools. This fact sheet highlights emerging and commonly used tools that agencies around the country have deployed for flood event preparation, response, and recovery. These tools include water-filled barriers and sandbag systems in Iowa, Louisiana, and North Dakota; unmanned aerial systems (UAS) in North Carolina and North Dakota; night-vision goggles in Oklahoma; and acoustic imaging and hydrographic surveys in Nebraska. Water-Filled BarriersTransportation agencies use water-filled barriers to protect infrastructure from floodwaters and to maintain mobility during flood events. Barriers, as well as pumps, may be strategically placed in advance of a flood event or deployed during the event to help clear flood water off the roadway. Water-filled barriers may even utilize the floodwater itself as a means for inflation with the help of a pump. Both the Louisiana Department of Transportation and Development (DOTD), and the North Dakota Department of Transportation (DOT) have successfully deployed water-filled barriers, as described below. The Louisiana DOTD uses water-filled barriers to maintain highway access during flood events. Travel between Baton Rouge and New Orleans was significantly impacted twice due to flooding following major rain events in 2019. The one-hour trip between these cities during normal conditions took 6–8 hours to bypass flooded roadways. Understanding the duration that floodwaters would remain on the roadway – it took weeks for the floodwaters to recede – Louisiana DOTD explored options to restore travel by removing the water. Although most routes between the two cities were heavily flooded, water levels on divided highway US 61 were low enough to use a network of water-filled barriers. The barriers were placed along the edges of the flooded roadway and inflated using floodwaters. Remaining water on the road was then pumped out beyond the barriers. One challenge encountered along this divided highway were cross drains in the median, which typically remove water. However, during the flood event, these drains became an avenue for flood water to leak back onto the roadway after being pumped out. In response, staff installed temporary damming around the drains to prevent this issue. A significant benefit of the water-filled barriers to the Louisiana DOTD is the ability to reuse them. However, it is recommended that they be cleaned and recertified after each use, as the floodwater used to fill them may be contaminated. 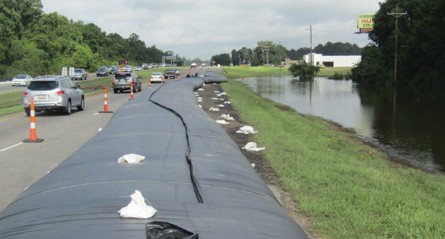
Figure 1a. The Louisiana Department of Transportation and Development (DOTD) successfully used water-filled barriers to manage flood impacts and maintain mobility during flood events in March and August of 2019. (Source: Louisiana DOTD) A large black synthetic water filled bladder/barrier is placed in the right lane of a two-lane road next to a grassy area and flooded ditch area. There are traffic cones to the left of the water-filled barrier, making sure the cars stay in the far-left lane of the two-lane road.
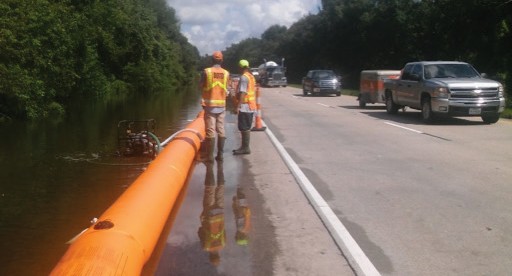
Figure 1b. The Louisiana Department of Transportation and Development (DOTD) checking water-filled barriers next to an evacuation route during March and August of 2019 flooding events. (Source: Louisiana DOTD) A large orange water filled tube/barrier is shown in the breakdown lane of a two-lane road. The water filled barrier is containing floodwater in the grassy area next to the breakdown and stopping the water from flooding the roadway. Two workers in boots and safety vests oversee the water filled barrier. There are several cars and trucks traveling in the far-left lane of the two-lane roadway.
The North Dakota DOT uses a variety of water-filled barriers and water pumps for seasonal flood water mitigation. Typically, North Dakota waterways experience an annual slow-rise flood due to spring thaw, with potential impacts being worse in different locations each year depending on various seasonal factors, like snowfall amounts, temperatures, and spring rainfall. Given the seasonal predictability of flooding, the North Dakota DOT is able to monitor conditions during the thaw. In order to strategically place water-filled barriers, pumps, and other resources around the State each season, North Dakota DOT District staff are asked to provide the top 30–40 locations within each of their eight Districts that they anticipate the greatest impacts. These sites are often along the northern Red River and are mapped at the central office in Bismarck. North Dakota DOT staff monitor all of these sites and work to understand a timeframe in which each site could experience problems in order to distribute equipment and resources. The North Dakota DOT Districts are responsible for ensuring all the equipment is operational. The central office coordinates, with input needs from the North Dakota DOT Districts, to develop a timeline for the availability, reallocation, and distribution of flooding tools and resources across different Districts, particularly those that do not expect to experience significant flooding. Sandbag SystemsWhile water-filled barriers have proven a useful tool, hand-filled sandbags and sandbag systems continue to serve as reliable flood management tools for State DOTs. Sandbags are less expensive than water-filled barriers, but they generally require more labor. The Iowa DOT uses connected sandbag systems and hand-filled sandbags to supplement water-filled barriers. Similar to water-filled barriers, the primary benefit of sandbag systems for Iowa has been to maintain mobility and protect infrastructure, even in deep floodwaters. As an example, during one flood event in Iowa, the Iowa DOT sandbagged a local dirt road identified on LiDAR to be an entry point for flood waters. The road was narrower and easier to protect than a broader area for a downstream highway. Iowa DOT has also temporarily raised roads using Jersey barriers infilled with rock to elevate the road. Unmanned Aerial SystemsIn recent years, a number of State DOTs have initiated programs for unmanned aerial systems (UAS), also known as drones, to support a variety of activities. This is an area of increasing interest and momentum as UAS can provide coverage in places staff cannot easily or safely reach. The use of UAS is relatively new for most State DOTs, and there is much to learn in future flood seasons regarding how data can be used. 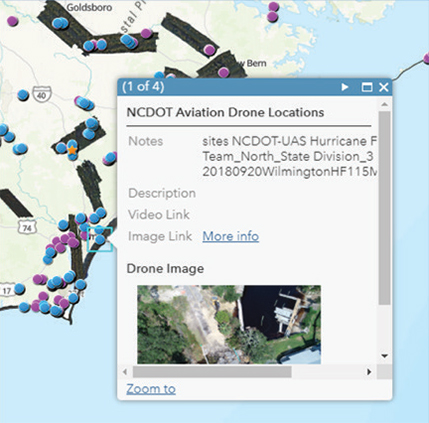
Figure 2a. Details about unmanned aerial systems (UAS) missions in North Carolina are uploaded to a GIS map. (Source: North Carolina Department of Transportation) A map is shown of the Wilmington, North Carolina area with details about unmanned aerial systems (UAS) missions indicated by dots over certain areas. On top of the map is a screenshot of a system dashboard with the title of 'NCDOT Aviation Drone Locations.' The notes field states, 'sites NCDOT-UAS Hurricane Team_North_State Division_3 20180920WilmingtonHF115M.' There is an image link for more info and a snapshot of the drone image is shown.
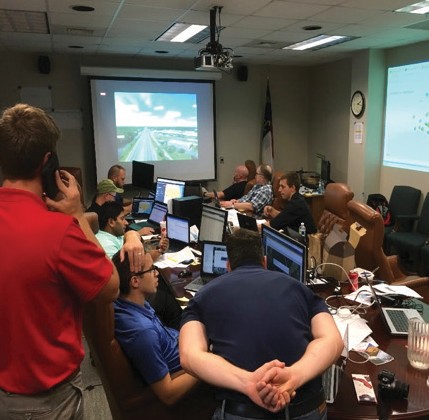
Figure 2b. Leadership at the office can observe UAS missions to answer questions in real-time. (Source: North Carolina Department of Transportation) A group of seven people are gathered around a conference table. This is how stakeholders can view unmanned aerial systems (UAS) imagery as it is broadcast back to the office in real-time during an actual event. Each person has their own monitor and a pull down screen in the front of the room is showing the real-time UAS video. Two people are standing with one looking at the screen of someone sitting at the table and the other person is on a cell phone. A screen on the right wall is showing the UAS locations on a map.
UAS may be deployed for a variety of missions to help agencies understand current flood conditions and inform the traveling public. For example, UAS may be used to identify the flood extent, inspect bridges, and conduct emergency operations like search and rescue, as needed, and help inform the public when roads can be reopened for travel. Select UAS missions identified by the North Carolina DOT to support flood management activities are illustrated in Table 1. During Hurricane Florence in 2018, the North Carolina DOT flew over 250 missions, which captured photos of impacted highways as well as other infrastructure, such as a dam breach, an impacted railroad bridge, and a closed airport. North Carolina DOT generates reports and maps to understand where the field teams are and where missions are being conducted. Photos are taken in the field and a hotspot is used to upload information. Data is ingested, processed, and posted on a GIS map and dashboard, including photos and videos, to help leadership and stakeholders make decisions in near-real time. Additionally, North Carolina DOT staff can talk with the pilot in real-time, which has been beneficial for the agency to address questions posed by a Congressman and North Carolina DOT leadership.
The North Dakota DOT has 14 UAS around the State and 20 staff who are certified to fly UAS, as well as a contract with companies to fly UAS during flood events to be more responsive to flood management needs. North Dakota DOT notes the importance of obtaining aerial photographs quickly from anywhere in the State to accelerate the data collection and data sharing phase. Damage assessment is key, particularly for a state of emergency declaration. During flood events, the North Dakota DOT schedules and dispatches UAS missions on a cycle to monitor how conditions are changing. Flooding images taken by UAS that are provided to the public have resulted in fewer calls received from the public about road conditions, and also helped the North Dakota DOT explain to inquiring politicians why an interstate was closed for 2–3 months, when it would be open, and progress toward reopening. Night-Vision Goggles to Monitor River Debris Around StructuresDuring flood events, Oklahoma DOT staff are often dispatched to critical bridges to watch for debris that could impact structural integrity. In 2019, the Oklahoma DOT began looking for new and innovative ideas to monitor floodwaters and debris flows. An alternate solution identified was to station portable trailer-mounted cameras that are typically used in work zones at critical bridge locations. Although helpful during the day, this proved ineffective during overnight hours. A second solution was to procure night-vision goggles. Night-vision goggles were helpful for viewing the immediate bridge structure. However, due to the limited range of the goggles, Oklahoma DOT staff were not able to see far upstream or the bridge piers of taller bridges. Overall, Oklahoma DOT estimates the night-vision goggles provided about 20–30 percent of the desired effectiveness. Oklahoma DOT continues to seek innovative ideas to improve flood monitoring, including setting up brighter spotlights or infrared lighting. Acoustic Imaging and Hydrographic Surveys for Structural InspectionAfter a major flood event, bridges must be inspected to examine whether there is any structural damage. While this is typically done by divers, an alternative solution is to use acoustic imaging and hydrographic surveys. These tools can create very detailed images in a safe manner when there are concerns for a diver’s safety. They also may take less time than inspections conducted by divers. The Nebraska DOT has contracts with three companies to conduct routine underwater inspections throughout the year. Although these routine inspections are usually conducted with divers, acoustic imagery and hydrographic surveys are also provided. After a major flood in spring 2019, Nebraska DOT worked with these companies and coordinated with other public agencies to access bridges and assess damage with acoustic imaging and hydrographic surveys. At each bridge, the inspections took less than one hour. The instruments were placed underwater with the boat moving around the bridge piers to survey the underwater bridge structure from different angles. Had divers been used, it may have taken an entire day. 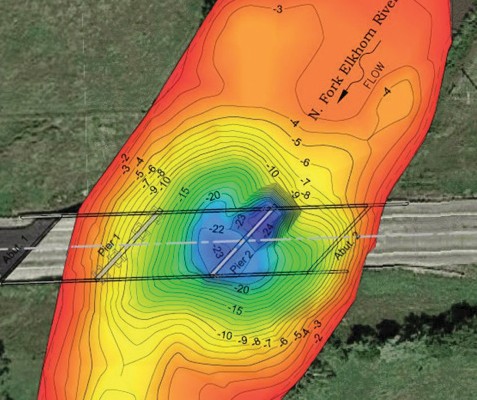
Figure 3. Hydrographic surveys indicated that water elevation upstream and downstream of this Nebraska Route 13 bridge near Hadar was 5 feet or less, but over 20 feet at the bridge. (Source: Nebraska Department of Transportation) Hydrographic survey shows two piers and two bridge abutments with the water level measured in feet using bands of color to represent different depths. Bridge abutment 1 to the far left of the image is on dry land. Bridge abutment 2 on the far right of the image shows water depts varying from 3 to 15 feet. The river has eroded the ground around the second bridge abutment. Pier 1 to the right side of the colored survey image shows depths vary from 4 to 10 feet. Pier 2 towards the middle of the colored survey images shows depths from 22 to 24 feet.
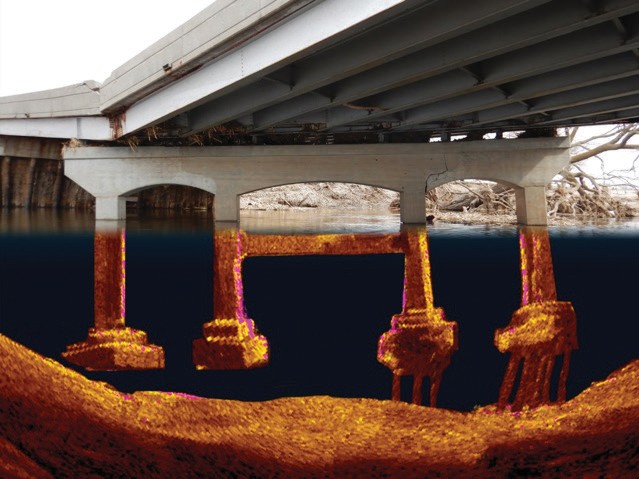
Figure 4. Underwater inspection of a Nebraska Route 13 bridge near Hadar included acoustic imaging that showed timber piles under the upstream footings were crushed or washed away. (Source: Nebraska Department of Transportation) Bridge is shown with 4 piles underneath in the water. Above the waterline is the photo of the bridge and below the waterline is shown as an acoustic image. The two left-hand pile bases below the waterline shown in the acoustic portion of the picture show black space where timber piles should be. The two pile bases on the right have supporting timbers pile below the pile bases.
Acoustic imaging and hydrographic surveys can be a more expensive option; however, these data results in images that make the extent of damage very clear. The tools provide the Nebraska DOT with the information necessary to make an assessment on bridge health without endangering divers. For State DOTs that own their equipment and have trained staff, response time may be faster than for those relying on contractors, particularly in remote areas. While considering acoustic imaging and hydrographic surveys, conduct a benefit/cost analysis on the equipment costs, software complexity, training requirements, and data/images results compared to current or alternative methods. ConclusionsAgencies leverage a variety of tools to support flood management activities to prepare, respond, and recover from severe events. The tools represented in this fact sheet include water-filled barrier and sandbag systems, unmanned aerial systems, night-vision goggles, acoustic imaging, and hydrographic surveys. Collectively, each of these tools can expand and fill an agency’s toolbox to leverage as needed for a variety of flood situations to support and improve flood management practices. Available ResourcesFHWA’s Road Weather Management Program website includes a variety of additional road weather and flood management resources: https://ops.fhwa.dot.gov/weather. Technical ContactsDavid Johnson, FHWA Tony Coventry, FHWA Tina Greenfield-Huitt, Iowa DOT David Miller, Louisiana DOTD Babrak Niazi, Nebraska DOT Basil Yap, North Carolina DOT Travis Lutman, North Dakota DOT Russ Buchholz, North Dakota DOT Marty Farris, Oklahoma DOT For additional information, please contact: David Johnson | |||||||||
|
United States Department of Transportation - Federal Highway Administration |
||