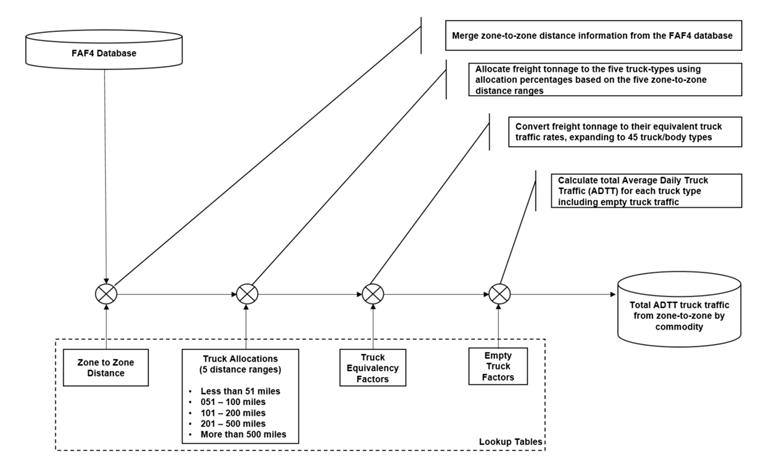
Research, Development, and Application of Methods to Update Freight Analysis Framework Out-of-Scope Commodity Flow Data and Truck Payload FactorsChapter 10. Existing Freight Analysis Framework 4 Truck Payload Factors MethodsChapters 2 through 9 focused on the methods to update Freight Analysis Framework Out-of-Scope Commodity Flow Data. From Chapter 10, the focus shifts to the update and implementation of truck payload factors or Truck Payload Factors (TPF). This chapter reviews the existing Freight Analysis Framework Version 4 (FAF4) methodologies for computing payload, factors by commodity. The methods for FAF4 are described in the Oak Ridge National Laboratory report, FAF4 Freight Traffic Assignment (Maks Inc. 2016). The payload factor method as described is unchanged from those described for Freight Analysis Framework Version 3 (FAF3). Transportation agencies analyze highway deficiencies based on the number of vehicles traveling on highway facilities and comparing that demand to the capacity of those facilities. The Freight Analysis Framework reports and forecasts annual flows in tons between origins and destinations by commodity according two-digit digit Standard Classification of Transported Goods (SCTG2) and mode. By filtering only flows for Freight Analysis Framework (FAF) truck modes, the flows can be reported as a standard origin destination table, by SCTG2 commodity. In order to convert those flows into truck trips, it is necessary to divide those tons by the average of tons per truck. Truck Payload Factors (TPF), often known as truck payload factors, are used to convert those flows in tons into flows by trucks. The existing FAF4 method computes those payload factors by using information from the 2002 U.S. Vehicle Inventory and Usage Survey (VIUS). VIUS had been previously prepared as part of the U.S. Economic Census but has not been conducted since 2002. While VIUS asked a number of operation and usage questions, of particular interest for computing payload factors are those questions concerning trucks carrying commodities. While the VIUS commodity labels and codes are different than the SCTG2 commodity classification, there is a specific VIUS commodity reported for each SCTG2 commodity as used in FAF, as shown in appendix C. VIUS, as a national survey, provides the information required to compute payload by SCTG2 commodity for the entire United States on all roads in the United States. The sampling was done from States registration databases. While the sampling is by State of registration, since the payload factors will be applied for all roads nationally, and registered trucks can operate on roads in States different than the State of registration, the difference between the sampling frame (by State of registration) and the application (on roads in any State) can be ignored. The process used to apply payload factors in FAF4 is shown in figure 66.  Figure 66. Flow chart. Freight analysis framework version 4 truck conversion flow diagram.
(Source: FAF4 Freight Traffic Assignment (Maks Inc. 2016).)
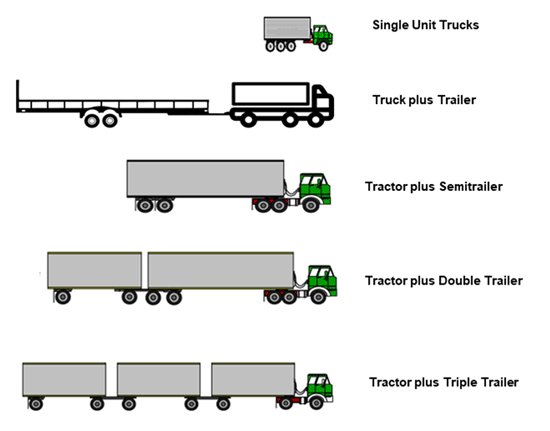
The process develops payload factors by truck size and configuration by SCTG/VIUS commodity, according to 2002 VIUS. The truck configurations are from VIUS and are reported in table 28 (Maks Inc. 2016) and shown in figure 67. (Source: FAF4 Freight Traffic Assignment (Maks Inc. 2016).) Figure 67. Illustration. Vehicle inventory and use survey truck configurations.
(Source: USDOT truck size and weight.) These truck configurations are not sample strata. Single Unit (SU) trucks are the sum of two strata but the combination unit trucks are all within one sampling strata. The use of these "groups" that are not either sample strata, or aggregations of sample strata is not consistent with the VIUS sampling plan. The truck body types, where the body type for trailers refers to the type of trailers, from VIUS, as reported in the FAF4 documentation is shown in table 29 and represents the population share of trucks by body type. (Source: Federal Highway Administration.)Allocation of tonnages to these body type and configurations were given by distance range as shown in table 30. The values in table 30 represent the share of reported trucks, using the axle configuration, body type and trailer types in VIUS, and those trucks were not sampled to ensure a representative sample of these body types. While the allocation factors in table 30 are correct, using VIUS's Trip_Primary distance attribute and the truck populations using table 28, and table 30 does show the usage of smaller trucks for shorter distances. These shorter distances also are reflected when computing the miles and ton-miles for each SCTG2 for each record. When this information is aggregated by SCTG2 commodity, it implicitly reflects this same distribution. Additionally, this distance range properly applies only to the Principal Product Carried. As its use is described, it most probably excludes all records where the Principal Product Carried was reported to be Multiple Categories, because this has no SCTG2 equivalent. By using the reported ton-miles and miles for every SCTG2 commodity, the information from surveys with commodities classified as Multiple Categories will be considered. (Source: Federal Highway Administration.)As noted in table 28, the calculation of trucks from FAF tons by truck is a multi-step process. First, the mean payloads by truck type, body type, and commodity type were calculated using VIUS 2002 database and a study prepared by Battelle for Federal Highway Administration (FHWA) (Alam 2007). The mean payloads were applied to the percent allocations by body type to convert the commodity volume in tons to an equivalent number of trucks. These payload factors (in the report called TPFs) by SCTG2 commodity and truck size are applied to the allocation of truck and body size by distance range. While the allocation factors may be reported from VIUS, those allocation factors also have an error range associated with them that could be reported. The sampling plan in the VIUS ensures that the error, and expansion factor, is within a prescribed standard for the sampling strata but those strata do not vary by commodity, truck body type and distance range as shown above. The sampling strata used in VIUS are shown in table 31. (Source: U.S. VIUS.)The application of the empty truck factor according to the process shown is in the same direction as loaded trucks and applies equally for all commodities within the same body type. The usage of empty trucks is more complicated than this assumption. For example, for some commodities and body types, such as fuel oils in tanker trucks, the empty trucks are most probably in the opposite direction as loaded trucks. Neglecting distance ranges and empty truck factors, using the methods and percentages described in the FAF4 documentation, the payloads by commodity can be computed as shown in table 32. These are the current payload factors excluding the empty truck and distance factors, which could be replaced. They are shown in table 32 to show what the payload factors would be without the distance and empty truck considerations, which is a closer comparison to what will be proposed. It is not clear from the documentation if the survey record expansion factors in VIUS (there are separate expansion factors for trucks and miles) are used in computing the allocation factors. Even if the proper expansion factors were used, the allocation factors are treated as if they were without error. Those percentages have a standard error that can be computed from the standard deviation and the count of the records reported. Finally, the payload factors shown are based on several calculations that include a number of steps (e.g., trucks by commodity based on truck size and body type). The error in computation increases at every step of the process and each time the calculations of payload factors are applied. The adjusted payload factors as shown in table 32 may exceed the legal payload for a truck of 80,000 lbs., when a default empty truck weight of 33,000 is added to those payload factors.64 The implied GVW of a truck for each SCTG2 commodity is shown with those GVWs that exceed the typical legal limit shown in bold text. By computing ton-miles and miles by SCTG within each record and then calculating TPFs or payload factors, from these values with only a single calculation, the error associated with each step of a multiple step calculation process for the summary tables does not occur. It is incorrect to assume that the percentages of a commodity by truck body type and size are without error. It also is incorrect to assume that this error will not increase with each application of these percentages. In order to minimize these errors, the payload factors for FAF could be directly computed for a commodity within a VIUS survey record, not by body type and truck size which are summarized in table form before being used, and may be based on properly expanded information from survey records applicable to that commodity. The first step of a proposed method which minimizes the error and uses information for each record will be discussed in chapter 12. (Source: Federal Highway Administration.)64 Load limits apply to the total weight of a truck, empty plus goods carried. The actual empty weight for any truck size is a range, not a single value. U.S. Environmental Protection Agency (EPA) has used a default empty weight for combination unit (CU) trucks, the most common truck size carrying commodities, as 28K to 36K lbs. 2002 U.S. VIUS for tractor trailers reporting an empty weight, reports an average empty weight of 30,794, but this precision is misleading because there is an also an unknown error associated with this value. 33K lbs. was chosen because it represents the start of the tractor trailer GVW category (33K and above). [Return to footnote 64] |
|
United States Department of Transportation - Federal Highway Administration |
||