Research, Development, and Application of Methods to Update Freight Analysis Framework Out-of-Scope Commodity Flow Data and Truck Payload Factors
Appendix B. Trip Length Distributions by Commodity and Zone
Corn
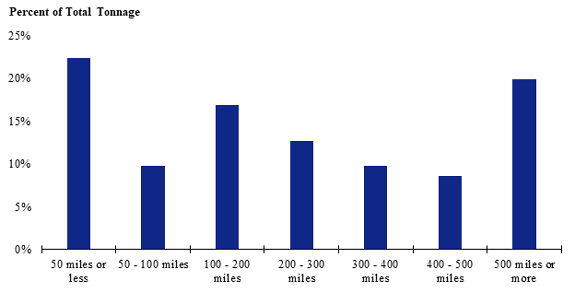 A graph based only on the data from the Southeast zone of America. Shipments of 50 miles or less make up the largest share while shipments between 400 and 500 miles make up the smallest share.
Figure 82. Bar graph. Distribution of shipment distances for farm-based shipments of corn for the Southeast production-consumption zone.
(Source: Federal Highway Administration.)
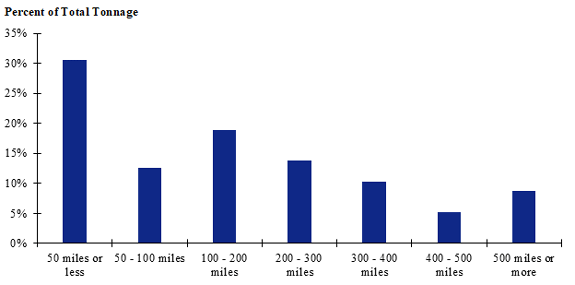 Figure 83. Bar chart. Distribution of shipment distances for farm-based shipments of corn for the Southwest production-consumption zone.
(Source: Federal Highway Administration.)
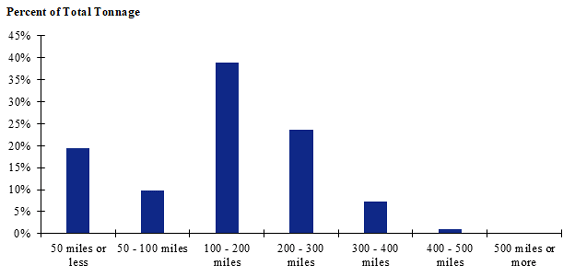 Figure 84. Bar chart. Distribution of shipment distances for farm-based shipments of corn for the Northeast production-consumption zone.
(Source: Federal Highway Administration.)
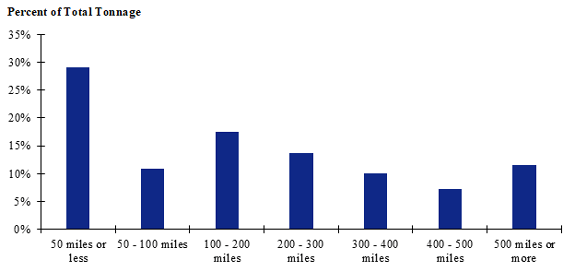 Figure 85. Bar chart. Distribution of shipment distances for farm-based shipments of corn for the Heartland production-consumption zone.
(Source: Federal Highway Administration.)
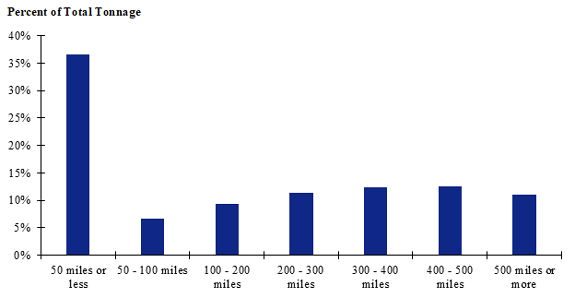 Figure 86. Bar chart. Distribution of shipment distances for farm-based shipments of corn for the Mountain production-consumption zone.
(Source: Federal Highway Administration.)
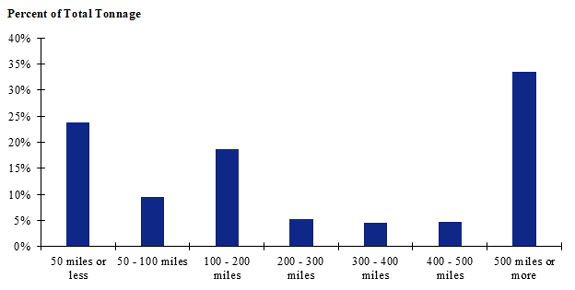 Figure 87. Bar chart. Distribution of shipment distances for farm-based shipments of corn for the West production-consumption zone.
(Source: Federal Highway Administration.)
Farm-Based Shipments of Broilers
Hatchery-to-Farm Movements
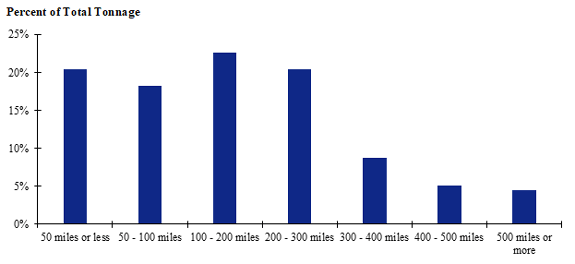 Figure 88. Bar chart. Distribution of shipment distances for hatchery-to-farm farm-based shipments of broilers for the Southeast production-consumption zone.
(Source: Federal Highway Administration.)
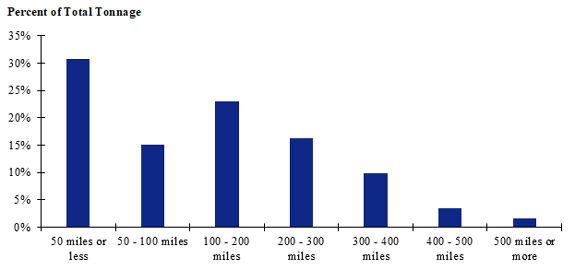 Figure 89. Bar chart. Distribution of shipment distances for hatchery-to-farm farm-based shipments of broilers for the South Central production-consumption zone.
(Source: Federal Highway Administration.)
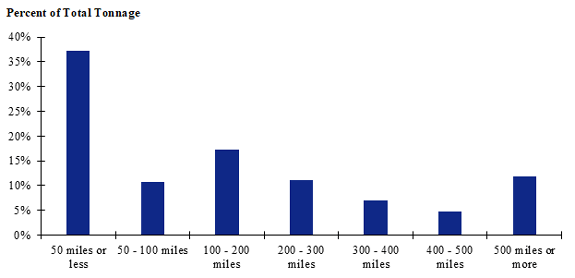 Figure 90. Bar chart. Distribution of shipment distances for hatchery-to-farm farm-based shipments of broilers for the Northeast production-consumption zone.
(Source: Federal Highway Administration.)
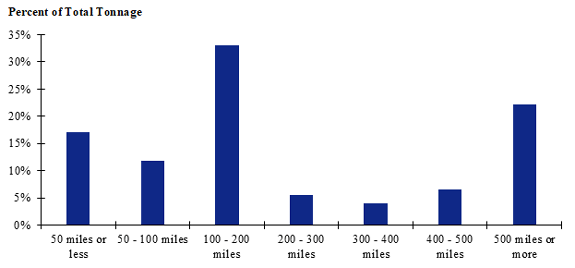 Figure 91. Bar chart. Distribution of shipment distances for hatchery-to-farm farm-based shipments of broilers for the North Central production-consumption zone.
(Source: Federal Highway Administration.)
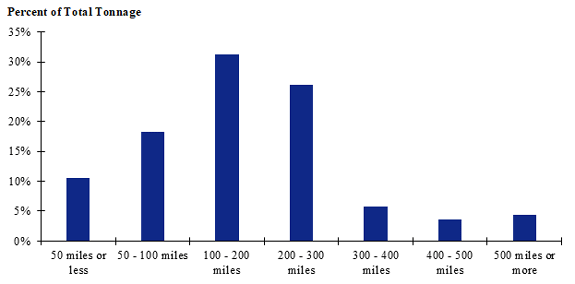 Figure 92. Bar chart. Distribution of shipment distances for hatchery-to-farm farm-based shipments of broilers for the Great Plains production-consumption zone.
(Source: Federal Highway Administration.)
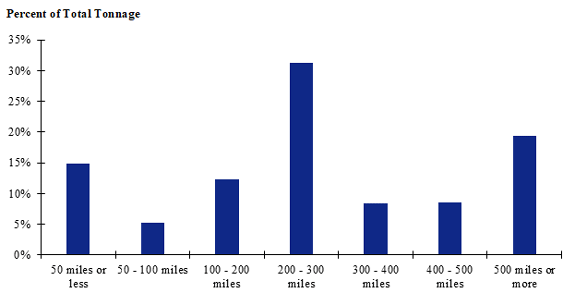 Figure 93. Bar chart. Distribution of shipment distances for hatchery-to-farm farm-based shipments of broilers for the Intermountain production-consumption zone.
(Source: Federal Highway Administration.)
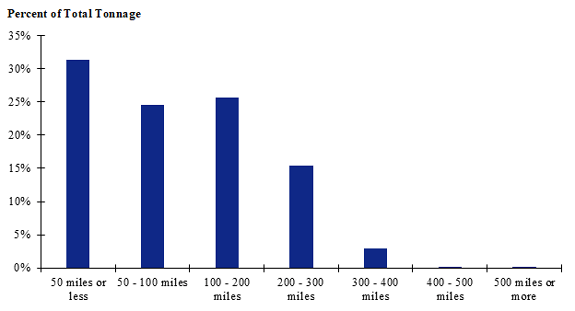 Figure 94. Bar chart. Distribution of shipment distances for hatchery-to-farm farm-based shipments of broilers for the Pacific Northwest production-consumption zone.
(Source: Federal Highway Administration.)
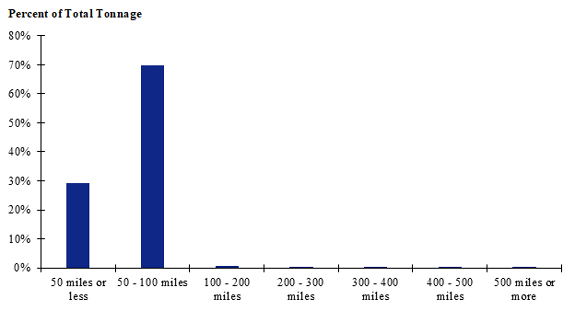 Figure 95. Bar chart. Distribution of shipment distances for hatchery-to-farm farm-based shipments of broilers for the California production-consumption zone.
(Source: Federal Highway Administration.)
Farm-to-Processing Movements
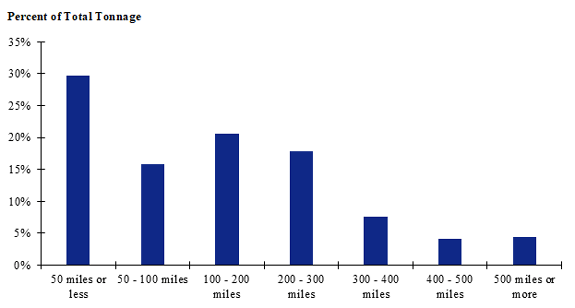 Figure 96. Bar chart. Distribution of shipment distances for farm-to-processing farm-based shipments of broilers for the Southeast production-consumption zone.
(Source: Federal Highway Administration.)
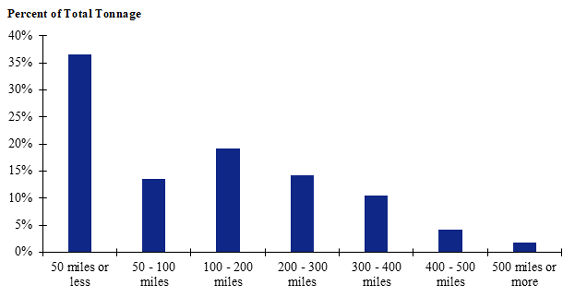 Figure 97. Bar chart. Distribution of shipment distances for farm-to-processing farm-based shipments of broilers for the South Central production-consumption zone.
(Source: Federal Highway Administration.)
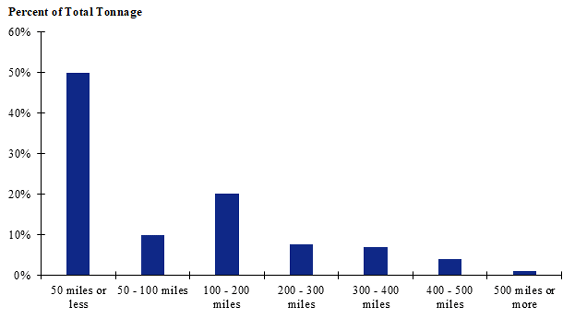 Figure 98. Bar chart. Distribution of shipment distances for farm-to-processing farm-based shipments of broilers for the Northeast production-consumption zone.
(Source: Federal Highway Administration.)
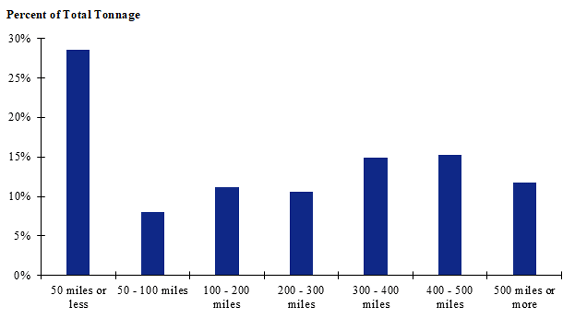 Figure 99. Bar chart. Distribution of shipment distances for farm-to-processing farm-based shipments of broilers for the North Central production-consumption zone.
(Source: Federal Highway Administration.)
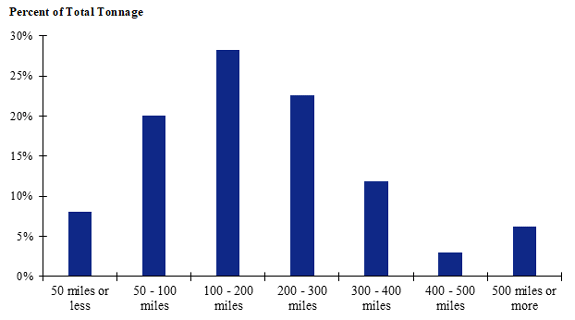 Figure 100. Bar chart. Distribution of shipment distances for farm-to-processing farm-based shipments of broilers for the Great Plains production-consumption zone.
(Source: Federal Highway Administration.)
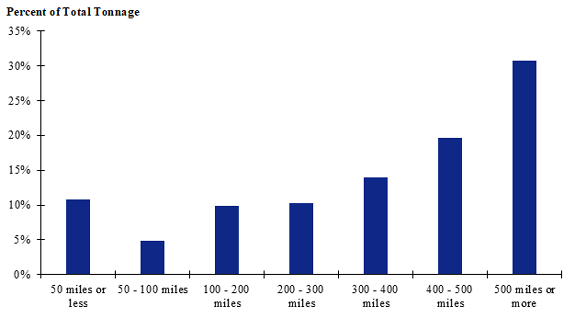 Figure 101. Bar chart. Distribution of shipment distances for farm-to-processing farm-based shipments of broilers for the Intermountain production-consumption zone.
(Source: Federal Highway Administration.)
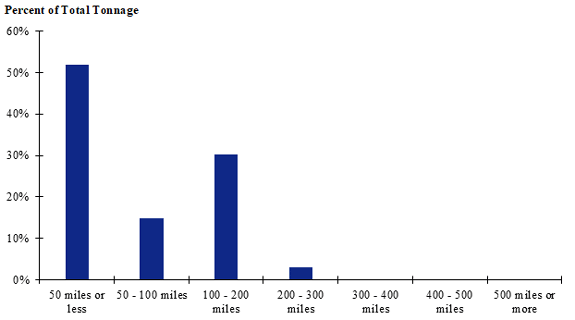 Figure 102. Bar chart. Distribution of shipment distances for farm-to-processing farm-based shipments of broilers for the Pacific Northwest production-consumption zone.
(Source: Federal Highway Administration.)
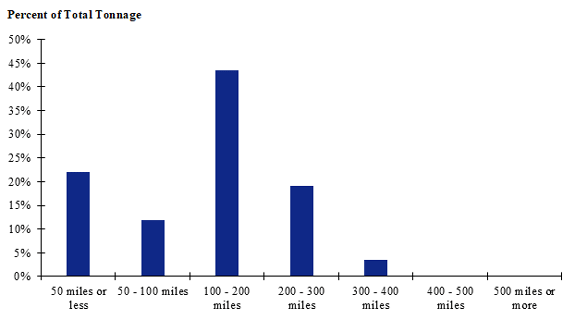 Figure 103. Bar chart. Distribution of shipment distances for farm-to-processing farm-based shipments of broilers for the California production-consumption zone.
(Source: Federal Highway Administration.)
Farm-Based Shipments of Pullets
Hatchery-to-Farm Movements
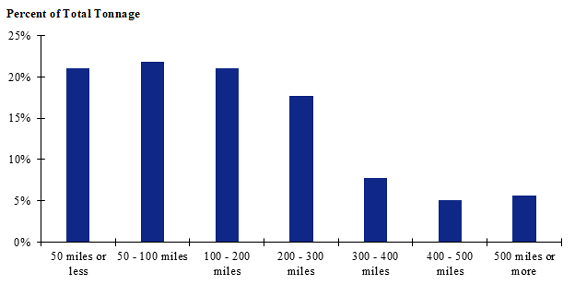 Figure 104. Bar chart. Distribution of shipment distances for hatchery-to-farm farm-based shipments of pullets for the Southeast production-consumption zone.
(Source: Federal Highway Administration.)
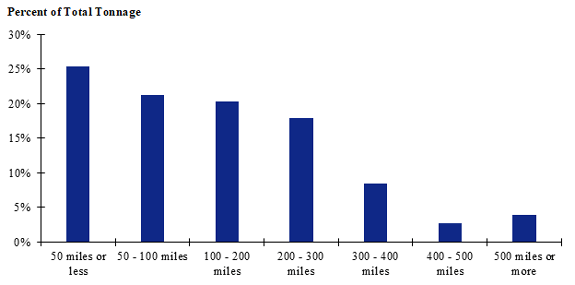 Figure 105. Bar chart. Distribution of shipment distances for hatchery-to-farm farm-based shipments of pullets for the South Central production-consumption zone.
(Source: Federal Highway Administration.)
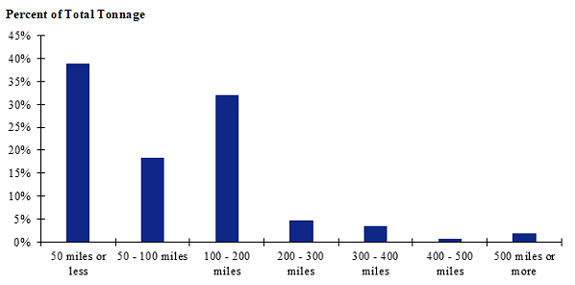 Figure 106. Bar chart. Distribution of shipment distances for hatchery-to-farm farm-based shipments of pullets for the Northeast production-consumption zone.
(Source: Federal Highway Administration.)
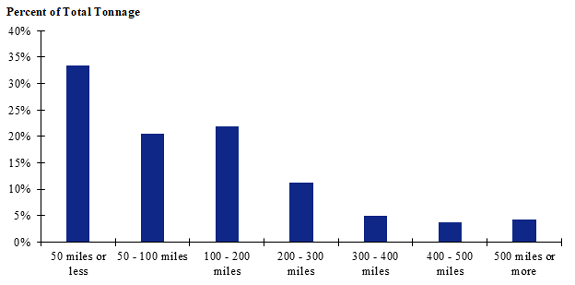 Figure 107. Bar chart. Distribution of shipment distances for hatchery-to-farm farm-based shipments of pullets for the North Central production-consumption zone.
(Source: Federal Highway Administration.)
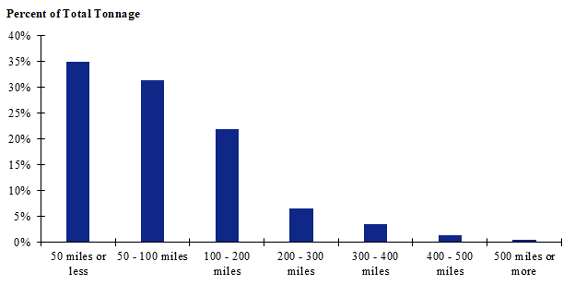 Figure 108. Bar chart. Distribution of shipment distances for hatchery-to-farm farm-based shipments of pullets for the Great Plains production-consumption zone.
(Source: Federal Highway Administration.)
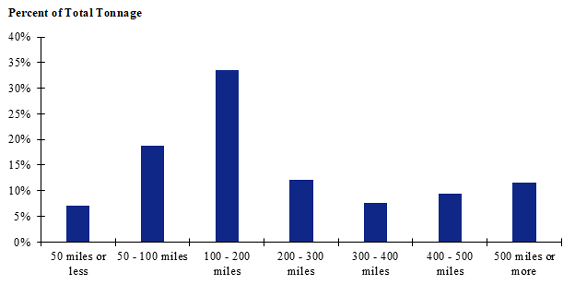 Figure 109. Bar chart. Distribution of shipment distances for hatchery-to-farm farm-based shipments of pullets for the Intermountain production-consumption zone.
(Source: Federal Highway Administration.)
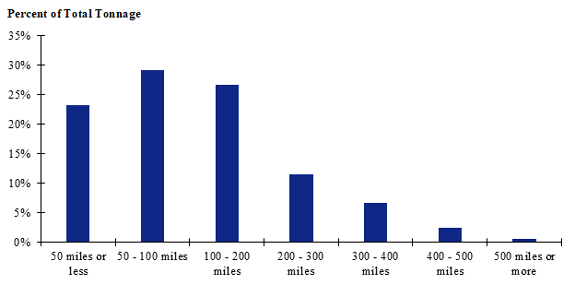 Figure 110. Bar chart. Distribution of shipment distances for hatchery-to-farm farm-based shipments of pullets for the Pacific Northwest production-consumption zone.
(Source: Federal Highway Administration.)
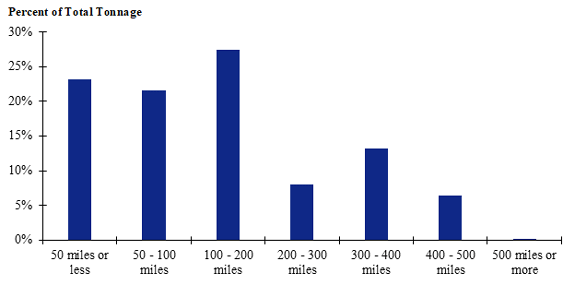 Figure 111. Bar chart. Distribution of shipment distances for hatchery-to-farm farm-based shipments of pullets for the California production-consumption zone.
(Source: Federal Highway Administration.)
Logs
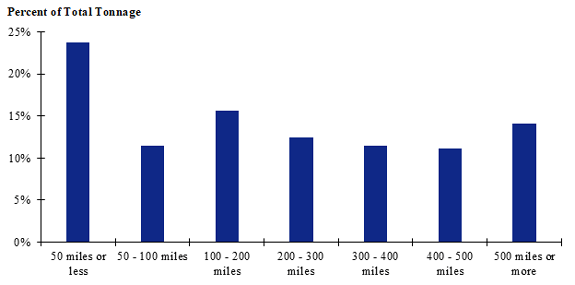 Figure 112. Bar chart. Distribution of shipment distances for logs for the Southeast production-consumption zone.
(Source: Federal Highway Administration.)
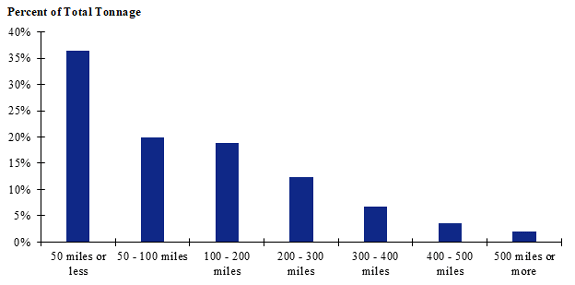 Figure 113. Bar chart. Distribution of shipment distances for logs for the South Central production-consumption zone.
(Source: Federal Highway Administration.)
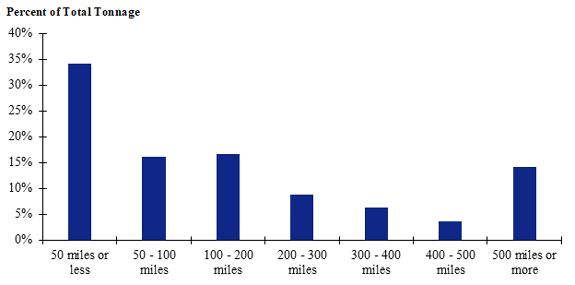 Figure 114. Bar chart. Distribution of shipment distances for logs for the Northeast production-consumption zone.
(Source: Federal Highway Administration.)
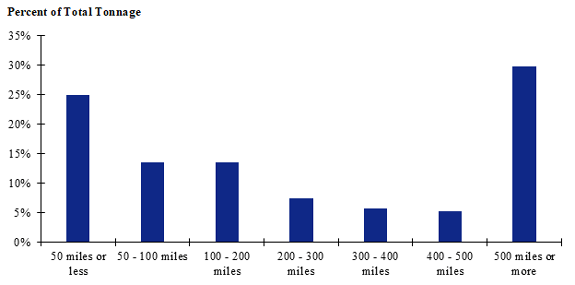 Figure 115. Bar chart. Distribution of shipment distances for logs for the North Central production-consumption zone.
(Source: Federal Highway Administration.)
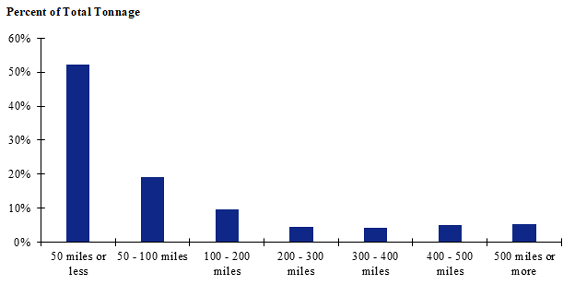 Figure 116. Bar chart. Distribution of shipment distances for logs for the Great Plains production-consumption zone.
(Source: Federal Highway Administration.)
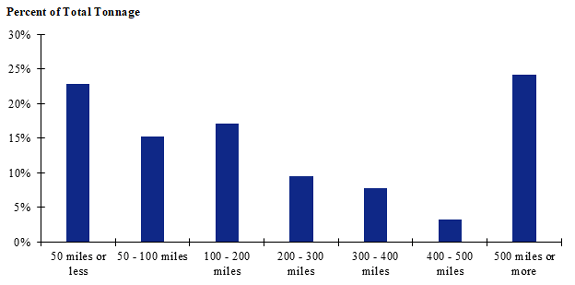 Figure 117. Bar chart. Distribution of shipment distances for logs for the Intermountain production-consumption zone.
(Source: Federal Highway Administration.)
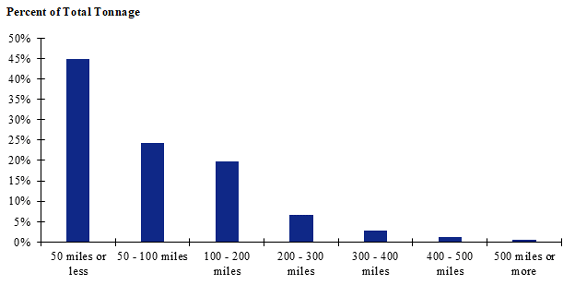 Figure 118. Bar chart. Distribution of shipment distances for logs for the Pacific Northwest production-consumption zone.
(Source: Federal Highway Administration.)
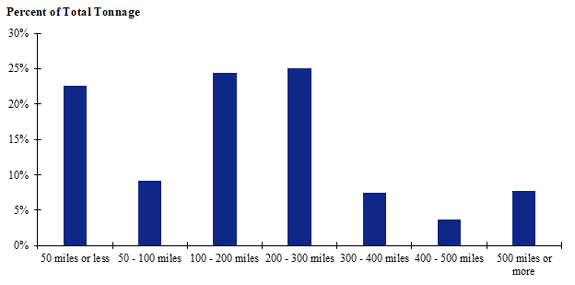 Figure 119. Bar chart. Distribution of shipment distances for logs for the California production-consumption zone.
(Source: Federal Highway Administration.)
Fish
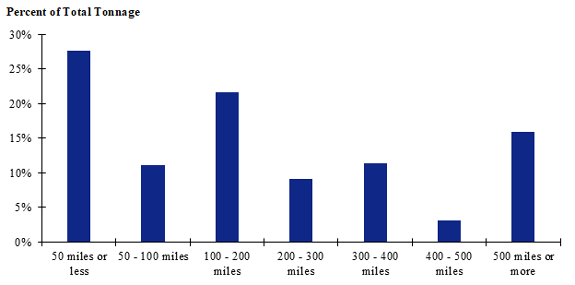 Figure 120. Distribution of shipment distances for fish in the Coastal Southeast production-consumption zone.
(Source: Federal Highway Administration.)
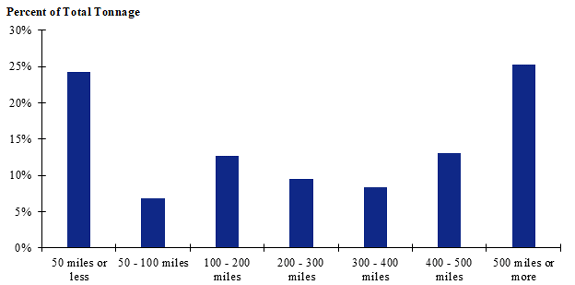 Figure 121. Bar chart. Distribution of shipment distances for fish in the Gulf Coast production-consumption zone.
(Source: Federal Highway Administration.)
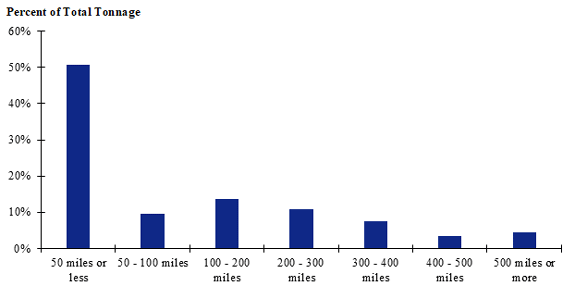 Figure 122. Bar chart. Distribution of shipment distances for fish in the Northeast production-consumption zone.
(Source: Federal Highway Administration.)
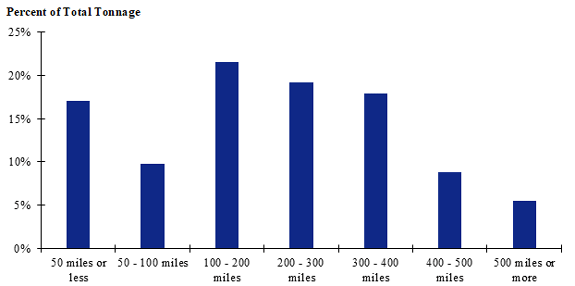 Figure 123. Bar chart. Distribution of shipment distances for fish in the Great Lakes production-consumption zone.
(Source: Federal Highway Administration.)
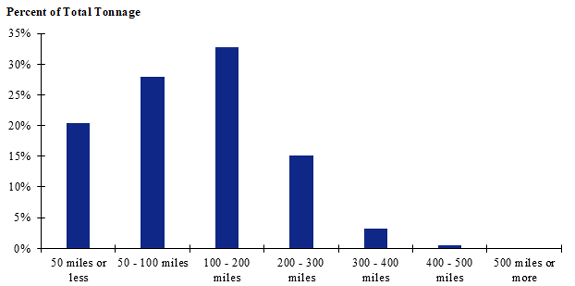 Figure 124. Bar chart. Distribution of shipment distances for fish in the Pacific Northwest production-consumption zone.
(Source: Federal Highway Administration.)
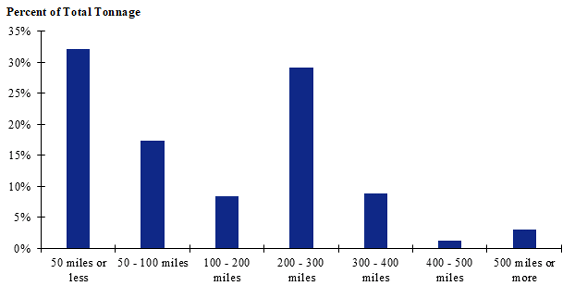 Figure 125. Bar chart. Distribution of shipment distances for fish in the California production-consumption zone.
(Source: Federal Highway Administration.)
|