Traffic Analysis Toolbox Volume III: Guidelines for Applying Traffic Microsimulation Modeling Software 2019 Update to the 2004 VersionChapter 1. Microsimulation Analysis PlanningMicrosimulation can provide a wealth of information; however, it can also be a very time-consuming and resource-intensive effort. It is critical that the manager effectively coordinate the microsimulation effort to ensure a cost-effective outcome to the study (Figure 2). The primary component of an effective management plan is the study scope, which defines the objectives, hypotheses, performance measures, scope, technical approach, and an estimate of resources required for the study. The topic of effective analytic planning and scoping is a complex topic addressed in several FHWA guidance documents. Guidance drawn from these documents are referenced throughout this chapter. This chapter presents the key components of an overall management approach for planning a cost-effective microsimulation analysis. 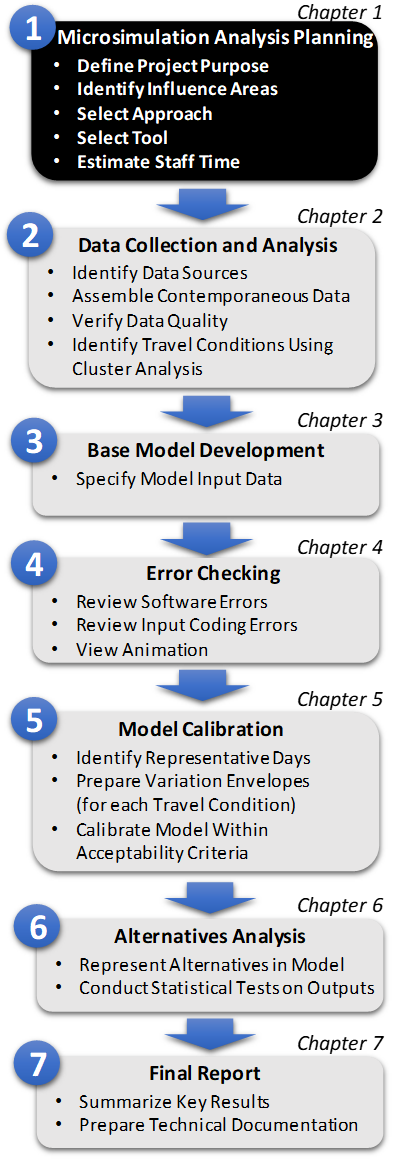
Figure 2. Diagram. Step 1: Microsimulation Analysis Planning Establish Project PurposeBefore embarking on any major analytical effort, it is critical to establish a clear objective of the analysis among stakeholders. An analytical effort that has unclear objectives can often lead to avoidable negative outcomes such as failure to meet schedule or budget targets, weak or inconclusive findings, and a general loss of credibility in microsimulation analysis among decision-makers. Ideas for analyses may arise from many potential sources. Competing concepts for new investments may require systematic analysis. Proposed changes to operational practice or system policy may warrant examination. Diagnostic analysis of system performance may reveal critical anomalies and potential mitigating actions. In each case there is an underlying hypothesis — that specific actions to be taken will result in improved system performance. It is useful to discuss ideas for analytical projects among the full range of stakeholders responsible for the performance of the transportation system as well as the stakeholders potentially impacted by the alternatives considered in the analysis. To capture the purpose of the project clearly and succinctly, a prospective analysis should have a well-defined statement of objectives. A limit of 50-75 words for this statement (including all objectives) can be helpful in crafting a focused analytical project. Study objectives should answer the following questions:
In some cases, there may be many competing ideas about how to improve the system, and multiple complementary concepts that together might be tested using microsimulation. The analyst can be helpful in leading stakeholders in crafting a statement of objectives that includes clearly identifying the alternatives to be considered. With some discussion, ideas often naturally group together into natural comprehensive solutions that can be represented and evaluated as alternatives within the analysis. Try to avoid broad, all-encompassing study objectives. They are difficult to achieve with the limited resources normally available and they do not help focus the analysis on the top-priority needs. A great deal of study resources can be saved if the manager and the analyst can identify upfront what will not be achieved by the analysis. The objectives for the analysis should be realistic, recognizing the resources and time that may be available for their achievement. The FHWA guidance document Scoping and Conducting Data-Driven 21st Century Transportation System Analyses [1] provides related guidance on integrating simulation analytics within an effective transportation systems management process. In the project conceptualization phase, a portfolio prioritization process is recommended that collects, integrates, and ranks project concepts to ensure that analytical resources are focused on the highest priorities. Select Key Performance MeasuresThe objectives of the analytical effort should align with the overarching goals of organizations that manage the transportation system. For example, as a part of a system-wide performance management plan, there may be a focus on improving productivity, personal mobility, system safety, or environmental impact (or all of the above). Just as it is not good practice to attempt to address a large number of objectives in a single analytical effort, it is also risky to attempt to examine a large number of performance measures within a single analysis. Simply put, as the number of key performance measures grows, the level of effort associated with the prospective effort grows exponentially. This exponential level of effort is related to the effort to obtain and analyze observed data for each measure, to calibrate simulation models to reflect each measure, to conduct an analysis of alternatives based on each measure, and to integrate each measure within an overall framework supporting decisionmaking. Performance measures identified for an analytical project should focus on what will differentiate the alternatives identified in the objectives statement. Since these measures will directly inform decision makers, they are a critical element to focus on early in the project planning step. Key questions to consider when selecting performance measures:
If the answer to any of these questions is no, then the performance measure should not be used. A well-defined analytical project should have at least one (and preferably multiple) key performance measure that meet these criteria. Define ScopeOnce the study objectives and performance measures have been identified, the next step is to identify the scope—both in terms of geographic and temporal limits. Several questions related to analytical scope should be considered:
The geographic and temporal scopes of a microsimulation model should be sufficient to completely encompass all of the traffic congestion present in the primary influence area of the project during the target analysis period (current or future). What degree of precision in system performance will be required to differentiate alternatives? Are hourly averages satisfactory? Will the impact of the alternatives be very similar or very different from those of the proposed project? How disaggregate an analysis is required? Is the analysis likely to produce a set of alternatives where the decision makers should choose between varying levels of congestion (as opposed to a situation where one or more alternatives eliminate congestion, while others do not)? The analyst should try to design the model to geographically and temporally encompass all resulting congestion to ensure that the model outputs provide a complete picture of impacts on system performance. However, given the extent of congestion in many urban areas and resource limitations, it may not always be possible to achieve this goal. If this goal cannot be achieved, then the analyst should attempt to encompass as much of the congestion as is feasible within the resource constraints and be prepared to estimate (by post-processing model outputs) to compensate for the portion of congestion not included in the model. Increasing the temporal simulation horizon may be helpful in projects where expanding geographic boundaries is highly impractical. The model study area should include areas that might be impacted by the proposed improvement strategies. For example, if an analysis is to be conducted of incident management strategies, the model study area should include the area impacted by the diverted traffic. All potentially impacted areas should be included in the model network. For example, if queues are identified in the network boundary areas, the analyst might need to extend the network further upstream. Develop the Analytical ApproachMicrosimulation takes more effort than macroscopic simulation, and macroscopic simulation takes more effort than HCM-type analyses. The analyst should employ only the level of effort required by the problem being studied. Microsimulation models are data- intensive. They should only be used when sufficient resources can be made available and less data-intensive approaches cannot yield satisfactory results. In some cases, a microsimulation can be used in combination with other tools in a multi-resolution modeling (MRM) approach. A compilation of MRM studies can be found in Traffic Analysis Toolbox Volume XIV [3]. MRM methods are relatively new and experimental in nature, and each application should be customized to the effort at hand. The guidance in this document is relevant to a microsimulation project performed in the absence of other tools or within a well-defined MRM effort. Microsimulations have critical analytical strengths to be brought to bear. Some notable cases where these strengths are particularly useful include:
Because they are sensitive to different vehicle performance characteristics and differing driver behavior characteristics, microsimulation models are useful for informing decision-makers on a wide range of potential investments, including:
The modern analyst has an increasingly wide selection of commercial microsimulation tools to consider for a particular analysis. Some of the key criteria to be considered in software selection are technical capabilities, input/output/interfaces, user training/support, and ongoing software enhancements. Traffic Analysis Toolbox Volume II [25] provides detailed guidance on the selection of an appropriate analytical approach that may include a microsimulation tool. Estimate Required ResourcesThe resource requirements for the development, calibration, and application of microsimulation models will vary according to the complexity of the project, its geographic scope, temporal scope, number of alternatives, and the availability and quality of the data. Adequate time should also be allotted to conduct a successful analysis. Data collection, coding, error checking, and calibration are the critical tasks for completing a calibrated model. The alternatives analysis cannot be started until the calibrated model has been reviewed and accepted. The FHWA guidance document Scoping and Conducting Data-Driven 21st Century Transportation System Analyses [2] provides a useful reference for the estimation of required resources to conduct simulation studies, including an interactive tool for the rough estimation of total hours (by experience level). Prepare a Preliminary Analysis PlanMuch of the management of a microsimulation study is the same as managing any other complex project: establish clear objectives, define a solid scope of work and schedule, monitor milestones, and review deliverables. One of the key attributes of project management includes documenting key assumptions early in the effort and socializing these assumptions with key stakeholders. The Analysis Plan should be updated as the project moves through the sequence of stages from planning to alternatives analysis. One key component of an Analysis Plan is a Methods and Assumptions document that summarizes key decision made between the simulation project management (e.g., the sponsoring agency and their staff) and the simulation analyst responsible for carrying out the project. The outline (or template) for how entries in the Methods and Assumptions document are expected be logged and described. Prior to moving to data collection and analysis, it is critical to document (and socialize) these key aspects of the proposed analysis discussed in this chapter in a first iteration of an Analysis Plan:
Example Problem: Alligator CityThe example problem is a complex corridor analysis in a hypothetical location (Alligator City). BackgroundOur example problem is set in Alligator City (Figure 3), a mid-sized hypothetical metropolitan area on the Gulf Coast. It has attributes combining three different Gulf Coast metro areas but is not intended to represent any specific location. Like most rapidly growing metropolitan areas, it has significant congestion and mobility issues. Figure 3 presents the major geographic features in the region. Okanahatchee County spans the majority of the region, which features two high-ground locations. The first, Alligator City itself, located on an oval-shaped high-ground location adjacent to a deep-water harbor where the Chattacola River enters the Gulf of Mexico. Surrounding Alligator City is a series of wetlands and swampy grounds that include the slow-moving and shallow Chattacola. Overland access from Alligator City has been built crossing the Chattacola to the west across the Great Gloomy Swamp. The Marine Causeway, Komodo Tunnel and Victory Island Bridge connect to the West Hills, the other high-ground location in the region. As the metro area has grown, much of the growth in the last 40 years has been in the West Hills, putting pressure on the limited capacity of the facilities crossing the swamps and wetlands on the east/west axis. The Victory Island Bridge is an aging, toll-free facility that is the oldest east-west crossing of the Chattacola. In the 1970s, the Komodo Tunnel was constructed to supplement the bridge. The tunnel has three tubes. The center tube is reversible and is used as a carpool HOV-3 facility eastbound in the morning hours and westbound in the afternoon hours. Tolls are collected only on the inbound tunnel tube (all day) primarily through electronic toll tags. AM peak period congestion is a key issue in the metropolitan area. Figure 3 highlights some of the locations of highest local concern about congestion. Egress from the bridge and tunnel are often made difficult by congestion on the arterial grid within Alligator City. Access to the Victory Island Bridge from the Marine Causeway traverses some of the oldest infrastructure in the region. Traffic in these sections breaks down frequently in narrow lanes and some sections are subject to flooding. Current congestion reduction programs include the use of the reversible tunnel tube for HOV and bus access. Bus and Carpool facilities have been established in the West Hills to encourage the use of the carpool lane(s). Traveler information is provided primarily through commercial radio broadcast. At least one local media outlet uses fixed-wing aircraft to observe traffic conditions to support regular traffic reports. Finally, since there is almost no access between the two cities and very limited right-of-way, the County maintains and deploys a fleet of incident management trucks that patrol the Marine. 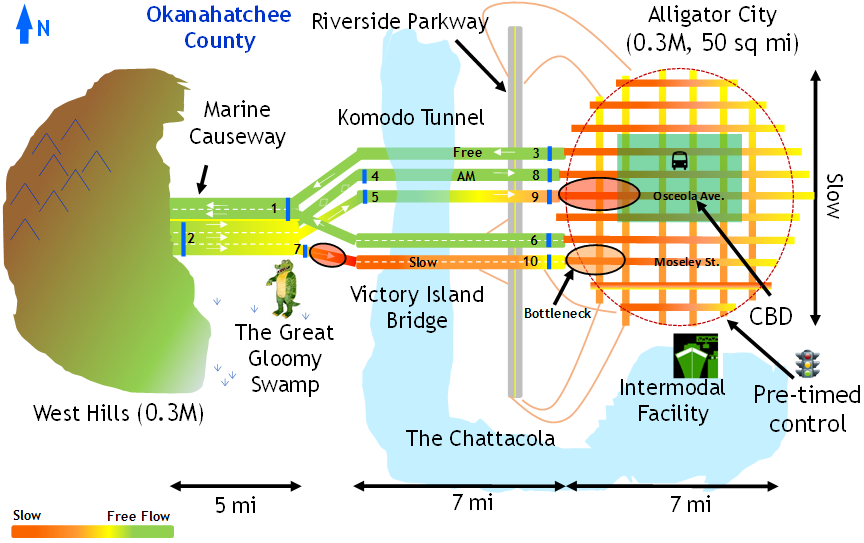
Figure 3. Map. Key Features of the Alligator City Example Problem Causeway and the Bridge to move and manage crashes and stalled vehicles. The tunnel authority operates a similar service within their jurisdiction. Collectively, the popular incident management program is known as CATTAIL (Congestion Alleviation Trucks Targeting Active Incident Locations). Consistent public and stakeholder complaints regard the increasingly unreliable commute between the West Hills and Alligator City. Wait times to exit the bridge and tunnel have grown steadily over the last decade. Non-recurrent delays associated with poor visibility, flooding and incidents receive both public and media attention. The movement of freight to and from the intermodal facility in Alligator City is complicated both by unreliable access across the Chattacola and increasing congestion within the Alligator City arterial grid. Potential actions in the region to alleviate congestion are complicated by multiple institutional factors. First, further expansion of facilities within the Great Gloomy Swamp and other marshlands in the County are no longer possible since its designation as a protected wetland. The reversible tube of the Komodo Tunnel is considered underutilized by some stakeholders as it is reserved for carpool and bus traffic only. There is building political pressure to open the tube up to general traffic but this is opposed by current transit and carpool users. Transportation in the region is a hot political issue and there is significant media attention. Differing blocs of stakeholders have proposed independent solutions to regional concerns. One alternative has been dubbed "Better Bridge and Tunnel". This alternative has three components. Current mitigation programs continue unchanged. First, comprehensive detection is established along the Victory Island Bridge access and bridge span. Variable Speed Limits (VSL) are implemented along this segment of the facility to harmonize speed and flow. In addition, the segments of the access road between the Marine Causeway and the bridge span will be re-striped to widen lanes and provide consistent markings along this critical stretch of older roadway. Underutilized carpool lanes in the AM will be converted to a High-Occupancy-Toll (HOT) facility. Vehicles not meeting the occupancy requirements can pay an extra time-variant fee and traverse the lane in the AM period. This opportunity is extended only to vehicles equipped with electronic toll tags. Another alternative has been dubbed "Adapt and Redirect". This alternative also has three components. Some current mitigation programs are augmented in this alternative. This alternative also includes the deployment of new detection capabilities, but this time to explicitly support estimation of travel times along the Marine Causeway, Komodo Tunnel, and Victory Island Bridge. This level of detection is different than the VSL-supporting deployment planned in the other alternative. Travel times estimated with data from the new detection system are provided to a new, large Variable Message Sign (VMS) erected over the Marine Causeway a short distance east of its western terminus in the inbound (eastbound) direction. Further, travel times are shared with commercial radio partners and provided via a new 511 telephone service. Selected intersections within the Alligator City arterial grid are upgraded to allow new controllers and the capability to adapt signal timings on the fly from an existing County operations center. Study ObjectivesA study objective statement of fewer than 75 words for this example: Support a pending decision on new investment to improve morning peak period east bound travel time reliability facilitating travel from West Hills to Alligator City, considering two competing alternatives. Alternative A implements adaptive signal timing, adds resources to incident management, and enhances traveler information. Alternative B implements managed lanes in the Komodo Tunnel, and deploys variable speed limits and some geometric improvements west of the Victory Island Bridge. Key Performance MeasuresTravel time (and travel time reliability) from West Hills to Alligator City along the two main routes (Komodo Tunnel and Victory Island Bridge). An existing system for estimating travel time on these facilities is in place, and travel time can be readily calculated from microsimulation outputs. Study ScopeThe geographic scope of the analysis comprises the corridor from West Hills to the Alligator City arterial grid. Much of the Alligator City Central Business District (CBD) should also be included in the influence area since congestion occurs within the arterial grid itself impacting the two main routes from the west. The temporal scope of the analysis regards the morning peak period, the exact timing of which will be determined after analyzing congestion onset and dissipation patterns when corridor data are further examined (Chapter 2). To differentiate the impact of the two alternatives, travel time profiles across the entire morning peak period at 15 minute intervals is required. Analytical ApproachThe complex alternatives include competing deployments of multiple ITS strategies, differences in lane-level control, and the need to accurately characterize congestion onset, duration, and intensity in the morning peak period. Given the requirement to model and differentiate these alternatives, a microsimulation approach is deemed superior to other analytical approaches. An existing microsimulation of the corridor will be updated and calibrated to support the alternatives analysis. Estimated ResourcesGiven the complex nature of the alternatives and the size of the network to be analyzed, a preliminary estimate indicates that 800 - 1,200 staff hours of effort may be required to conduct the analysis. Assessing data availability, current model capability, and other factors, a 15-month analysis period is estimated spanning data collection, model development and testing, calibration, alternatives analysis, and documentation. Key PointsIn summary, when planning a microsimulation study:
1 Dowling, R., Skabardonis, A., and Alexiadis, V. "Traffic Analysis Toolbox Volume III: Guidelines for Applying Traffic Microsimulation Modeling Software," FHWA-HRT-04-040, June 2004. [ Return to 1 ] 2 Wunderlich, K., Alexiadis, V., and Wang, P. "Scoping and Conducting Data-Driven 21st Century Transportation System Analyses," FHWA-HOP-16-072, May 2016. [ Return to 2 ] 3 Sloboden, J., Lewis, J., Alexiadis, V., Chiu, Y., and Nava, E. "Traffic Analysis Toolbox Volume XIV: Guidebook on the Utilization of Dynamic Traffic Assignment in Modeling," FHWA-HOP-13-015, November 2012. [ Return to 3 ] 25 Jeannotte, K., Chandra, A., Alexiadis, A., and Skabardonis, A. "Volume II: Decision Support Methodology for Selecting Traffic Analysis Tools," FHWA-HRT-04-039, June 2004. [ Return to 25 ] |
|
United States Department of Transportation - Federal Highway Administration |
||