Model Transportation Systems Management and Operations Deployments in Corridors and Subareas Primer
3. Model Subareas
This section portrays three example subareas based on fictional locations with unique geographic characteristics, motivators, and institutional capabilities that provide the backdrop for demonstrating how a package of transportation systems management and operations (TSMO) strategies can be planned and implemented to achieve a set of operations objectives.
MODEL SUBAREA 1 – NEIGHBORHOOD
Subarea 1 is a neighborhood within a large metropolitan area with a predominantly cull-de-sac street pattern as depicted in Figure 14.
The roadway network includes one principal arterial, several minor arterials and collectors, and one shared-use path for pedestrians and bicycles. The network provides access to mixed generation single- family residential areas, mixed-use residential/commercial areas (e.g., retail, local services, restaurants), primary and secondary schools, and several parks.
The city and local transit agency manage the transportation facilities and operations in Subarea 1. Transportation modes include automobiles, truck freight, local transit, bicycles, and pedestrians. On-street parking is provided throughout Subarea 1 to support the adjacent land uses. Truck freight includes a combination of large multi-axle and smaller six-tire vehicles making local deliveries throughout the community. Local transit includes local routes on the minor arterials and a frequent backbone bus route on the subarea's one principal arterial. Most of the roadways in Subarea 1 have sidewalks. Other than the shared-use path, bicycles typically travel in the automobile lanes or on the sidewalk.
The agencies managing and operating the transportation systems in Subarea 1 demonstrate the following institutional capabilities for implementing a TSMO program:
Business Processes – A multi-year TSMO plan and program exists at the regional level. Agencies are working towards targeted multi-jurisdictional business processes.
Systems and Technology – Operator-driven TSMO deployments have been implemented in parts of the subarea.
Performance Measurement – Some performance measurement of the system is regularly done but there is room for growth in this area.
Culture – Agencies within the subarea appreciate the value and role of TSMO.
Organization/Workforce – Agencies within the corridor, particularly the city, employ engineers with some TSMO skill sets, primarily those related to traffic signal operations.
Collaboration – Informal collaboration occurs on a somewhat regular basis between the transportation and public safety agencies within the subarea.
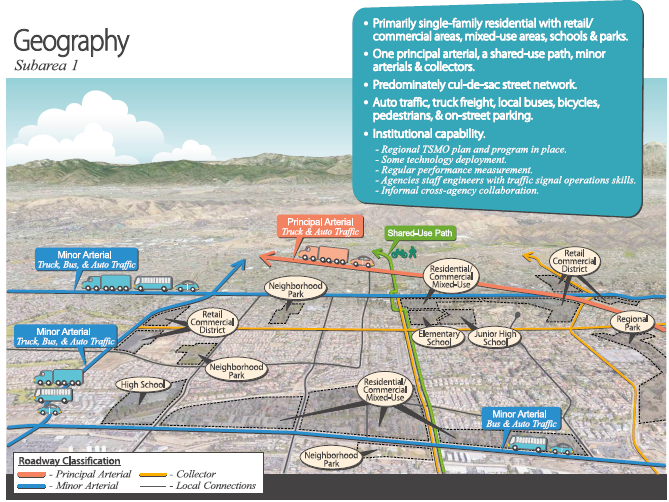
Figure 14. Illustration. Subarea 1 geography.
The motivators driving the need to implement TSMO strategies in Subarea 1 include:
- Capacity bottlenecks. The signalized intersections, particularly at locations where arterials or collectors intersect, are the key bottlenecks in Subarea 1. The intersection bottlenecks typically occur during the morning and evening peak commute periods and near the primary and secondary schools during morning arrival and afternoon dismissal. Roadway bottlenecks occur during school arrival and dismissal on the roadways adjacent to and near the schools. Roadway bottlenecks also occur in the evenings and on weekends adjacent to and near the commercial districts during the holiday shopping period from Thanksgiving to New Year's Day.
- Limitations to capacity expansion. The neighborhood has developed over many decades and land uses have been well established. This limits available right-of-way to expand capacity at bottleneck locations.
- Land use access. Few limitations have been placed on access to land uses within Subarea 1. Property frontages contain numerous driveways and arterial roadways have continuous two-way left turn lanes or traversable center lines, both of which can degrade safety and efficiency. Freight deliveries often block arterial travel lanes during peak periods.
Figure 15 depicts the key motivators occurring in the corridor that stakeholders are keen to address with TSMO strategies.
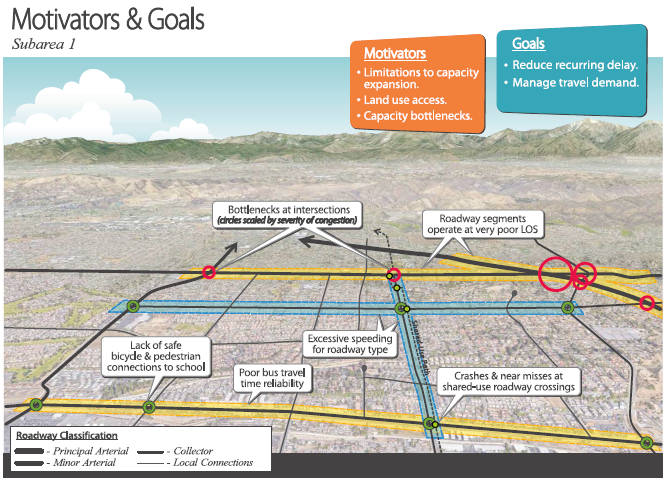
Figure 15. Illustration. Subarea 1 motivators and goals.
Key stakeholders—including transportation and land use planners, traffic engineers, and maintenance crews from the city and the transit agency—collaborate with the school district, park district, and business and neighborhood associations to establish a set of goals and SMART (specific, measurable, agreed upon, realistic, and time-bound) operations objectives that address the identified motivators and provide guidance for the selection of a package of TSMO strategies. The two goals and supporting operations objectives include:
Goal 1: Reduce recurring delay.
- Decrease the seconds of control delay per vehicle on corridor arterial roads by 15 percent within 5 years.
- Reduce the daily hours of recurring congestion on the arterial corridors by 15 percent within 5 years.
- Improve average on-time performance for Subarea 1 transit routes by 15 percent within 5 years.
Goal 2: Manage travel demand.
- Increase average pedestrian and bicyclist comfort level by 30 percent within 5 years.
- Increase the number of trips made by walking and bicycling by 20 percent over 5 years.
- Increase transit mode share by 20 percent within 5 years.
- Develop and provide travel option services to all residents with children in primary and secondary schools within 5 years.
Figure 16 shows how the two subarea goals and operations objectives established by the stakeholders connect to a set of TSMO program areas and strategies that reflect the community's constraints, motivations, and values.
For this neighborhood, the TSMO program areas that address capacity bottlenecks and land use access include:
- Traffic management and operations.
- Travel demand management.
- Public transportation management.
While each of these TSMO program areas have a discrete focus on different elements of managing and operating the transportation system. Figure 16 demonstrates how each of the strategies selected for this model subarea support multiple program areas. The result is a comprehensive approach to neighborhood multimodal traffic management.
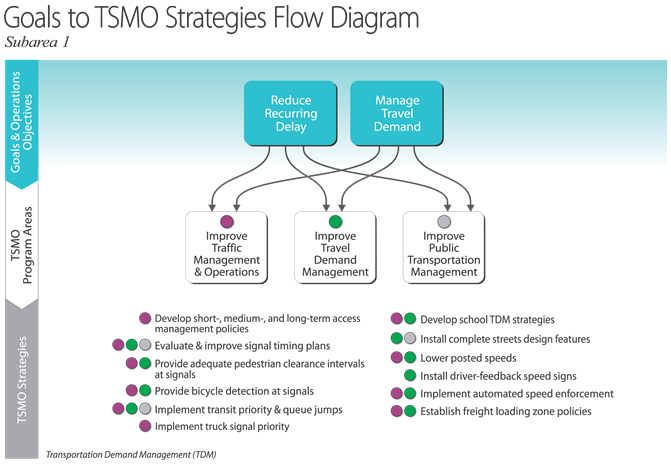
Figure 16. Diagram. Links between Subarea 1 goals and transportation systems management and operations strategies.
Subarea 1 stakeholders apply a scenario planning process that identifies alternative operating conditions tied to the unique combination of motivators and goals for the subarea. Using this approach, stakeholders narrow down a broad array of potential TSMO strategies to a subset that are further screened for feasibility, potential benefits, and cost impacts. The strategies that best fit Subarea 1 advance toward the implementation phase.
Figure 17 depicts the set of TSMO strategies selected by the Subarea 1 stakeholders. This neighborhood has a traffic signal system in place and the city has a traffic management workstation they use during regular business hours. The planning effort pulls together and augments these elements with new devices, communications, and activities to establish a focused TSMO approach to be advanced by the subarea's stakeholders.
The package of TSMO strategies selected for Subarea 1 include:
- Access management. Develop neighborhood policies and short-, medium-, and long-term strategies to manage land use access. These may include spacing standards, geometric standards, access removal or consolidation, curb-cut reductions, medians with well-placed openings, turn lanes, and circulation improvements (adjacent roadways and within private properties). Short-term strategies often target strategies that are amenable to current land and business owners whereas long-term strategies often target an ideal conceptual layout for if and when redevelopment occurs.
- Enhanced traffic signal operations. Signal timing can be fine-tuned to meet the travel demand needs of the neighborhood. This includes signal timing plans that favor a lower progression speed, more green time for approaches with reduced automobile travel lanes, turn pocket queue clearance, adequate pedestrian clearance intervals, bicycle detection, transit signal priority to support on-time transit performance, transit queue jumps, and truck traffic signal priority.
- School transportation demand management (TDM). Develop TDM strategies specific to each school such as staggered start and end times, evaluation of bus boundaries, walking school buses (e.g., adult-led group of children who walk from a nearby underutilized retail parking lot), and "school pool" (carpools and vanpools for school arrival and dismissal).
- Complete streets. Re-allocate existing right-of-way to support and encourage multiple modes. Strategies for Subarea 1 may include bus pull-outs, freight loading zones, comfortable bicycle and pedestrian facilities, and enhanced bicycle and pedestrian crossings (e.g., traffic signals, hybrid beacons, rapid rectangular flashing beacons, bicycle detection, bicycle boxes, multi-stage bicycle turns, and pedestrian scrambles).
- Travel speed reduction. Reducing travel speeds in neighborhoods supports access management and complete streets efforts. TSMO strategies to reduce travel speeds include lowering posted speed limits, driver-feedback speed advisory signs, automated speed enforcement, and signal timing plans that favor a lower progression speed. More traditional physical traffic calming strategies (e.g., roundabouts, curb bulb-outs) may also be used.
- Freight management. Develop and implement freight loading zone policies to reduce conflicts between freight and arterial roadway demands. Strategies may include suggested delivery times, designated freight loading zones (these may be curbside and shared with on-street parking with time-of-day/ day-of-week restrictions), enforcement of loading zones, and truck routing analysis to update truck routes in Subarea 1.
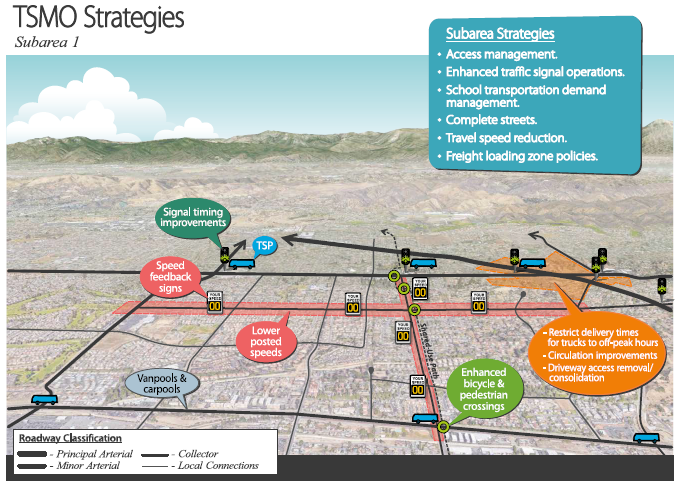
Figure 17. Illustration. Subarea 1 transportation systems management and operations strategies.
To realize an integrated deployment of the TSMO strategies, Subarea 1 local transportation agencies adjust their institutional capabilities under each of the following categories:
Business Processes
- Incorporate TSMO strategies into regional and agency long- range transportation plans. Coordinating the TSMO strategies with other regional or agency efforts helps align policies and goals and often helps develop project support and funding allocations.
- Develop life-cycle costs (total cost for procuring, installing, operating, and maintaining a system throughout its use) for TSMO strategies and incorporate these costs into regional and agency transportation programming.
- Use intelligent transportation system (ITS) standards for field devices and central systems to support interoperability between agencies and data sharing.
- Institute a schedule of preventative maintenance for field devices in the corridor.
- Develop an operations and maintenance manual to define procedures, roles, and responsibilities for new TSMO systems. For example, define what parameters (e.g., bus behind schedule) will trigger traffic signal priority activation.
Systems and Technology
- Optimally locate field devices to minimize power and communications costs, provide maintenance accessibility, and to use devices to support multiple strategies (e.g., detector locations that collect data for traffic signal operations, school TDM efforts, and freight management).
- Provide center-to-field interfaces to allow all device data to feed into systems at the city's traffic management workstation.
- Automate procedures to the extent possible. For example, develop pre-set holiday signal timing plans to depict the typical travel demand from Thanksgiving through the New Year that can be implemented yearly with minimal updates.
Performance Measurement
- Establish data sharing policies and an archive structure to facilitate easy data access.
- Share data with public and private partners to support traveler information. This allows the data to be used in a variety of formats (e.g., mobile device applications that show freight parking availability, school travel options, and real-time queues at traffic signals or schools).
- Measure performance of all the systems periodically and compare the performance to the corridor's operations objectives. Adjust the corridor strategies if needed. For example, if walking and bicycling trips do not appear to be on track for a 20 percent increase within 5 years, re-evaluate the school TDM and complete street strategies in use and try other strategies that may support the objective.
Culture
- Link TSMO program activities with transportation agencies' strategic plans.
- Hold regular meetings to ensure on-going dialogue on integrated management activities across transportation and transit agencies.
Organization/Workforce
- Train staff on operating and maintaining new systems (e.g., driver-feedback speed advisory signs). Consider contracting out some maintenance responsibilities if it is more cost- effective for specialty items that are not needed often (e.g., fiber optic cable maintenance, in particular splicing and emergency restoration).
- Compile a database of personnel and resources across organizational units in each agency responsible for TSMO activities.
Collaboration
- Develop working groups for TSMO strategies that require an expanded stakeholder set beyond the typical transportation and emergency stakeholders and meet regularly (e.g., quarterly, prior to a planned event such as a new school year or the start of holiday shopping). For example, a school TDM working group may include the city, neighborhood schools, school bus operators, and neighborhood associations. A freight management working group may include the city, the freight community, the local chamber of commerce, and business owners/operators with freight needs.
MODEL SUBAREA 2 – URBAN ACTIVITY CENTER
Subarea 2 is an activity center within a large metropolitan area as shown in Figure 18. The roadway network is a conventional grid that includes principal arterials (including one interstate), minor arterials, collectors, local streets, and a shared-use path for bicycles and pedestrians. Many of the roadways provide for one-way travel.
Subarea 2 is both an employment destination and a shopping destination for locals and tourists. The network primarily provides access to commercial properties that include retail, restaurants, and office space and to multi-story mixed-use residential and commercial developments.
A combination of State, city, and transit agencies operate and maintain the transportation facilities. The State department of transportation (DOT) district office maintains a 24/7 traffic management center (TMC).
Transportation modes include automobiles, truck freight, streetcar, buses, bicycles, and pedestrians. On-street parking is provided throughout Subarea 2 to support access to the adjacent land uses. Shared mobility is present in the form of transportation network companies. Truck freight travels through the area using the interstate but also makes many delivery trips within Subarea 2, particularly to the commercial sites. The streetcar provides connections to the regional transit network and the local bus line circulates within Subarea 2. Wide sidewalks that accommodate higher volumes of pedestrian traffic are present throughout Subarea 2. Bicycle lanes are limited and primarily consist of the shared-use path.
The agencies managing and operating the transportation systems in Subarea 2 demonstrate the following institutional capabilities for implementing a TSMO program:
Business Processes – Regional TSMO programming, development, and deployment processes are standardized system-wide and are well-documented.
Systems and Technology – Agencies use advanced technologies within the region but with a limited level of automation.
Performance Measurement – Agencies routinely identify desired outcomes and measure performance to improve strategy deployment and overall operations.
Culture – Agencies recognize TSMO as a core program that they regularly coordinate with other programs.
Organization/Workforce – Agencies within the corridor have in-house engineers and maintenance crews with TSMO skill sets.
Collaboration – Agencies collaborate on traffic management at a high level via regional stakeholder engagement and coordination.
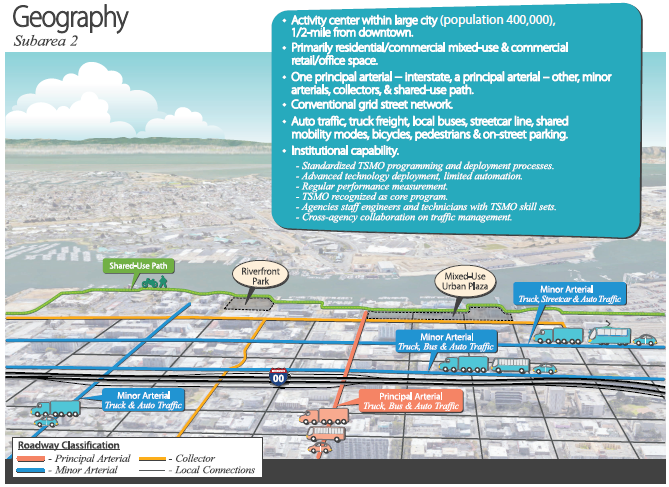
Figure 18. Illustration. Subarea 2 geography.
The motivators driving the need to implement TSMO strategies within Subarea 2:
- Congestion and limitations to capacity expansion. Subarea 2 is typically congested throughout the morning and evening peak periods and often on the weekends. Signalized intersections are the primary bottlenecks, often contributing to gridlock. The area is essentially built-out, which limits available right-of-way to expand capacity at bottleneck locations.
- Land-use access. Although Subarea 2 has ample parking (garages and some surface lots), automobiles and truck freight compete for on-street parking.
- High prevalence of crashes. A wide variety of crashes (involving vehicles, pedestrians, and bicycles) occur in Subarea 2 at intersections, driveways, and adjacent to on- street parking.
- Variability in trip reliability. Average trip time varies widely from day to day and can differ by as much as 35 minutes for the same time period.
- Financial constraints and priorities. Subarea 2 competes for funding with other regional programs and other similar activity centers within the region.
Figure 19 depicts the key motivators occurring in the corridor that stakeholders are keen to address with enhanced TSMO strategies.
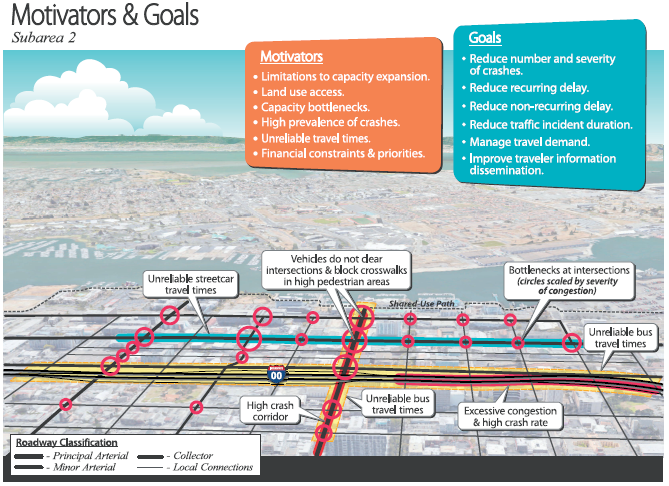
Figure 19. Illustration. Subarea 2 motivators and goals.
Key stakeholders including transportation and land use planners, traffic engineers, and maintenance crews from the State, city, and transit agencies collaborate with the area business and neighborhood associations, emergency responders, transportation network companies, and bicycle and pedestrian advocacy groups to establish goals and SMART operations objectives that address the identified motivators and provide guidance for the selection of a package of TSMO strategies. The six goals and supporting operations objectives include:
Goal 1: Reduce number and severity of crashes.
- Reduce the crash rate by 50 percent within 5 years.
Goal 2: Reduce recurring delay.
- Decrease the seconds of control delay per vehicle on subarea roads by 15 percent within 5 years.
- Reduce the daily hours of recurring congestion on subarea roads by 20 percent within 5 years.
Goal 3: Reduce non-recurring delay.
- Reduce the variability of travel times by 15 percent during peak and off-peak periods within 5 years.
- Decrease average freight point-to-point travel times within Subarea 2 by 15 percent within 3 years.
- Improve average on-time performance for Subarea 2 transit routes by 15 percent within 5 years.
Goal 4: Reduce traffic incident duration.
- Reduce mean incident clearance time per incident by 15 percent over 5 years.
Goal 5: Manage travel demand.
- Develop and provide travel option services to all Subarea 2 stakeholder audiences within 5 years.
Goal 6: Improve traveler information dissemination.
- Increase customer satisfaction ratings for timeliness, accuracy, and usefulness of traveler information in Subarea 2 by 50 percent within 5 years.
Figure 20 depicts how the six subarea goals and operations objectives established by the stakeholders connect to a set of TSMO program areas and strategies that reflect the identified constraints, motivations, and values for Subarea 2.
For this urban activity center, the TSMO program areas that address capacity bottlenecks and land use access include:
- Traveler information.
- Traffic management and operations.
- Traffic incident management.
- Travel demand management.
- Public transportation management.
While each of these TSMO program areas have a discrete focus on different elements of managing and operating the transportation system, Figure 20 demonstrates how each of the strategies selected for this model corridor support multiple program areas. The result is a comprehensive approach to multimodal transportation management.
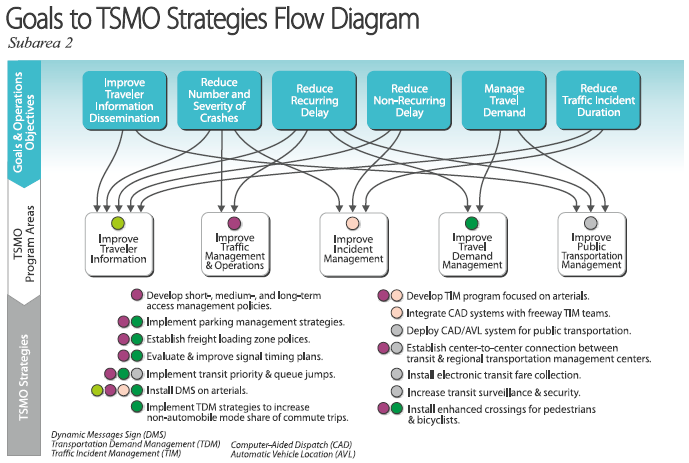
Figure 20. Diagram. Links between Subarea 2 goals and transportation systems management and operations strategies.
Subarea 2 stakeholders apply a scenario planning process that identifies alternative operating conditions tied to the unique combination of motivators and goals for the subarea. Using this approach, stakeholders narrow down a broad array of potential TSMO strategies to a subset that are further screened for feasibility, potential benefits, and cost impacts. The strategies that best fit Subarea 2 advance toward the implementation phase.
Figure 21 depicts the set of TSMO strategies selected by the subarea's stakeholders. The relative sophistication of transportation services in this subarea along with the high degree of institutional capability provide a solid foundation for implementing an advanced program of TSMO strategies. The planning effort pulls together and augments these elements with new devices, communications, and activities to establish a focused TSMO approach to be championed and implemented by the subarea's stakeholders.
The package of TSMO strategies for Subarea 2 include:
- Access management. Develop policies and strategies to manage land use access. Strategies for an activity center may include turn lanes, circulation improvements (public right-of- way and private properties), and parking and freight strategies described below.
- Parking management. To better manage on-street and off-street parking in Subarea 2, strategies may include shared- use parking, incentives to use under-utilized parking facilities, and electronic payment systems.
- Freight management. Develop and implement freight loading zone policies to reduce conflicts between freight and motor vehicle demands. Strategies may include suggested delivery times, designated freight loading zones (these may be curbside and shared with on-street parking with time-of-day/ day-of-week restrictions), enforcement of loading zones, and electronic payment systems for freight parking.
- Enhanced traffic signal operations. Signal timing can be fine-tuned to meet the travel demand needs of the activity center. This includes signal timing plans that provide progression to and from the freeway, balance demand on the grid network, use coordinated or adaptive signal control, provide streetcar preemption or bus transit signal priority, accommodate transit queue jumps, and provide longer yellow times for vehicles to clear intersections and not block crosswalks.
- Traffic incident management (TIM). With existing institutional capability, TIM teams already focus on the region's freeways. Develop a city TIM program focused on arterials within Subarea 2 and integrate computer-aided dispatch (CAD) systems with freeway TIM teams.
- Public transportation management. Strategies may include advanced transit operations management (e.g., CAD/ automated vehicle location (AVL) systems), center-to-center connection with the regional transportation management center, electronic fare collection, and transit surveillance and security.
- Enhanced crossings for pedestrians and bicycles. Improve visibility of pedestrians and bicycles at intersections and driveways using signing, pavement markings, and detection to activate signals or warning systems (e.g., electronic signs on driveway exits, particularly where sight distance is limited).
- Traveler information. Expand traveler information systems to include dynamic route choice (e.g., dynamic message signs (DMS) on arterials about travel times on key routes), dynamic on-ramp information, multimodal trip planning, real-time transit arrival information, real-time on- and off-street parking availability and making agency data available to third-party data providers in standardized format.
- Transportation demand management. Use TDM strategies to reduce commute trips. Subarea 2 strategies may include employer programs and commuter incentives, route planning tools, and traveler information marketing campaigns.
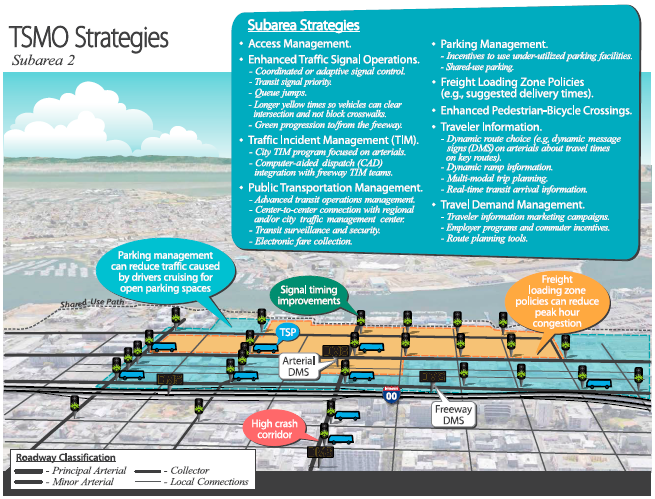
Figure 21. Illustration. Subarea 2 transportation systems management and operations strategies.
To realize an integrated deployment of the TSMO strategies, Subarea 2 transportation agencies adjust their institutional capabilities under each of the following categories:
Business Processes
- Continue to incorporate TSMO strategies into agency and regional long-range transportation plans. Coordinating TSMO strategies with other regional or agency efforts helps align policies and goals. It can also increase project support and funding allocations.
- Continue to develop life-cycle costs (total cost for procuring, installing, operating, and maintaining a system throughout its use) for TSMO strategies and incorporate these costs into regional and agency transportation programming.
- Use ITS standards for new field devices and central systems to support interoperability between agencies and to support data sharing.
- Institute a schedule of preventative maintenance for new field devices in the subarea.
- Develop maintenance agreements with city if needed for the State DOT to maintain and operate ITS devices on city roadways such as cameras, detectors, or traffic signals.
- Develop standard operating procedures (SOPs) to define procedures, roles, and responsibilities for new TSMO systems. The SOPs may be incorporated into existing operations and maintenance manuals (e.g., transit agency operations manual) or a new regional manual may need to be developed (e.g., regional traveler information SOP manual).
- Develop agreements, if needed, for the city or State DOT to operate the other agency's traffic signals if tied into the same coordinated timing system. Depending on staffing, the city may operate the signals during their standard business hours and the State DOT may operate them after hours if there is an unexpected system outage or change in travel demand due to a crash or special event.
Systems and Technology
- Optimally locate field devices to minimize power and communications costs, provide maintenance accessibility, and use devices to support multiple strategies (e.g., camera and detector locations that support TIM, TDM decisions, and freight management).
- Provide center-to-field interfaces to allow all device data to feed into systems at the State or city traffic management center. Update center-to-center interfaces as needed (e.g., allow both city and State to update messages on arterial DMS based on pre-defined SOPs).
- Automate procedures to the extent possible. For example, develop volume thresholds to determine what travel time messages to post to traveler information systems.
Performance Measurement
- Update data sharing policies and archive structure to accommodate easy data access for new stakeholders (e.g., freight community for freight loading zone strategies).
- Continue to share data with public and private partners to support traveler information. This allows the data to be used in a variety of formats (e.g., mobile device applications provide parking or freight loading wayfinding, neighborhood travel options, electronic parking, or transit payment).
- Measure performance of all the systems periodically and compare the performance to the subarea's operations objectives. Adjust the subarea strategies if needed. For example, if average freight point-to-point travel times within Subarea 2 do not appear to be on track for a 15 percent reduction within 3 years, re-evaluate the freight management strategies in use and try other strategies that may support the objective.
Culture
- Continue to link TSMO program activities with transportation agencies' strategic plans. Use service-related cost-effectiveness to compare TSMO program to other transportation programs to justify the expansion of the TSMO program.
- Continue to hold regular meetings to ensure on-going dialogue on integrated management activities across transportation and emergency response agencies. Include additional stakeholders as needed.
Organization/Workforce
- Train staff on operating and maintaining new systems (e.g., electronic payment systems).
- Update database of personnel and resources across organizational units in each agency responsible for TSMO activities.
- Develop a TSMO management and organizational structure within key agencies (e.g., State DOT and city) equivalent to that of other major agency programs.
Collaboration
- Continue to participate in TIM teams (emergency responders and State DOT) by meeting regularly to conduct joint training, tabletop exercises, and major incident debriefs. Expand participants to include arterial stakeholders such as the city, subarea businesses, and freight distribution centers.
- Develop working groups for TSMO strategies that require an expanded stakeholder set beyond the typical transportation and emergency stakeholders. For example, a parking management working group may include private and public parking facility operators and transit agencies that operate park and ride lots. Meet on a routine basis to determine the effectiveness of the strategies and make updates as needed.
MODEL SUBAREA 3 – URBAN SUB-REGION
Subarea 3 covers a large sub-region within a metropolitan area of approximately 200,000 people. The roadway network is a mix of conventional grid and curvilinear loops and includes multiple interstates, other principal arterials, minor arterials, collectors, and a regional shared-use path for bicycles and pedestrians as shown in Figure 22. Land use in Subarea 3 is predominantly residential interspersed with major activity centers, including a downtown mixed-use district, a regional retail district, industrial centers, an international airport, a large university campus, a theater district, and a regional park. The downtown and retail districts also include residential/commercial mixed use.
City, county, State, and transit agencies manage the transportation facilities in Subarea 3. A metropolitan planning organization (MPO) supports regional planning, programming, and collaboration. A consortium of regional transportation agencies support a 24/7 TMC.
Transportation modes include automobile, truck freight, heavy passenger and freight rail, light rail, streetcar, local buses, bicycles, pedestrians, and shared mobility services for cars and bicycles. On-street parking is prevalent throughout the subarea, but the activity centers also include off-street parking facilities. Truck and rail freight travel through the region but have a heavy presence in the industrial centers. Truck freight also makes local delivery trips. A passenger rail line connects the sub-region to neighboring cities. Light rail, streetcar, and bus routes provide transit connections across the region. Sidewalks are generally provided throughout the sub-region, and some on-street bicycle lanes are provided in addition to the regional shared-use path.
This subarea has a "Vision Zero" policy; the purpose of which is to achieve zero fatalities. The community has embraced and instituted strategies like greater enforcement, blanket speed limit reductions, driver education, and traffic calming.
The agencies managing and operating the transportation system in Subarea 3 demonstrate the following institutional capabilities for implementing a TSMO program:
Business Processes – TSMO development and deployment processes are standardized system-wide but need more integration of formal procedures across agencies.
Systems and Technology – Within the sub-region, agencies use advanced technologies, some with advanced automation.
Performance Measurement – Agencies routinely identify desired outcomes and measure performance to improve strategy deployment and overall operations.
Culture – Agencies recognize TSMO as a core program and are working toward making the case for it based on cost-effectiveness.
Organization/Workforce – Agencies within the corridor have in-house engineers and maintenance crews with TSMO skill sets or they share resources across agencies.
Collaboration – Agencies collaborate on TSMO via regional stakeholder engagement and are working towards negotiating region-wide roles and responsibilities.
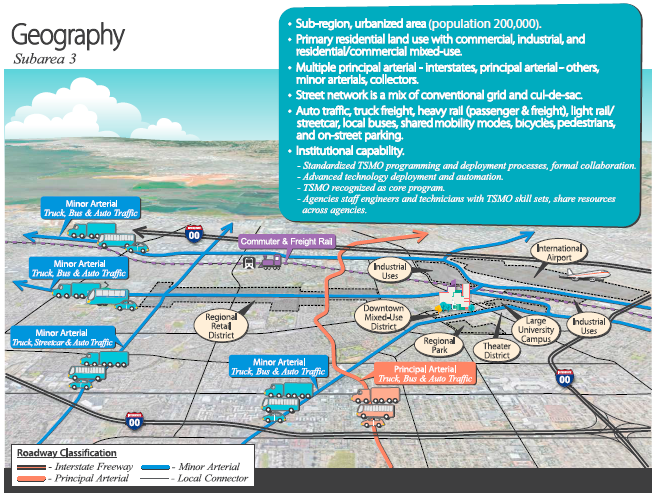
Figure 22. Illustration. Subarea 3 geography.
Figure 23 depicts the motivators driving the need to implement TSMO strategies in Subarea 3:
- Adverse environmental issues. Subarea 3 is located within a non-attainment area where air pollution levels persistently exceed standards for ozone and particulate pollution. The industrial centers in Subarea 3 contribute to the city's non-attainment.
- Congestion and limitations to capacity expansion. Congestion occurs throughout Subarea 3 during the morning and evening peak periods. Additional congestion occurs at some of the activity centers, including weekend congestion at the retail and downtown districts. Limited right-of-way is available to expand capacity at bottleneck locations.
- Land-use access. Automobile traffic competes for coveted on-street parking spots in the activity centers despite the availability of parking garages and surface lots.
- Development pattern changes. Development has occurred rapidly and the pattern has altered travel demand, particularly route choice and time of day, causing additional unplanned congestion.
- High reliance on single-occupancy vehicles. Transit options notwithstanding, residents in Subarea 3 rely heavily on single-occupancy vehicles for most trips, taxing roadway capacity, especially the routes into and out of the core downtown area.
- High prevalence of crashes. Many crashes occur throughout Subarea 3 including rear-end crashes on freeways and arterials due to standing queues; turning movement crashes at congested signalized intersections; and crashes adjacent to on-street parking spots.
- Special event congestion. The theater district holds events year-round that sometimes coincide with and add to the congestion of the weekday evening commute. Many events are held at the regional park that require roadway closures on the weekend.
- Variability in trip reliability. Average trip time varies widely from day to day (up to a 50 minute difference), not only during the peak periods but also on weekday afternoons and weekends.
- Financial constraints and priorities. Subarea 3 is located within a large MPO and competes for funding with other cities of similar and larger sizes with similar transportation issues.
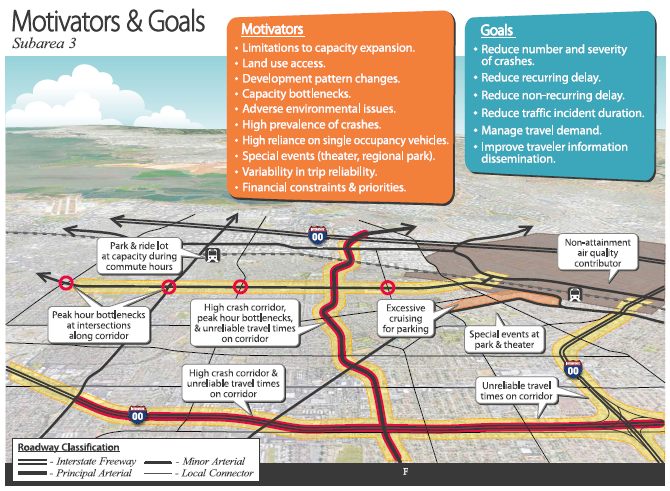
Figure 23. Illustration. Subarea 3 motivators and goals.
Key stakeholders—including transportation and land-use planners, traffic engineers, and maintenance crews from the city, county, State transit agencies and metropolitan planning organization (MPO)—collaborate with the area business and neighborhood associations, key employers, freight haulers, emergency responders, transportation network companies, parking management companies, and bicycle and pedestrian advocacy groups to establish a set of goals and SMART operations objectives that address the identified motivators and provide guidance for advancing a package of TSMO strategies. The six goals and supporting operations objectives include:
Goal 1: Reduce number and severity of crashes.
- End traffic fatalities and severe injuries within 5 years.
Goal 2: Reduce recurring delay.
- Decrease the seconds of control delay per vehicle on corridor arterial roads by 15 percent within 5 years.
- Reduce the daily hours of recurring congestion on the freeway and arterial corridors by 15 percent within 5 years.
- Reduce excess fuel consumed due to congestion by 25 percent within 5 years.
Goal 3: Reduce non-recurring delay.
- Reduce the person hours of non-recurring delay associated with incidents by 10 percent within 5 years.
- Reduce average travel time into and out of the theater district by 15 percent within 5 years.
- Decrease the percent of special event attendees traveling to the event in single-occupancy vehicles by 25 percent within 5 years.
- Decrease average freight point-to-point travel times through Subarea 3 by 10 minutes within 3 years.
- Reduce the variability of travel time on Subarea 3 routes by 15 percent during peak and off-peak periods within 5 years.
- Improve average on-time performance for Subarea 3 transit routes by 15 percent within 5 years.
Goal 4: Reduce traffic incident duration.
- Reduce mean time for needed responders to arrive on-scene after notification by 15 percent over 5 years.
- Reduce mean incident clearance time per incident by 15 percent over 5 years.
Goal 5: Manage travel demand.
- Increase average pedestrian and bicyclist comfort level by 30 percent within 5 years.
- Decrease single-occupancy vehicle trips by 30 percent within 5 years.
- Develop and provide travel option services to all Subarea 3 communities and stakeholders within 5 years.
Goal 6: Improve traveler information dissemination.
- Increase customer satisfaction ratings for timeliness, accuracy, and usefulness of traveler information in Subarea 3 by 50 percent within 5 years.
Figure 24 depicts how the six subarea goals and operations objectives established by the stakeholders connect to a set of TSMO program areas and strategies that reflect the identified constraints, motivations, and values for Subarea 3.
For this urban sub-region, the TSMO program areas that address local capacity bottlenecks and land-use access include:
- Traveler information.
- Traffic management and operations.
- Traffic incident management.
- Travel demand management.
- Special events management.
- Public transportation management.
While these TSMO program areas have discrete focus on different elements of managing and operating the transportation system, Figure 24 demonstrates how each of the strategies selected for this model subarea support multiple program areas. The result is a comprehensive approach to multimodal transportation management.
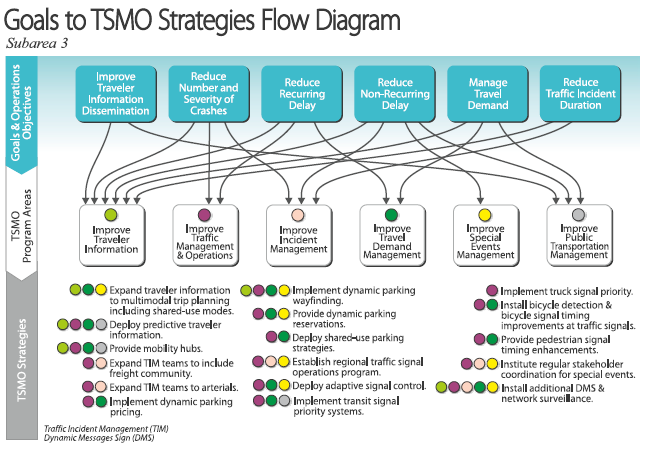
Figure 20. Diagram. Links between Subarea 3 goals and transportation systems management and operations strategies.
Subarea 3 stakeholders apply a scenario planning process that identifies alternative operating conditions tied to the unique combination of motivators and goals for the subarea. Using this approach, stakeholders narrow down a broad array of potential TSMO strategies to a subset that are further screened for feasibility, potential benefits, and cost impacts. The strategies that best fit Subarea 3 advance toward the implementation phase.
Figure 25 depicts the set of TSMO strategies selected by the subarea's stakeholders. The sophistication and maturity of transportation services in this subarea, along with a high degree of institutional capability, provide a solid foundation for implementing an advanced program of TSMO strategies. The planning effort pulls together and augments these elements with new devices, communications, and activities to establish a focused TSMO approach to be championed and implemented by the subarea's stakeholders.
Like Corridor 3, the stakeholders in Subarea 3 recognize an opportunity to apply an integrated corridor management (ICM) approach to coordinate responses between multiple owners/operators of facilities and modes in the subarea. ICM can play an important role in managing incidents, planned special events, adverse weather, and work zones by establishing coordinated response protocols. Any combination of the TSMO strategies identified for advancement in Subarea 3 can be used within an ICM process.
The package of TSMO strategies for Subarea 3 include:
- Mobility hubs including options for shared mobility. Shared use mobility is changing the way people travel, especially in large metropolitan areas. Strategies for Subarea 3 include mobility hubs that integrate modes at key transfer points such as activity centers or last-mile connections. A hub may include transit connections, transportation network company waiting/loading areas, shared-use parking, and a bicycle sharing station all in one location for easier transfers and a larger mode choice. See FHWA's Shared Mobility: Current Practices and Guiding Principles for more shared mobility ideas.12
- Traffic signal operations. Due to the many agencies that operate within the subarea, a regional traffic signal coordination program can help seamlessly operate traffic signals across jurisdictional boundaries. Adaptive signal control may also be considered where travel demand patterns fluctuate unpredictably. Light rail/streetcar preemption and transit signal priority for the buses can help the transit routes maintain schedule performance and reduce transit trip variability. Truck signal priority, or green light extension, can help keep truck freight and the traffic behind them moving on truck routes. Bicycle travel at signals can be enhanced with detection, separate phases, bicycle-specific passage time, bicycle boxes, and staged turn movements. Pedestrian travel at signals can be enhanced with countdown timers and phasing to reduce automobile-pedestrian conflicts.
- Traffic incident management. With a high level of institutional capability, TIM teams and dedicated service patrols already provide TIM services in Subarea 3. The agencies can further optimize these practices by expanding TIM teams to include the freight community, expanding TIM services to arterials, or adding strategies such as staged or dry run towing.
- Active parking management (APM). Active management of parking facilities (on- and off-street) can help optimize the utilization of those facilities while influencing travel behavior at various stages along the trip making process. Several strategies may be considered for Subarea 3: dynamic parking pricing adjusts prices based on demand such as reduced prices at under-utilized facilities, dynamic parking wayfinding provides space availability by location, dynamic parking reservations allows users to reserve available parking spaces in advance, and shared-use parking uses time-of-day strategies such as leasing residential parking to commuters.
- Dynamic route choice. This active traffic management strategy provides alternate route information, including parallel transit options, based on real-time information about congestion along with a traveler's current route.
- Special event management. Apply coordinated operations strategies to inform the traveling public about travel conditions, monitor changing travel conditions, and manage travel demand associated with each planned special event. Regular stakeholder coordination, including pre- and post- event for larger events, is key for year-round management of events. Coordination should include planning for multi- modal routes, event access, and traffic control and address stakeholder roles and responsibilities. Subarea 3 uses many techniques today (e.g., police directing traffic at signalized intersections), but these could be automated or improved upon using other TSMO strategies described for this subarea, such as APM, enhanced signal timing operations, and traveler information.
- Transportation demand management. Use TDM strategies to reduce commute, retail, and special event trips to influence travel choice related to mode, time, location, or route. TDM strategies for Subarea 3 may include subsidies for transit passes and carpool/vanpool programs, trip reduction programs (in partnership with employers, the university, theater district, and special event operators), ride-matching services, automobile-free or access-restricted zones, and many of the strategies (particularly active demand management and APM) described in this section.
- Traveler information. Although Subarea 3 has a traveler information system in place, it primarily addresses the automobile and transit networks. Expand this system to include integrated multi-modal trip planning that considers public and private modes such as private bicycle sharing systems and transportation network companies. Develop predictive algorithm applications to generate travel forecasts based on both archived and real-time data. Disseminate forecasted conditions to the traveling public. Develop public- private partnerships for open data sharing and interoperability to support publicly or privately developed mobile device applications that help influence travel behavior. Common applications impacting transportation include mobility, vehicle connectivity, smart parking, and courier network services applications. See FHWA's Smartphone Applications to Influence Travel Choices: Practices and Policies for more background information and guiding principles for public agencies.13
- Network surveillance and dynamic message signs. Subarea 3 already includes a healthy coverage of network surveillance (cameras and a variety of detectors) and DMS. However, additional deployments may be needed to support more advanced TSMO strategies or to measure system performance as it relates to the operations objectives. In the area, the use of probe data especially from third-party data providers may be particularly useful given the high penetration of such services in the area.
- Active traffic management (ATM) and active demand management (ADM). These strategies described under the Corridor 3 scenario may also be applied within Subarea 3, particularly for the freeways.
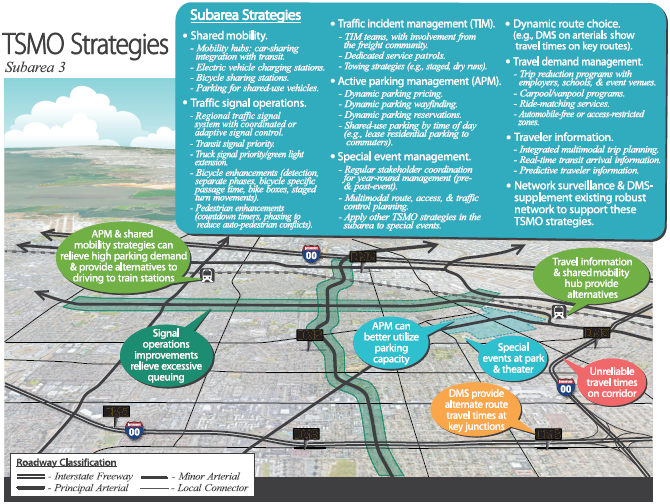
Figure 25. Illustration. Subarea 3 transportation systems management and operations strategies.
To realize an integrated deployment of the TSMO strategies, Subarea 3 transportation agencies adjust their institutional capabilities under each of the following categories:
Business Processes
- Continue to incorporate TSMO strategies into regional and agency long-range transportation plans. Coordinating the TSMO strategies with other regional or agency efforts helps align policies and goals and often helps develop project support and funding allocations.
- Continue to develop life-cycle costs (total cost for procuring, installing, operating, and maintaining a system throughout its use) for TSMO strategies and incorporate these costs into regional and agency transportation programming.
- Use ITS standards for new field devices and central systems to support interoperability between agencies and to support data sharing.
- Institute a schedule of preventative maintenance for new field devices/systems in the corridor.
- Develop operations and maintenance agreements if needed for agencies to operate another agency's ITS devices or traffic signals. For example, cities or counties may want the State DOT to provide after-hours traffic signal operations because it is more cost-effective.
- Develop SOPs to define procedures, roles, and responsibilities for new TSMO systems. The SOPs may be incorporated into existing operations and maintenance manuals (e.g., existing agency manual or regional TIM manual) or a new regional manual may need to be developed (e.g., dynamic route choice SOP manual).
Systems and Technology
- Optimally locate field devices to minimize power and communications costs, provide maintenance accessibility, and to use devices to support multiple strategies (e.g., camera and detector locations that support as many TSMO strategies as possible).
- Provide center-to-field interfaces to allow all device data to feed into systems at a traffic management center. Update center-to-center interfaces as needed (e.g., allow a city, county, or State agency to update signal timings for multi- jurisdictional signal groupings based on pre-defined SOPs).
- Automate procedures to the extent possible. For example, develop software (or software modules that integrate into existing advanced traffic management systems) that operates TSMO strategies such as active parking management based on pre-determined thresholds (e.g., real-time parking occupancy and 85th percentile travel speeds on subarea roadways).
- While systems engineering is an important part of implementing any TSMO strategy, it is especially important for many of the more advanced TSMO strategies identified for Subarea 3 that require the most stakeholder collaboration and system automation.
Performance Measurement
- Update data sharing policies and archive structure to accommodate easy data access for new stakeholders (e.g., parking facility operators, freight community).
- Continue to share data with public and private partners to support traveler information. This allows the data to be used in a variety of formats (e.g., mobile device applications that show dynamic route choice, shared mobility options, parking wayfinding, and dynamic parking pricing).
- Develop a routine performance management process for continuing improvements in operating policies, procedures, systems, and deployments. This may include quarterly performance metrics prior to regional collaboration meetings to determine if adjustments are needed anywhere where TSMO strategies are falling short of reaching the subarea's operations objectives.
Culture
- Continue to link TSMO program activities with transportation agencies' strategic plans. Finalize service- related cost-effectiveness to compare the TSMO program to other transportation programs to rationalize expansion of the TSMO program.
- Continue to hold regular meetings to ensure ongoing dialogue on integrated management activities across transportation and emergency response agencies. Include additional stakeholders as needed.
Organization/Workforce
- Train staff on operating and maintaining new systems (e.g., dynamic route choice, active parking management).
- Update database of personnel and resources across organizational units in each agency responsible for TSMO activities.
- Develop a TSMO management and organizational structure within key agencies (e.g., State DOT, city, county) equivalent to that of other major agency programs.
Collaboration
- Continue to hold regular (e.g., monthly) TSMO collaboration meetings with regional stakeholders.
- Develop working groups for TSMO strategies that require an expanded stakeholder set beyond the typical transportation and emergency stakeholders and meet regularly (e.g., quarterly, prior to a planned event, post-event). For example, a shared mobility working group may include agencies and stakeholders who operate electric vehicle charging stations and bicycle sharing stations, transit agencies, parking facility operators, and transportation network companies. Some working groups could be scheduled to meet following a regularly scheduled regional TSMO meeting to maximize attendance.