Model Transportation Systems Management and Operations Deployments in Corridors and Subareas Primer
2. Model Corridors
This section portrays three illustrative corridors based on fictional locations with unique geographic characteristics, motivators, and institutional capabilities that provide the backdrop for demonstrating how a package of transportation systems management and operations (TSMO) strategies can be planned and implemented to achieve a set of operations objectives.
MODEL CORRIDOR 1 – RURAL INTERSTATE
The backbone of Corridor 1 is a long stretch of rural interstate that passes through or near small cities, rural towns, and large unincorporated sections of rural counties, as depicted in Figure 2. Some sections of the interstate are paralleled by other principal arterials that connect nearby rural towns and rural lands to the interstate. Other principal arterials intersect the interstate to provide connections to far-off regions. Corridor 1 spans multiple regions that include a variety of State, county, and city agencies who manage the transportation system. The State department of transportation (DOT) maintains a statewide traffic operations program that oversees TSMO in the corridor.
The terrain is mountainous and the area experiences severe winter weather, including icy conditions and heavy snowfall. Some areas of the region are also prone to heavy fog or flooding during heavy rainfall events. Due to the rural nature of the area, mode choice in Corridor 1 predominantly consists of automobile and truck freight travel, with limited transit service. The majority of the traffic is made up of through-trips on the interstate. The principal arterials and adjacent sections of interstate are used by automobiles to connect residents to employment, school, and retail and are used by truck freight for intermediate trip destinations within the corridor's small cities and rural towns.
The agencies managing and operating the transportation systems in Corridor 1 demonstrate the following institutional capabilities for implementing a TSMO program:
Business Processes – A multi-year TSMO plan and program exists at the statewide level. Targeted multi-jurisdictional business processes for Corridor 1 still need development.
Systems & Technology – Operator-driven TSMO deployments have been implemented in parts of the corridor including weather and work zone management practices.
Performance Measurement – Some performance measurement of the system is regularly assessed but there is room for growth in this area. Culture – Agencies within the corridor appreciate the value and role of TSMO.
Organization/Workforce – The State DOT staffs engineers with TSMO skill sets. Collaboration – Informal collaboration occurs on a somewhat regular basis between the transportation and public safety agencies within the corridor.

Figure 2. Illustration. Corridor 1 geography.
The motivators driving the need to implement TSMO strategies in Corridor 1 include:
- High prevalence of crashes. Most of the crashes within Corridor 1 are run-off-the-road or rear-end collisions often caused by people driving too fast for the adverse weather conditions.
- Adverse weather. Corridor 1 experiences harsh winters. The interstate and principal arterials in the mountain pass in the western end of the corridor experience extensive periods of icy conditions and heavy snowfall. The central part of the corridor has heavy fog events, particularly from dusk to dawn. The eastern end of the corridor is prone to flooding during heavy rainfall events. These events sometimes result in full roadway closures.
- Financial constraints and priorities. Most resources are allocated to activities within Corridor 1, such as roadway maintenance, to address weather impacts or the use of maintenance crews to help public safety agencies with traffic incident management for the larger events that impact traffic (e.g., full road closures).
- Construction impacts. Frequent re-paving activities are needed to repair the roadways due to damage from the winter freeze/thaw cycles. Culvert and embankment repairs are also needed due to flood damage.
Figure 3 depicts the key motivators occurring in the corridor that stakeholders are keen to address with TSMO strategies.
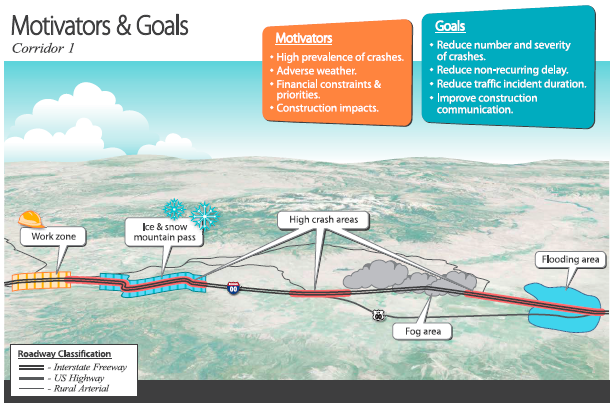
Figure 3. Illustration. Corridor 1 motivators and goals.
Key stakeholders—including planners, engineers, operators, and maintenance crews from the State, county, and local transportation agencies and emergency responders—collaborate to build a set of SMART (specific, measurable, agreed-upon, realistic, and time- bound) goals and operations objectives that address the identified motivators and provide guidance for the selection of a package of TSMO strategies. The four goals and supporting operations objectives include:
Goal 1: Reduce number and severity of crashes.
- Reduce severe and fatal crashes by 50 percent within 5 years.
Goal 2: Reduce non-recurring delay.
- Reduce the person hours of non-recurring delay associated with weather, incidents, and road work by 10 percent within 5 years.
- Decrease planning time for freight point-to-point travel times through Corridor 1 by 10 percent within 3 years.
Goal 3: Reduce traffic incident duration.
- Increase percentage of agencies that participate in a regional coordinated incident response team by 25 percent within
5 years.
- Reduce mean time for incident detection by 15 percent over 5 years.
- Reduce mean incident clearance time per incident by 15 percent over 5 years.
Goal 4: Improve construction coordination
- Increase the number of scheduled work zones on the rural interstate and parallel facilities that are identified in a shared, multi-agency database by 100 percent within 2 years.
Figure 4 shows how the four corridor goals and operations objectives established by the stakeholders connect to a set of TSMO program areas and strategies that reflect the community's constraints, motivations, and values.
For this rural interstate corridor, the TSMO program areas that address crashes, non-recurring delay, traffic incidents, and construction include:
- Traveler information.
- Weather management.
- Incident management.
- Emergency management.
- Work zone management.
While these TSMO program areas have discrete focus on different elements of managing and operating the transportation system, Figure 4 demonstrates how each of the strategies selected for this model corridor support multiple program areas. The result is a comprehensive approach to corridor management.
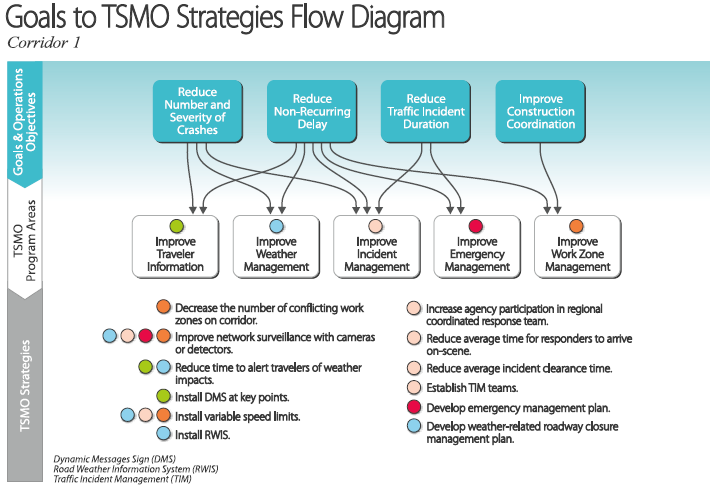
Figure 4. Diagram. Links between Corridor 1 goals and transportation systems management and operations strategies.
Corridor 1 stakeholders apply a scenario planning process that identified alternative operating conditions tied to the unique combination of motivators and goals for the corridor. Using this approach, stakeholders narrow down a broad array of potential TSMO strategies to a subset that are further screened for feasibility, potential benefits, and cost impacts. The strategies that best fit the Corridor 1 advance toward the implementation phase.
Figure 5 depicts the set of TSMO strategies selected by the corridor's stakeholders. This rural corridor has a base level of management elements in place, including a State-run traffic management center (TMC). The planning effort pulls together and augments these elements with new devices, communications, and activities to establish a focused TSMO approach to be advanced by the corridor's stakeholders.
The package of TSMO strategies included in Corridor 1 include:
- Network surveillance. The use of cameras and fixed and mobile detection throughout Corridor 1 allows system operators to monitor travel conditions and to detect and verify when travel is impacted by adverse weather, traffic incidents, or work zones. In turn, this allows quicker implementation of other strategies such as triggering a roadway closure management plan or turning on variable speed limits in high crash locations. Telematics on fleet vehicles can augment fixed detection by using mobile sensors to collect and transmit road conditions.
- Road weather information systems (RWIS). Deployment of full scale or low cost RWIS in key spots can help system operators detect adverse weather conditions such as fog and poor road surface conditions (e.g., icy, wet). This information enables use of variable speed limits, better dissemination of traveler information, and better allocation of resources (e.g., deicer application, snow plow assignment). Other road condition reporting systems using in-vehicle tablets on snow plows or agency fleets can also supplement fixed RWIS infrastructure.
- Dynamic message signs (DMS). Installation of DMS at key decision points along Corridor 1 allows travelers to make informed decisions, such as slowing down or taking an alternate route in response to adverse weather, traffic incidents, or work zones.
- Creating traveler information interfaces for third parties. Messages can be shared via a traveler information application programming interface (API) that makes agency travel data available to third party data providers. Since State DOTs are often the best source of road condition information in rural areas with limited private sector probe data coverage, the value of a third party interface is significant for low-volume rural areas
- Variable speed limits. The use of variable speed limits may reduce rear-end collisions in existing trouble spots. They may also control traffic flow through work zones.
- Roadway closure management plan. A plan can address roadway closures that occur during adverse weather. The plan may address detour feasibility for automobiles and freight (and associated traffic control devices), freight parking systems (so trucks are not stranded on the interstate), and agency roles and responsibilities. This plan may also be used to address full roadway closures caused by traffic incidents.
- Traffic incident management (TIM) teams. The use of TIM teams provides a framework for a coordinated regional response to the many run-off-the-road and rear-end collisions in the corridor. Regular meetings and debriefs help identify specific incident management strategies that are most beneficial for Corridor 1 (e.g., service patrols, quick clearance goals, towing agreements).
- Work zone management strategies. Numerous work zone strategies can help reduce non-recurring delay in Corridor 1, such as limiting the amount of work zones within the corridor (on the interstate and parallel routes) that occur at one time. Most TSMO strategies can be tailored to work zones. The Federal Highway Administration's (FHWA) Work Zone Operations Best Practices Guidebook (3rd edition) covers about 40 topics and numerous subtopics.10
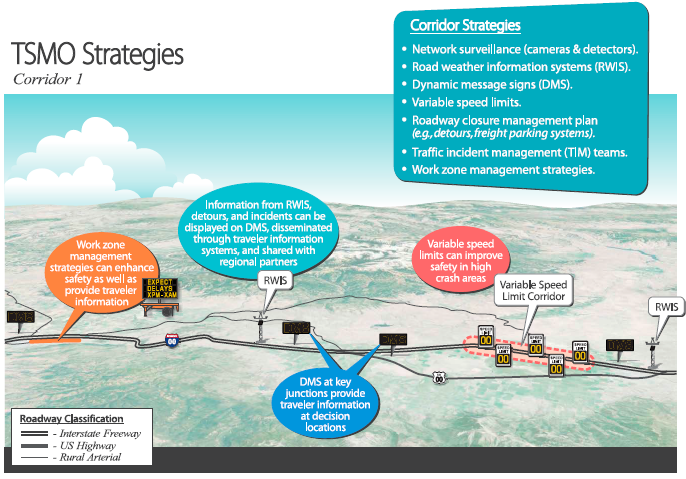
Figure 5. Illustration. Corridor 1 transportation systems management and operations strategies.
To realize an integrated deployment of the TSMO strategies, Corridor 1 transportation agencies adjust their institutional capabilities under each of the following categories:
Business Processes
- Incorporate TSMO strategies into regional and agency long range transportation plans. Coordinating the TSMO strategies with other regional or agency efforts helps align policies and goals and often helps develop project support and funding allocations.
- Develop life-cycle costs (total cost for procuring, installing, operating, and maintaining a system throughout its use) for TSMO strategies and incorporate these costs into regional and agency transportation programming.
- Use intelligent transportation system (ITS) standards for field devices and central systems to support interoperability between agencies and to support data sharing.
- Institute a schedule of preventative maintenance for field devices in the corridor.
- Develop maintenance agreements with some local agencies for the State DOT to maintain and operate ITS devices on county or city roadways such as cameras, detectors, or DMS that provide traveler information about conditions on the interstate.
- Develop an operations and maintenance manual to define procedures, roles, and responsibilities for new TSMO systems. For example, define what grip factor reading from an RWIS triggers the need for a maintenance crew to treat the roadway for icy conditions.
Systems and Technology
- Optimally locate field devices to minimize power and communications costs, provide maintenance accessibility, and to use devices to support multiple strategies (e.g., camera and detector locations that support variable speed limits, roadway closure management plan, traffic incident management, and work zone management).
- Provide center-to-field interfaces to allow all device data to feed into systems at the TMC.
- Automate procedures to the extent possible. For example, develop pre-set DMS messages for weather, incident management, work zone, road closure, and variable speed limit scenarios to support automated or faster decisionmaking for message posting.
Performance Measurement
- Establish data sharing policies and an archive structure to facilitate easy data access.
- Share data with public and private partners to support traveler information. This allows the data to be used in a variety of formats (e.g., mobile device applications that show the camera images, maps with travel speeds based on the detector data, road weather conditions based on the RWIS data).
- Measure performance of all the systems periodically and compare the performance to the corridor's operations objectives. Adjust corridor strategies if needed. For example, if incident clearance time does not appear to be on track for a 15 percent reduction in 5 years, re-evaluate the TIM strategies in use and try other strategies that may support the objective.
Culture
- Link TSMO program activities with transportation agencies' strategic plans.
- Hold regular meetings to ensure on-going dialogue on integrated management activities across transportation and emergency response agencies.
Organization/Workforce
- Train staff on operating and maintaining new systems (e.g., variable speed limit system). Consider contracting out some maintenance responsibilities if more cost-effective for specialty items not needed often (e.g., fiber optic cable maintenance, in particular splicing and emergency restoration).
- Compile a database of personnel and resources across organizational units in each agency responsible for TSMO activities.
Collaboration
- Coordinate amongst Corridor 1 agencies on the development and implementation of a road closure plan.
- Participate in TIM teams by meeting regularly to conduct joint training, table top exercises, and major incident debriefs.
MODEL CORRIDOR 2 – SMALL URBAN CORRIDOR
The backbone of Corridor 2 is a section of interstate within a small urban area. The interstate is paralleled by a minor arterial to the north and by a stand-alone shared-use path to the south. These facilities provide access to the surrounding arterial and collector roadway network. The interstate provides automobile and freight connections for local traffic and for through traffic with interim destinations within the city. Figure 6 depicts the geography of Corridor 2.
The urban area is characterized by thriving commercial districts, historic neighborhoods, a regional hospital, a university, and a major fairground facility. Corridor 2 facilities and services are managed through a combination of the State DOT, city, and transit agencies. The State DOT maintains a statewide traffic operations program that oversees ITS in the corridor.
The terrain is flat and the weather is mild with limited weather-related travel impacts.
Travel in Corridor 2 includes a mix of automobile, truck freight, transit, bicycle, and pedestrian modes. Interstate trips combine automobiles and truck freight traveling through the urban area and making many local trips. Trips on the arterial network connect residents to employment, school, and retail activities, and connect visitors to special events at the fairground facilities. A local bus line that ties into the citywide bus system runs along the corridor's minor arterial. In addition to the shared-use path throughout the corridor, many of the arterial and collector roadways have on-street bicycle lanes and sidewalks.
The agencies managing and operating the transportation systems in Corridor 2 demonstrate the following institutional capabilities for implementing a TSMO program:
Business Processes – Regional TSMO planning and deployment processes are standardized system-wide and are well-documented.
Systems and Technology – Agencies use advanced technologies within the region but with a limited level of automation.
Performance Measurement – Agencies routinely identify desired outcomes and measure performance to improve strategy deployment and overall operations.
Culture – Agencies recognize TSMO as a core program that they regularly coordinate with other programs.
Organization/Workforce – Agencies within the corridor have in-house engineers and maintenance crews with TSMO skill sets.
Collaboration – Agencies collaborate on traffic management at a high level via regional stakeholder engagement.
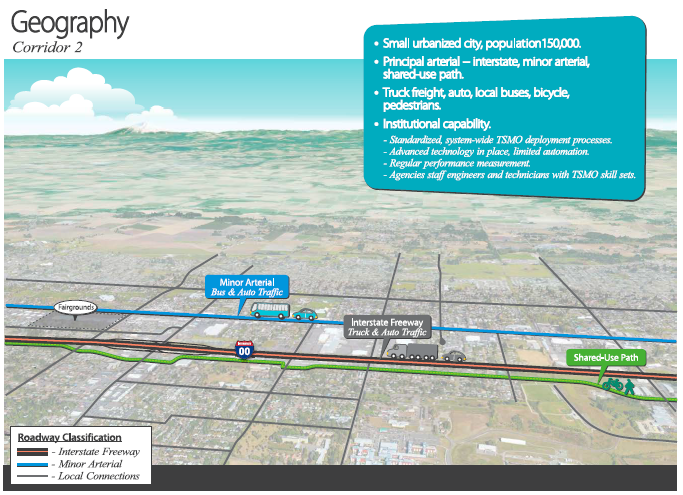
Figure 6. Illustration. Corridor 2 geography
The motivators driving the need to implement TSMO strategies in Corridor 2 include:
- Capacity bottlenecks and limitations to capacity expansion. Key bottleneck locations within the corridor include the interstate approaches to the interchange, the arterial approaches to the interchange, and the signalized intersections along the corridor's minor arterial. Limited right-of-way, including shoulders and built-out adjacent land limit the possibility of expanding capacity at the bottleneck locations.
- High prevalence of crashes. Many rear-end crashes occur on the interstate due to congestion at key interchanges. The arterials and collectors experience rear-end crashes at points where the road crosses shared-use paths, where there are also many bicycle and pedestrian reports of near-misses.
- Other traffic incidents. In addition to crashes, vehicles often stall out while sitting in congestion on the interstate. This blocks main lanes and further reduces capacity.
- Special event congestion. The annual state fair and periodic special events at the fairgrounds put a strain on the surrounding transportation network, causing queues on the arterials and interstate for arriving traffic and queues on the arterials for departing traffic. The congestion also causes delays to the corridor's bus line.
Figure 7 depicts the key motivators occurring in the corridor that stakeholders are keen to address with TSMO strategies.
Key stakeholders including planners, engineers, operators, and maintenance crews from the State and city transportation agencies, transit agency, and emergency responders collaborate to build a set of goals and SMART (specific, measurable, agreed-upon, realistic, and time-bound) operations objectives that address the identified motivators and provide guidance for the selection of a package of TSMO strategies. The five goals and supporting operations objectives include:
Goal 1: Reduce number of rear-end crashes.
- Reduce rear-end crashes by 20 percent within 5 years.
Goal 2: Manage travel demand.
- Increase mode share for transit, bicycles and pedestrians to 25 percent within 5 years.
Goal 3: Reduce recurring delay.
- Decrease the seconds of control delay per vehicle on corridor arterial roads by 15 percent within 5 years.
Goal 4: Reduce non-recurring delay.
- Reduce the person hours of non-recurring delay associated with incidents and special events by 10 percent within 5 years.
- Reduce average travel time into and out of the fairgrounds by 10 percent within 5 years.
- Decrease freight point-to-point travel times through Corridor 2 by 10 minutes within 3 years.
Goal 5: Reduce traffic incident duration.
- Reduce mean time for needed responders to arrive on-scene after notification by 15 percent over 5 years.
- Reduce mean incident clearance time per incident by 15 percent over 5 years.
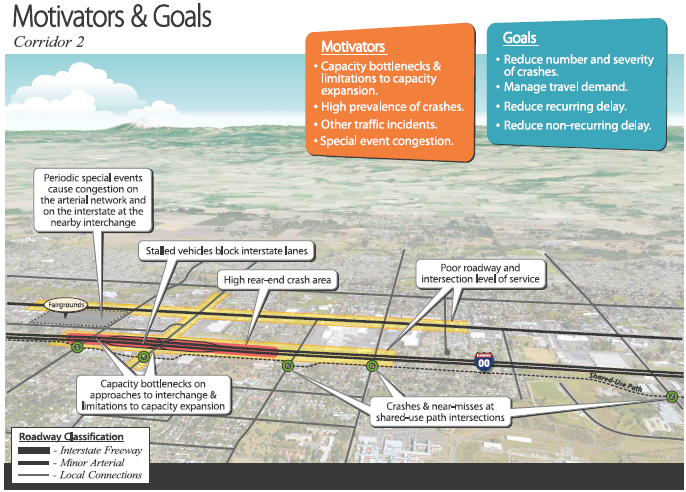
Figure 7. Illustration. Corridor 2 motivators and goals.
Figure 8 depicts how the five corridor goals and operations objectives established by the stakeholders connect to a set of TSMO program areas and strategies that reflect the metropolitan area's identified constraints, motivations, and values for the corridor.
For this small urban corridor, the TSMO program areas that address crashes, recurring and non-recurring delay, travel choices, and traffic incidents include:
- Traveler information.
- Traffic management and operations.
- Incident management.
- Travel demand management.
- Traffic incident reduction.
While these TSMO program areas have a discrete focus on different elements of managing and operating the transportation system, Figure 8 demonstrates how each of the strategies selected for this model corridor support multiple TSMO program areas. The result is a comprehensive approach to corridor management.
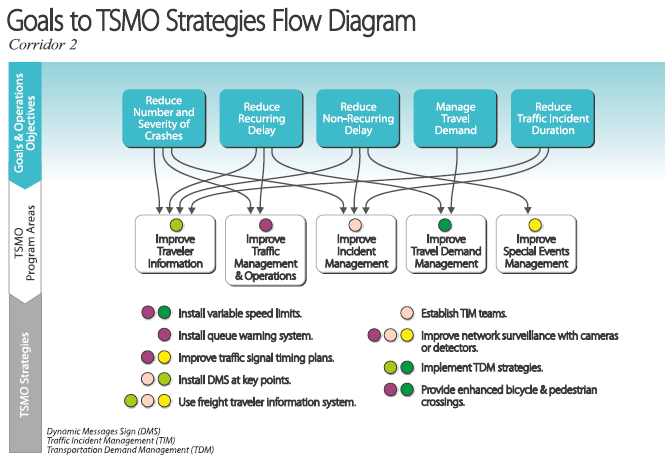
Figure 8. Diagram. Links between Corridor 2 goals and transportation systems management and operations strategies.
Corridor 2 stakeholders apply a scenario planning process that identified alternative operating conditions tied to the unique combination of motivators and goals for the corridor. Using this approach, stakeholders narrow down a broad array of potential TSMO strategies to a subset that are further screened for feasibility, potential benefits, and cost impacts. The strategies that best fit the Corridor 2 advance toward the implementation phase.
Figure 9 depicts the set of TSMO strategies selected by the corridor's stakeholders. This small urban area has a network of traffic signals connected to a central signal system, cameras and detectors on the interstate, cameras at some signalized intersections, detectors associated with each traffic signal, a State-run TMC, and a small workstation-based city-run TMC with limited hours of operation. The planning effort pulls together and augments these elements with new devices, communications, and activities to establish a focused TSMO approach to be advanced by the corridor's stakeholders.
The package of TSMO strategies selected for Corridor 2 include:
- Traffic incident management teams. The use of TIM teams provides a framework for a coordinated regional response to the many rear-end collisions and stalled vehicles in the corridor. Regular meetings and debriefs will help identify specific incident management strategies that are most beneficial for Corridor 2 (e.g., service patrols, quick clearance goals, towing agreements).
- Coordinated signal timing plans. Update coordinated signal timing plans on a routine basis to address changes in travel demand patterns. Develop pre-planned coordinated signal timing plans that can be activated for a variety of TIM and special event scenarios to handle the associated transportation demand.
- Freight traveler information. Use traveler information systems to help the freight industry plan routes and deliveries based on TIM events, planned special events, and weather restrictions. Provide truck parking information in partnership with the private sector.
- Transportation demand management (TDM). Use TDM strategies (e.g., rideshare, reduced transit fares) to reduce commuter and special event trips to influence travel choice related to mode, time, location, or route.
- Network surveillance. The use of more cameras and fixed and mobile detection throughout Corridor 2 will allow system operators to monitor travel conditions and to detect and verify when travel is impacted by bottlenecks, traffic incidents, or special events. In turn, this allows quicker implementation of other strategies such as triggering a queue warning alert or turning on variable speed limits. Mobile observations from sensors on fleet vehicles and information provided by third- party data providers can augment fixed network detection.
- Dynamic message signs. Installation of DMS at key decision points along Corridor 2 allows travelers to make informed decisions, such as slowing down or taking an alternate route in response to traffic incidents or special events.
- Creating traveler information interfaces for third parties. Messages can be shared via a traveler information application programming interface (API) that makes agency travel data available to third party data providers. Information owned by public agencies such as construction, work zone locations, and road closures are particularly valuable to share in this context.
- Active traffic management systems. Active management of real-time traffic conditions can help reduce rear-end collisions and smooth traffic flow. For Corridor 2, this includes the use of variable speed limits and a queue warning system that may use DMS or in-vehicle messages to alert drivers they are approaching the end of a standing queue.
- Enhanced safety at points where roads cross the shared-use path. Provide enhanced visibility of bicycles and pedestrians at crossings with treatments such as pavement markings, push button-activated rectangular rapid flashing beacons, pedestrian hybrid beacons, or traffic signals.
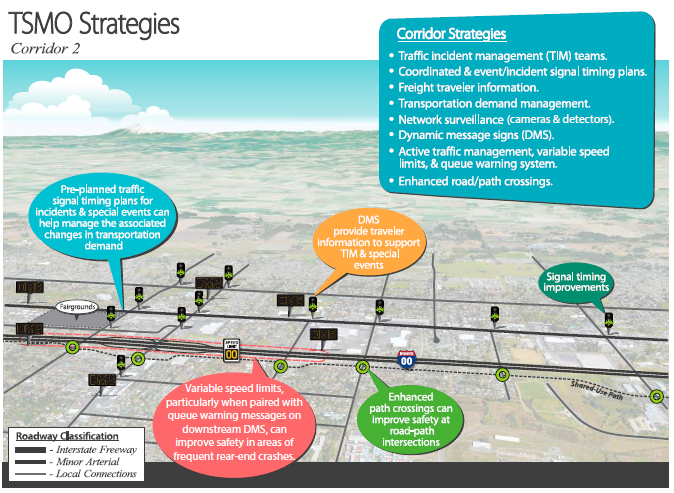
Figure 9. Illustration. Corridor 2 transportation systems management and operations strategies.
To realize an integrated deployment of the TSMO strategies, Corridor 2 transportation agencies adjust their institutional capabilities under each of the following categories:
Business Processes
- Continue to incorporate TSMO strategies into agency and regional long-range transportation plans. Coordinating the TSMO strategies with other regional or agency efforts helps align policies and goals. It can also increase project support and funding allocations.
- Continue to develop life-cycle costs (total cost for procuring, installing, operating, and maintaining a system throughout its use) for TSMO strategies and incorporate these costs into regional and agency transportation programming.
- Use ITS standards for new field devices and central systems to support interoperability between agencies and to support data sharing.
- Institute a schedule of preventative maintenance for new field devices in the corridor.
- Develop maintenance agreements with city if needed for the DOT to maintain and operate ITS devices on city roadways such as cameras, detectors, or traffic signals.
- Develop standard operating procedures (SOP) to define procedures, roles, and responsibilities for new TSMO systems. The SOPs may be incorporated into existing operations and maintenance manuals (e.g., active traffic management (ATM) for the State DOT) or a new regional manual may need to be developed (e.g., regional TIM SOP Manual).
- Develop agreements, if needed, for the city or State DOT to operate the other agency's traffic signals if tied into the same coordinated timing system. Depending on staffing, the city may operate the signals during their standard business hours and the State DOT may operate them after hours if there is an unexpected system outage or change in travel demand due to a crash or special event.
Systems and Technology
- Optimally locate field devices to minimize power and communications costs, provide maintenance accessibility, and to use devices to support multiple strategies (e.g., camera and detector locations that support variable speed limits, queue warning system, and traffic incident management).
- Provide center-to-field interfaces to allow all device data to feed into systems at the State or city TMC. Update center-to-center interfaces as needed (e.g., allow both city and State to control pan-tilt-zoom cameras and set primary and secondary controls based on jurisdiction of camera location).
- Automate procedures to the extent possible. For example, develop incident lane closure and volume thresholds to determine when to activate a pre-planned signal timing plan.
Performance Measurement
- Update data sharing policies and archive structure to accommodate easy data access for new stakeholders (e.g., freight community for Freight Advanced Traveler Information System (FRATIS) strategies).
- Continue to share data with public and private partners to support traveler information. This allows the data to be used in a variety of formats (e.g., mobile device applications that show maps with travel speeds and variable posted speeds based on the detector data, special event travel conditions).
- Measure performance of all the systems periodically and compare the performance to the corridor's operations objectives. Adjust the corridor strategies if needed. For example, if average travel times into and out of the fairgrounds do not appear to be on track for a 10 percent reduction in 5 years, re-evaluate the event management strategies in use and try other strategies that may support the objective.
Culture
- Continue to link TSMO program activities with transportation agencies' strategic plans. Use service-related cost-effectiveness to compare the TSMO program to other transportation programs to justify the expansion of the TSMO program.
- Continue to hold regular meetings to ensure ongoing dialogue on integrated management activities across transportation and emergency response agencies. Include additional stakeholders as needed.
Organization/Workforce
- Train staff on operating and maintaining new systems (e.g., variable speed limit systems).
- Update database of personnel and resources across organizational units in each agency responsible for TSMO activities.
- Develop a TSMO management and organizational structure within key agencies (e.g., State DOT and city) equivalent to that of other major agency programs.
Collaboration.
- Participate in TIM teams by meeting regularly to conduct joint training, tabletop exercises, and major incident debriefs.
- Develop a working group of transportation agencies and members of the freight community to develop the freight traveler information TSMO strategy. Meet on a routine basis to determine the effectiveness of the strategy and make updates as needed.
- Develop a fairgrounds special event working group that meets prior to and after the annual State fair and other major fairgrounds events. Stakeholders may include transportation agencies, the transit agency, law enforcement, the 911 center, special event promoters, venue management teams, parking facility operators, media, and property owners adjacent to and near the fairgrounds.
MODEL CORRIDOR 3 – LARGE URBAN CORRIDOR
Corridor 3 encompasses a set of closely spaced parallel transportation facilities: an interstate, a minor arterial, a commuter rail line, and a shared-use path. Parallel principal and minor arterials are located nearby. While the interstate carries auto and truck freight traffic through the region, Corridor 3 also provides local connections within a large urbanized metropolitan area. Figure 10 depicts the geography of Corridor 3.
The eastern section of the corridor includes key destinations: a regional employment hub, industrial center, a university campus, and an arena that holds events year-round. The remainder of the corridor includes densely populated residential areas interspersed with commercial land uses.
Transportation facilities are managed by a combination of State, county, cities, regional transit, and local transit agencies. A metropolitan planning organization (MPO) supports regional planning, programming, and collaboration. A regional TMC provides 24/7 management of the interstate and key arterials in the corridor.
The entire metropolitan area is prone to heavy snowfall during the winter, which can result in major delays on the transportation system.
The urbanized character of Corridor 3 supports a broad range of modes, including automobile, truck freight, transit, bicycle, and pedestrian trips. Interstate trips include a mix of automobiles and truck freight traveling through the area and making local trips. Arterial network trips connect to the major activity centers. A commuter rail line and a bus rapid transit line on the minor arterial provide key links within the corridor and connect to the region's transit backbone. In addition to the shared-use path that runs through the corridor, many of the streets have on-street bicycle lanes and sidewalks.
The agencies managing and operating the transportation systems in Corridor 3 demonstrate the following institutional capabilities for implementing a TSMO program:
Business Processes – Regional TSMO development and deployment processes are standardized system-wide but need more integration into other formal procedures of the agency.
Systems and Technology – Within the region, many agencies use advanced technologies, some with advanced automation.
Performance Measurement – Agencies routinely identify desired outcomes and measure performance to improve strategy deployment and overall operations.
Culture – Agencies recognize TSMO as a core program and are working toward rationalizing it with other programs based on service-related cost-effectiveness.
Organization/Workforce – Agencies within the corridor have in-house engineers and maintenance crews with TSMO skill sets and share resources across agencies.
Collaboration – Agencies collaborate on TSMO via regional stakeholder engagement and are working towards negotiating region-wide roles and responsibilities.
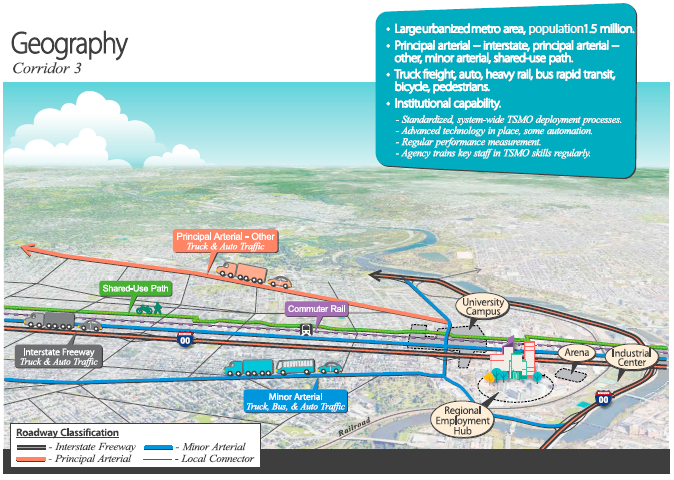
Figure 10. Illustration. Corridor 3 geography.
The motivators driving the need to implement TSMO strategies in Corridor 3 include:
- Adverse environmental issues. Corridor 3 is located within a non-attainment area where air pollution levels persistently exceed standards for ozone, carbon monoxide, and particulate matter. The industrial centers on Corridor 3 contribute to the city's non-attainment status.
- Adverse weather. Snow and ice from winter storms often cause delays on Corridor 3 facilities and sometimes result in full facility shutdowns.
- Capacity bottlenecks and limitations to capacity expansion. Signalized intersections (including the interchanges) are the key bottleneck locations within the corridor. Limited right-of-way and built-out adjacent land limits the possibility of expanding capacity.
- Construction impacts. Frequent re-paving activities are needed to repair the roadways due to damage from the winter freeze/thaw cycles. Rail switches need to be replaced more frequently because of the winter freezes.
- High prevalence of crashes. Many rear-end crashes occur on the interstate due to standing queues. Many near-misses are reported at locations where the shared-use path crosses a roadway.
- High traffic volumes. The interstate and arterials carry high volumes of traffic throughout the day and are at or near capacity during peak periods. Commuter rail and bus rapid transit ridership is often at or near capacity during peak periods.
- Special event congestion. Year-round events at the arena impact the surrounding transportation network at varying times, including the weekday evening commute. This results in congestion on Corridor 3 roadways as well as surges in transit ridership that often exceed capacity.
- Variability in trip reliability. Average trip time varies widely from day to day. During the evening peak for example, trip time through Corridor 3 can be as short as 15 minutes and as long as 45 minutes.
- Financial constraints and priorities. Corridor 3 competes for funding with other regional programs and other similar corridors within the region. Many resources are also allocated to roadway maintenance related to the adverse winter weather.
Figure 11 depicts the key motivators occurring in the corridor that stakeholders are keen to address with TSMO strategies.
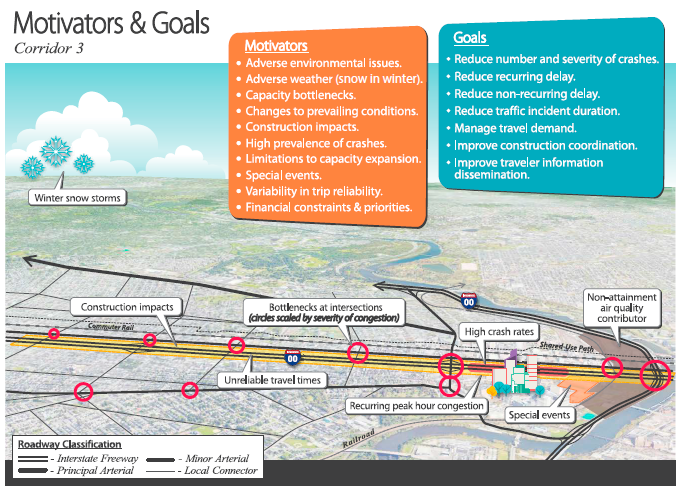
Figure 11. Illustration. Corridor 3 motivators and goals.
The MPO convened key corridor stakeholders including planners, engineers, operators, and maintenance crews from the State, county, local transportation agencies, and emergency responders to build a set of goals and SMART operations objectives that address the identified corridor motivators and provide guidance for the selection of a package of TSMO strategies. The seven goals and their supporting operations objectives include:
Goal 1: Reduce the number and severity of crashes.
- Reduce time to alert travelers of events (e.g., road weather, standing queues) by 15 percent within 5 years.
Goal 2: Reduce recurring delay.
- Decrease the seconds of control delay per vehicle on corridor arterial roads by 15 percent within 5 years.
- Reduce the daily hours of recurring congestion on the freeway and arterial corridors by 15 percent within 5 years.
- Reduce excess fuel consumed due to congestion by 25 percent within 5 years.
Goal 3: Reduce non-recurring delay.
- Reduce the person hours of non-recurring delay associated with weather, incidents, and road work by 10 percent within 5 years.
- Reduce average travel time into and out of the arena by 15 percent within 5 years.
- Decrease the percentage of special event attendees traveling to the event in single-occupancy vehicles by 25 percent within 5 years.
- Decrease average freight point-to-point travel times through Corridor 3 by 10 minutes within 3 years.
- Reduce the variability of travel time on Corridor 3 routes by 15 percent during peak and off-peak periods within 5 years.
- Improve average on-time performance for Corridor 3 transit routes by 15 percent within 5 years.
Goal 4: Reduce traffic incident duration.
- Reduce mean time for needed responders to arrive on-scene after notification by 15 percent over 5 years.
- Reduce mean incident clearance time per incident by 15 percent over 5 years.
Goal 5: Manage travel demand.
- Increase average pedestrian and bicyclist comfort level by 30 percent within 5 years.
- Increase the number of trips made by walking and bicycling by 15 percent over 5 years.
- Develop and provide travel option services to all Corridor 3 communities and stakeholder audiences within 5 years.
Goal 6: Improve construction coordination.
- Decrease the number of work zones on parallel routes or along Corridor 3 by 10 percent within 5 years.
Goal 7: Improve traveler information dissemination.
- Increase customer satisfaction ratings for timeliness, accuracy, and usefulness of traveler information in Corridor 3 by 50 percent within 5 years.
Figure 12 depicts how the seven corridor goals and operations objectives established by the stakeholders connect to a set of TSMO program areas and strategies that reflect the metropolitan area's identified constraints, motivations, and values for the corridor.
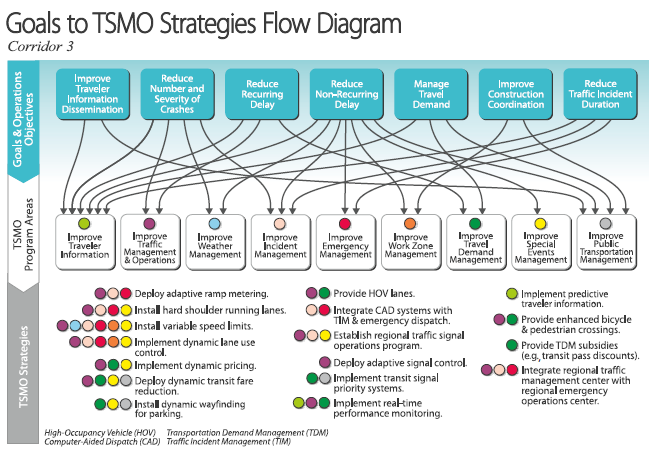
Figure 12. Illustration. Links between Corridor 3 goals and transportation systems management and operations strategies.
For this highly urban corridor, the TSMO program areas that address crashes, recurring and non-recurring delay, adverse weather conditions, traffic incidents, and frequent special events include:
- Traveler information.
- Traffic management and operations.
- Weather management.
- Incident management.
- Emergency management.
- Work zone management.
- Travel demand management.
- Special events management.
- Public transportation management.
While each of these TSMO program areas has a discrete focus on a different element of managing and operating the transportation system, Figure 12 demonstrates how each of the strategies selected for this model corridor support multiple TSMO program areas. The result is a comprehensive approach to corridor management.
Corridor 3 stakeholders apply a scenario planning process that identified alternative operating conditions tied to the unique combination of motivators and goals for the corridor. Using this approach, stakeholders narrow down a broad array of potential TSMO strategies to a subset that are further screened for feasibility, potential benefits, and cost impacts. The strategies that best fit Corridor 3 advance toward the implementation phase.
Figure 13 depicts the set of TSMO strategies selected by the corridor's stakeholders. The relative sophistication of transportation services in this corridor along with the high degree of institutional capability provide a solid foundation for implementing an advanced program of TSMO strategies. The planning effort pulls together and augments these elements with new devices, communications, and activities to establish a focused TSMO approach to be championed and implemented by the corridor's stakeholders.
Given the advanced state of TSMO activities in Corridor 3, the stakeholders recognize an opportunity to apply an integrated corridor management (ICM) approach to coordinate responses between multiple owners/operators of facilities and modes in the corridor. ICM can play an important role in managing incidents, planned special events, adverse weather, and work zones by establishing coordinated response protocols. Any combination of the Corridor 3 TSMO strategies can be used within an ICM process.
The package of TSMO strategies selected for Corridor 3 include:
- Active traffic management. Active management of real-time traffic conditions on congested mainlines can help reduce rear-end collisions and smooth traffic flow. For Corridor 3 this includes strategies such as adaptive ramp metering to control the flow of traffic entering the freeway, part-time shoulder use to add capacity on a temporary basis, variable speed limits to slow travel speeds approaching slow or standing queues, and dynamic lane use control to open and close lanes or to allow shoulder use.
- Active demand management (ADM). Across the corridor, real-time information and technology can be used to actively manage demand by redistributing trips to less congested times of day or routes or to reduce overall vehicle trips by influencing mode choice. This can be done in Corridor 3 through dynamic pricing where roadway tolls dynamically change in response to congestion levels or through dynamic transit fare reduction that reduces the Corridor 3 transit fares as congestion increases on the interstate and arterials.
- Active parking management (APM). Active management of parking facilities can help optimize the utilization of those facilities while influencing travel behavior at various stages of the trip-making process. In Corridor 3, dynamic parking contraflow wayfinding can provide parking space availability and location near the arena to minimize the time spent looking for parking. This can also be used for transit park- and-ride lots to encourage a shift in mode choice.
- Special event management. Apply coordinated operations strategies to inform the traveling public about travel conditions, monitor changing travel conditions, and manage travel demand associated with each planned special event. Strategies may include signal timing plans optimized for arena traffic demand, contraflow lanes or changeable lane assignment on roadways with a dominant travel direction during event ingress or egress, and any of the ATM, ADM, or APM strategies described for Corridor 3.
- Traffic incident management. With a high level of institutional capability, TIM teams and dedicated service patrols already provide TIM services on Corridor 3. The agencies can further optimize these practices with strategies such as computer-aided dispatch (CAD) integration between emergency management and transportation agencies or activating ICM, ATM, ADM, or APM strategies when traffic incidents occur.
- Enhanced safety at locations where roads cross the shared-use path. Provide enhanced visibility for bicycles and pedestrians at crossings with treatments such as pavement markings, push button-activated rectangular rapid flashing beacons, pedestrian hybrid beacons, or traffic signals.
- Traffic signal operations. Due to the many agencies that operate within the corridor and the metro area, a regional traffic signal coordination program can help seamlessly operate traffic signals across jurisdictional boundaries. Adaptive signal control may also be considered for densely populated urban areas where travel demand changes are not limited to morning and evening commutes. Commuter rail preemption and transit signal priority for the buses can help the transit routes maintain schedule performance and reduce transit trip variability.
- Work zone management strategies. Many of the Corridor 3 ATM and ADM strategies can be installed in advance of construction re-paving activities on the interstate to help with work zone management. Additionally, the use of real-time performance data can be used to actively monitor and update work zone traffic control, such as using threshold performance targets to determine when a closed lane should be added back into service. Close continued coordination between agencies can also help to schedule maintenance and construction activities in a way to minimize disruptions to travel within Corridor 3. For more information on influencing travel demand during the planning and operational phases of work zones, see FHWA's Active Transportation and Demand Management (ATDM) Program Brief: ATDM and Work Zones.11
- Predictive traveler information. Develop predictive algorithm applications to generate travel forecasts based on both archived and real-time data. Disseminate forecasted conditions to the traveling public.
- Transportation demand management. Use TDM strategies to reduce commute and special event trips to influence travel choice related to mode, time, location, or route. TDM strategies for Corridor 3 may include subsidies for transit passes and carpool/ vanpool programs, high occupancy vehicle (HOV) lanes on the freeway, trip reduction programs (in partnership with employers, the university, and the arena), and many of the strategies (particularly ADM and APM) described in this section.
- Emergency management. To better manage major events such as heavy snow storms, integrate or co-locate the regional traffic management center with the regional emergency operations center. While regional emergency management plans have well-thought-out protocols and procedures, they do not always consider TSMO strategies that may be used to assist during a major event. For example, if a heavy snow storm has made many roads impassable in Corridor 3, dynamic lane control and part-time shoulder use may be used to increase freeway capacity once the interstate has been cleared of snow while the arterial roads and rail lines are still being cleared.
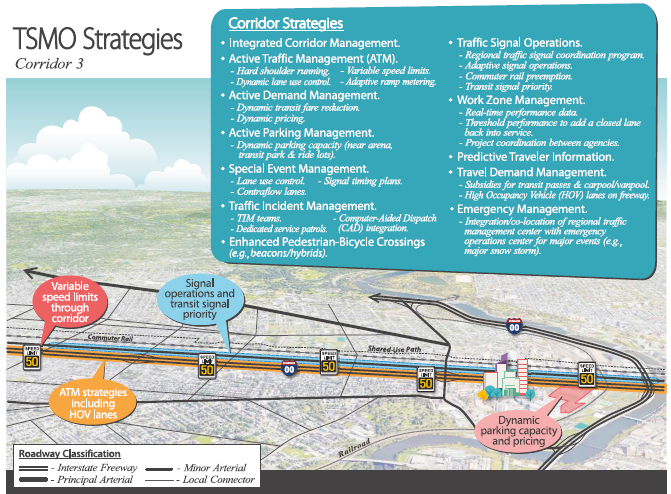
Figure 13. Illustration. Corridor 3 transportation systems management and operations strategies.
To realize an integrated deployment of the TSMO strategies, Corridor 3 transportation agencies adjust their institutional capabilities under each of the following categories:
Business Processes
- Continue to incorporate TSMO strategies into regional and agency long-range transportation plans. Coordinating the TSMO strategies with other regional or agency efforts helps align policies and goals and often helps develop project support and funding allocations.
- Continue to develop life-cycle costs (total cost for procuring, installing, operating, and maintaining a system throughout its use) for TSMO strategies and incorporate these costs into regional and agency transportation programming.
- Use ITS standards for new field devices and central systems to support interoperability between agencies and to support data sharing.
- Institute a schedule of preventative maintenance for new field devices/systems in the corridor.
- Develop operations and maintenance agreements if needed for agencies to operate other agency's ITS devices or traffic signals. For example, a city may want the State DOT to post messages on arterial DMS about freeway conditions or pooled funding may allow for a regional transportation management center to provide after-hours operations for multiple agencies more cost-effectively than a single agency can for its jurisdiction.
- Develop SOPs to define procedures, roles, and responsibilities for new TSMO systems. The SOPs may be incorporated into existing operations and maintenance manuals (e.g., an existing agency manual or regional TIM manual) or a new regional manual may need to be developed (e.g., ICM SOP manual).
Systems and Technology
- Optimally locate field devices to minimize power and communications costs, provide maintenance accessibility, and to use devices to support multiple strategies (e.g., camera and detector locations that support as many TSMO strategies as possible).
- Provide center-to-field interfaces to allow all device data to feed into systems at a traffic management center. Update center-to-center interfaces as needed (e.g., allow city and State to operate traffic signals based on pre-defined SOPs).
- Automate procedures to the extent possible. For example, develop software (or software modules that integrate into existing advanced traffic management systems) that operates TSMO strategies based on pre-determined thresholds (e.g., change variable speed limits based on real-time 85th percentile travel speeds).
- While systems engineering is an important part of implementing any TSMO strategy, it is especially important for many of the more advanced TSMO strategies identified for Corridor 3 that require the most stakeholder collaboration and system automation.
Performance Measurement
- Update data sharing policies and archive structure to accommodate easy data access for new stakeholders (e.g., parking facility operators for APM).
- Continue to share data with public and private partners to support traveler information. This allows the data to be used in a variety of formats (e.g., mobile device applications that show real-time posted speeds, dynamic lane use control, dynamic pricing, and parking wayfinding).
- Develop a routine performance management process for continuing improvements in operating policies, procedures, systems, and deployments. This may include quarterly performance metrics prior to regional collaboration meetings to determine if adjustments are needed anywhere where TSMO strategies are falling short of reaching the corridor's operations objectives.
Culture
- Continue to link TSMO program activities with transportation agencies' strategic plans. Finalize service- related cost-effectiveness to compare the TSMO program to other transportation programs to justify the expansion of the TSMO program.
- Continue to hold regular meetings to ensure on-going dialogue on integrated management activities across transportation and emergency response agencies. Include additional stakeholders as needed.
Organization/Workforce
- Train staff on operating and maintaining new systems (e.g., dynamic lane control, dynamic pricing).
- Update database of personnel and resources across organizational units in each agency responsible for TSMO activities.
- Develop a TSMO management and organizational structure within key agencies (e.g., State DOT and city) equivalent to that of other major agency programs.
Collaboration
- Continue to hold regular (e.g., monthly) TSMO collaboration meetings with regional stakeholders.
- Develop working groups for TSMO strategies that require an expanded stakeholder set beyond the typical transportation and emergency response stakeholders and meet regularly (e.g., quarterly, prior to a planned event, post-event). For example, an active parking management working group may include private and public parking facility operators and transit agencies that operate park and ride lots. Some working groups could be scheduled to meet following a regularly scheduled regional TSMO meeting to optimize attendance.