Freight Demand Modeling and Data Improvement Handbook
Chapter 3. Modeling Innovations
There were four SHRP2 C20 projects related to modeling improvement as part of the Implementation Assistance Program (IAP). The four participants included:
- Maricopa Association of Governments (MAG)—Arizona.
- Maryland State Highway Administration and Baltimore Metropolitan Council.
- Metro—Oregon.
- Wisconsin Department of Transportation.
As with the data projects in Chapter 2, the summaries below provide an overview of each project with enough detail to provide a basic level of information on each. This will allow the reader to determine the appropriateness of the method for a specific situation. More detail is provided in the individual case studies prepared for each project. Detailed project reports prepared by each team can be consulted for in-depth discussion of each project. More information about these projects can be found on the SHRP2 C20 website.2
The SHRP2 Freight Demand Modeling and Data Improvement Strategic Plan identified several decisionmaking needs and gaps in freight planning, data, and modeling. In Table 11, the four IAP projects are compared against those needs and gaps to show the areas in which they are breaking the most ground addressing the gaps.
| Decisionmaking Needs | MAG | MSHA/BMC | Metro | WisDOT |
|---|---|---|---|---|
| Standardized data sources with common definitions. | ||||
| Statistical sampling of truck shipments. | ||||
| Standardized analytic tools and applications. | ||||
| Inclusion of behavior-based elements into freight models. | ||||
| Data development to understand the nature, volume, and trends of intermodal transfers. | ||||
| Industry-level freight data development at a sub-regional level and within urban areas. | ||||
| Incorporation of local land use policies and controls for better local forecasting accuracy. | ||||
| Development of a correlation between freight activity and various economic | u | u | u | u |
| influences and macroeconomic trends. | ||||
| Better accuracy of freight forecasts. | ||||
| Development of a process to routinely generate new data sources and problem solving methods. | ||||
| Use of ITS resources to generate data for freight modeling. |
Principles and Considerations for Freight Modeling Improvement
Although each modeling project was unique in the way that it looked to develop forecasting methods and tools to address decisionmaking needs, several general principles emerged from the research.
Behavior-Based Modeling
Behavior-based aspects of freight decisionmaking are being incorporated into models. These improvements allow the model to more accurately portray the complex factors that are involved in decisionmaking by freight shippers and carriers.
Use of an Open Format Code
Models of all the projects were developed using an open source programming language that is the basis used by other States and metropolitan planning organizations (MPOs). Use of this platform allows improvements made to the model to be available to all other modelers. They also utilized available public freight data sets along with more localized data compiled specifically for use within the model. Data sources for localized freight movement may need to be updated into the model as they become available.
Collection of Establishment Data
The collection of local establishment data can be difficult even with strong support from partners and a robust data collection outreach process. Agencies should be ready to use all available methods to collect local data because no one method will produce enough. Paper surveys and trip diaries, smartphone apps, vehicle monitoring data, site visits, and other methods should all be considered for use.
Development of Localized Modeling
Most projects included the development of an integrated freight model that is able to provide supporting data and information on a more refined basis. The models consider local freight movements and the ability to identify commodity types, volumes, and routes as well as existing infrastructure issues (e.g., congestion, conditions, safety) and project priorities within a region.
Providing Training Materials
Many of the projects developed freight model guides and provided either on-site training sessions and/ or written documentation to educate users in the function and maintenance of the models. This training helped to ensure the success of the model as well as set the stage for future improvements to refine it.
Maricopa Association of Governments—Arizona
Project Overview/Need
The Arizona Sun Corridor megaregion encompasses portions of five counties that comprise the metropolitan areas served by the Maricopa Association of Governments (MAG) and the Pima Association of Governments (PAG). This megaregion is home to approximately 8 out of every 10 Arizonans, and it includes one of the busiest freight ports on the United States-Mexico border. There was a need to develop a freight model that accurately depicts freight shipment behavior for the region.
Modeling Innovations to Meet Need
The goal was to advance freight modeling research and to develop a behavior-based model inclusive of all planning areas in the megaregion. The desire was for the model to better replicate the economic behaviors of establishments, shippers, and carriers by modeling travel and tour formations throughout Arizona's Sun Corridor megaregion. MAG, PAG, and the Arizona Department of Transportation (ADOT) collaborated to develop the regional freight model so that it could be integrated within regional and statewide travel forecasting models to support decisionmaking and analysis for the entire megaregion.
The model hierarchy developed by the project team included three layers, each containing one or more models:
- Financial Layer – describes the production, consumption, and evolution of businesses. This includes a Firm Synthesis Model.
- Logistics Layer – determines the transfer of goods between buyers and suppliers. The Supplier Selection Model generates buyers and sellers for shipments.
- Physical Transportation Layer – estimates truck activity for origin and destination of local goods movement. This layer contains two models: a Supply Chain Model that describes how goods are moved from origin to destination and a Truck Tour Model that captures any touring behavior (i.e., making multiple deliveries in a single day) by trucks in the region.
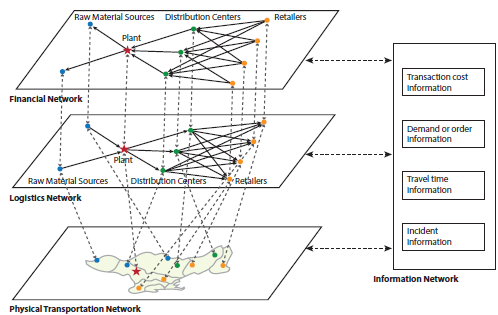
Source: Xu, Hancock and Southwork (2003)
Figure 11. Diagram. Model hierarchy.
These model components were integrated into one model and were incorporated into the existing travel demand models for both MPOs. The new model bridges the separate models previously maintained by the agencies in the region. The MPOs were able to convert the output and extract the information on shipments starting or ending within their jurisdictions. Traffic assignment and validation activities were then completed by each MPO. Many industry partners prefer to keep information on what is being shipped where and when proprietary to maintain their competitive edge. A benefit of this project is that the team developed modeling methods based on sound economic principles. Rather than the MPOs borrowing data or developing a basic estimate for extrapolation to future model years, the project team developed a Firm Synthesis Model that uses an established match algorithm and that can estimate changes in firm growth and dissolution over time and space.
Lessons Learned/Transferable Lessons
The majority of the work accomplished was not region-specific, and it could be replicated by other agencies with comparable data access and resources. The project team shared several lessons learned during the process of developing this model:
- Ensure strong project management with staffing redundancies. This large project involved many people, so staff management was important, as was depth of expertise to fill in for any staff lost to turnover.
- Maintain an emphasis on team coordination. A multi-part modeling project requires ongoing coordination.
- Develop a clear process for quality assurance and quality control. Model parts developed by different people must eventually integrate seamlessly. Quality assurance and quality control activities ensure this integration.
- Utilize visualization to support quality control and communications. Errors are often more easily spotted visually.
- Consider data licensing requirements before data acquisition. Licenses can be expensive and data restrictions may limit the ability to use the data in new or unique ways.
- Ensure adequate resources for model development. A large modeling project is expensive and staff-intensive
Next Steps in Research
MAG plans to continue to refine the model by advancing the stop identification algorithms in truck GPS data, incorporating land-use, economic models, forecasting and other criteria, and completing light truck data collection to improve the model's accuracy for that vehicle class. The project team believes that the new behavior-based freight model will give the overall region more flexibility to test different policy and planning scenarios than traditional travel models.
Maryland Department of Transportation and Baltimore Metropolitan Council
Project Overview/Need
The Baltimore-Washington metropolitan region is heavily congested and has many major freight facilities with limited infrastructure expansion options. Given these constraints, it is critical for planners at the Maryland Department of Transportation State Highway Administration (MDOT SHA), Baltimore Region Transportation Board (BRTB), and the Baltimore Metropolitan Council (BMC) to understand how freight is moving into, out of, and within the region.
Typically, traditional freight models are limited to goods shipped via truck, and they do not account for the multi-modal aspect of supply chains or provide much ability for sensitivity testing with regard to fine-grained changes, such as specific economic drivers or different land-use scenarios.
Modeling Innovations to Meet Need
To meet its freight modeling needs, the MDOT SHA, BRTB, and BMC collaborated to develop an operational behavior-based freight model sensitive to both long-distance freight flows as well as short-distance urban truck tours.
The model provides three levels of geographic coverage: urban shipments within the BMC's region, shipments across the State, and shipments in or out of Maryland to the rest of the world. The model estimates all major freight modes (truck, rail, water, and air). For goods moved by truck, the model includes light, medium, and heavy-duty vehicles.
The model hierarchy developed by the project team included the integration of three models:- Supply Chain Model – Integrates business suppliers and buyers; commodity flows; shipment path, size, and frequency; and trip assignment.
- Truck Touring Model – Estimates truck activity for origin and destination of local goods movement.
- Commercial Vehicle Touring Model – Estimates non-freight commercial vehicles (e.g., construction, service vehicles).
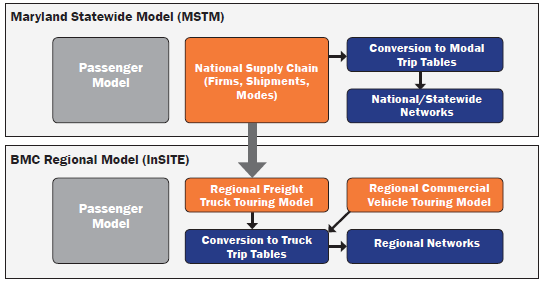
Source: Resource Systems Group, Inc.
Figure 12. Diagram. Overall model design.
These model components were integrated into one package called "rFreight" for use by both MDOT SHA and BMC. The core code for the new model is used by several other States and MPOs around the country, so an online repository has been established where model users and designated stakeholders can collaborate to maintain and improve the model code.
On-site training activities and manuals were provided to guide the MDOT SHA and BMC in the first five years of model use. A Freight Model System Plan guide was provided with four topics:
- Application code maintenance.
- Validation and model input data collection.
- Behavioral data collection.
- Supply chain economic sensitivity.
Lessons Learned/Transferable Lessons
While many of the project activities sought to tailor the model to Maryland, other States and MPOs are now using the core model developed. Agencies can replicate the activities completed within this project to tailor and implement a similar behavior-based freight demand model if they have or can obtain the data required to calibrate and validate it.
Complex modeling projects such as this require open communication and ongoing high-level management of the effort. Management and communication keep the multiple parts working in sync.
Having all the relevant model information (i.e., a documented, organized set of folders of data, files, analysis outputs, and scripts) in a single location is a useful resource to accompany the model and facilitate future model updates.
Next Steps in Research
The team intends to run scenarios to gauge the model's sensitivity to local and State freight issues based on feedback from local freight stakeholders. The team intends to integrate it with the U.S. Environmental Protection Agency's Motor Vehicle Emission Simulator (MOVES) 2014 model. The model will be used to conduct analysis in several areas, including bottleneck evaluation, the impact of trucks on roadway capacity, temporal analysis of truck trips, and project prioritization.
Metro—Oregon
Project Overview/Need
Located in the Pacific Northwest, Metro serves as the Portland, Oregon, metropolitan planning organization (MPO). Metro initiated a commodity-flow truck model for the region in 1996 and has since improved and updated the plan four times. The MPO became increasingly interested in improving model capabilities by increasing the model's range of responses to network conditions and costs, depicting the flow of goods by commodity type, and improving its value as a tool in supporting regional policy evaluation. The objective of the project was to develop and implement a behavior-based freight model for the region. The project team anticipated that this model would:
- Help stakeholders evaluate regional economic policies.
- Depict a broad range of responses to network conditions and costs.
- Depict both truck volumes by vehicle type and flow of goods by commodity type on the network.
- Include freight trucks as well as service and parcel trucks.
Modeling Innovations to Meet Need
To begin the project, Metro developed an "establishment survey" to collect behavioral freight data that focused on travel across four counties in Metro's modeling area. The survey was distributed to non-freight service providers (e.g., construction contractors) and firms associated with short-distance light- and medium-truck goods movement. The survey was available as either a paper-based form or a smartphone application. GPS data for truck trips was also provided by local distribution businesses and supplemented by commercial GPS data from data vendors. Because the establishment survey collected the required data, the model allows planners to estimate the movement of service vehicles separately from typical freight vehicles.
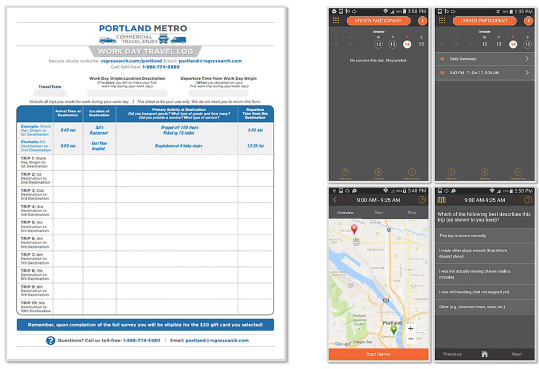
Source: Metro.
Figure 13. Image. Paper and smartphone survey examples.
The project team designed a model framework integrating the new freight model with the existing passenger travel demand model. The overall model consists of three sub-models:
- Supply Chain Model – integrates business suppliers and buyers; commodity flows; shipment path, size, and frequency; and trip assignment.
- Truck Touring Model – estimates truck activity for origin and destination of local goods movement.
- Commercial Vehicle Touring Model – estimates non-freight commercial vehicles (e.g., construction, service vehicles).
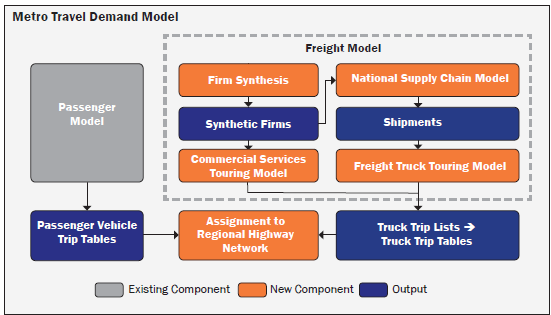 Source: Metro.
Figure 14. Diagram. Model design framework.
Specific Lessons Learned/Transferable Lessons
The project developed a freight flow model for a region encompassing two MPOs (Metro and the Southwest Washington Regional Transportation Council) and produced detailed truck and freight forecasts that will support decisionmaking both within the two MPOs as well as in neighboring cities and smaller municipalities throughout the region. The project team shared a number of lessons learned during the process of developing this model:
- Establishment survey recruitment was more difficult than expected. Even with robust outreach, the team did not meet the original sample size target.
- The smartphone application for data collection provided high-quality data, but presented challenges. The requirements for registration, for seven days of data, and concerns about distracted driving likely limited participation.
- Vehicle monitoring system (GPS) data was useful as behavioral data; however, this data often requires cleaning and standardization.
- Companies were willing to share vehicle data. This is an improvement over previous experiences where companies were hesitant to share data they believe to be proprietary.
Next Steps in Research
The Metro project team has identified several next steps it wishes to complete with its new model:
- Conducting further research to identify time-sensitive shipments (e.g., certain factory and construction site deliveries, some food shipments) and modify the freight model to enable tracking them.
- Improving long-haul mode choice by introducing additional attributes on the supply chain network.
- Assigning additional modes to the local freight network (e.g., direct rail shipments to local businesses; trains into, out from, and through the region) to enable analysis of rail/highway conflicts.
Wisconsin Department of Transportation
Project Overview/Need
In 2013, the Wisconsin Department of Transportation (WisDOT) began updating its statewide travel demand model. WisDOT was interested in identifying how a more advanced freight model could support transportation planning and decisionmaking, and what benefits could be derived if future updates to the freight component of the model were behavior-based rather than trip-based. A main objective of this project was to determine the utility of behavioral-based freight modeling in Wisconsin when compared to traditional, trip-based freight modeling. Other objectives were to:
- Address deficiencies in WisDOT's current statewide freight forecasting practice.
- Represent characteristics of firms, shipments, supply chains, and distribution channels.
- Describe trip chaining with a single truck tour making multiple stops for delivery of goods.
Secondary objectives for this project were to:
- Improve and expand WisDOT knowledge on freight activity in the State.
- Standardize analysis through tools and models.
- Serve as a channel to discuss freight-related policies, needs, and issues with the State's freight stakeholders.
Modeling Innovations to Meet Need
As a foundation for the new behavioral-based model, the team used a model previously developed for the Chicago region through an FHWA Broad Agency Announcement (BAA) program. The model consisted of three components as listed below and shown in Figure 15:
- Supply Chain and Logistics-Based Freight Model – long-haul movements.
- Tour-Based Truck Model – short-haul local movements.
- Service-Sector Model – non-freight carrying movements (e.g., construction/delivery vehicles).
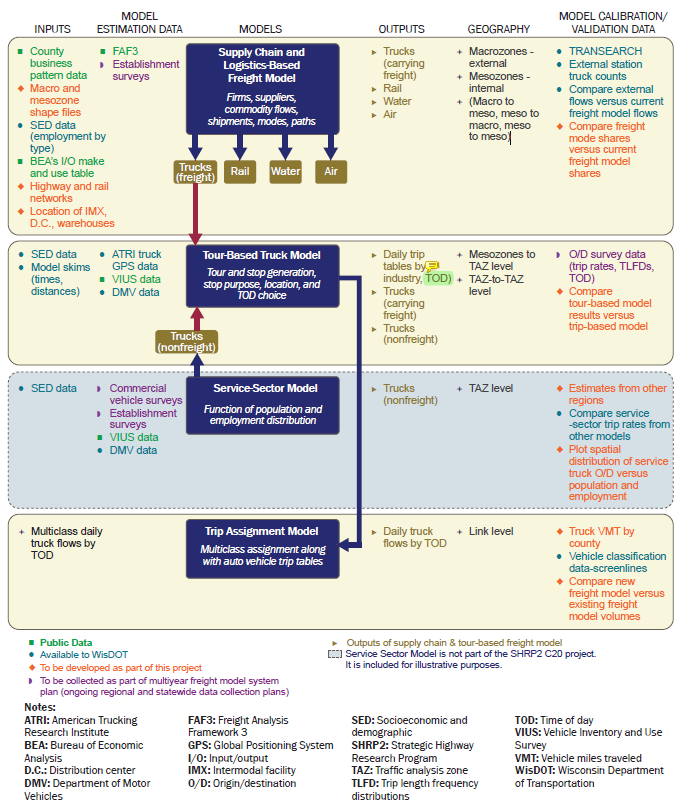
Source: Wisconsin Department of Transportation.
Figure 15. Diagram. Behavior-based model framework.
Since WisDOT only sought to allocate firms to the county level, the supply chain model did not account for sub-county trips. In addition, the project team found that, in this implementation, the addition of a truck touring model increases daily truck trips less than 4 percent. They determined that the value added by including the truck touring model in the Wisconsin application was not worth the effort it took for the necessary origin and destination conversion from commodity type to truck trips. As such, the truck touring model was not used in the final implementation of this project.
The project team developed six scenarios to compare the proof-of-concept with the traditional freight model component:
- Enactment of truck size and weight increase legislation.
- Introduction of a fulfillment center.
- Reintroduction of an intermodal rail terminal.
- Construction of a rail-truck trans-load facility serving a large trucking company.
- Construction of a new distribution center.
- Abandonment of a rail line in northern Wisconsin.
The project team evaluated each scenario using the behavior-based model developed and the existing trip-based statewide model.
Lessons Learned/Transferable Lessons
As a result of this effort, the project team was able to develop an operational, behavior-based freight model and compare both the new and existing models in six real-world scenarios to determine the effectiveness of each model. Outcomes of this comparison showed WisDOT that behavior-based models excel at evaluating mode shifts given a change in transportation system intermodalism, but that these models, as currently implemented, do not provide much advantage over traditional models in evaluating changes in truck volume.
Updates to the BAA behavior-based freight model code for this project had a positive impact for other agencies that want to use the same code. The output of this project includes updated code that can be more easily passed to another agency wishing to develop and implement behavior-based freight models.
In addition to the above, the WisDOT team shared the following specific lessons, based on the process and outcomes of this project:
- Allow sufficient time and resources to personalize and adapt a model, even if using an off-the- shelf solution. Changes were required to both the supply chain model and the truck touring model, despite their successful use in Chicago.
- Benchmark new models against existing models to evaluate the benefits of making a shift. Existing models may offer superior results in specific situations.
- Engage the MPO and local partners throughout the model development process.
Next Steps in Research
While the implementation of a supply chain choice model did provide more detailed changes in mode share, the need for such changes by WisDOT are minimal. Therefore, WisDOT has no specific next steps with regard to behavior-based freight modeling. However, refinements to the BAA model advance the state of the practice in behavior-based models toward a national model that provides true transferability between agencies with limited customization needed.
2 Federal Highway Administration (2017). SHRP2 Solutions: Freight Demand Modeling and Data Improvement (C20). Washington, DC. Retrieved from https://www.fhwa.dot.gov/goshrp2/Solutions/Available/C20/Freight_Demand_Modeling_and_Data_Improvement. [ Return to note 2. ]