Freight Demand Modeling and Data Improvement Handbook
Chapter 2. Data Innovations
There were seven SHRP2 C20 projects related to data improvement as part of the Implementation Assistance Program (IAP). The seven participants include:
- Capital District Transportation Committee—New York.
- Delaware Valley Regional Planning Commission—Pennsylvania.
- Florida Department of Transportation.
- Mid-America Regional Council—Missouri.
- South Dakota Department of Transportation.
- Washington State Department of Transportation.
- Winston-Salem Metropolitan Planning Organization—North Carolina.
Each implementer has a unique desired need, approach, and outcome. The concepts and innovations developed by the implementers provide potential building blocks for tackling freight planning issues at multiple scales, and each summary provides the challenges and benefits that may assist others in implementing similar data improvement approaches.
The innovations associated with the data projects are described below. They have been organized to assist the users of this handbook in determining the applicability to their needs quickly. This provides an overview of the project with some detail to provide the appropriate level of information for determining the appropriateness of the method. More detail is provided in the individual case studies prepared for each project. Detailed project reports prepared by each project team can be consulted for in-depth discussion of each project. More information about these projects can be found on the SHRP2 C20 website.1
The SHRP2 Freight Demand Modeling and Data Improvement Strategic Plan identified several decisionmaking needs and gaps in freight planning, data, and modeling. Table 4 shows the seven IAP data projects compared against those needs and gaps, illustrating the areas where the projects are breaking the most ground to address those gaps.
| Decisionmaking Needs | CDTC | DVRPC | FDOT | MARC | SDDOT | W-S NC | WSDOT |
|---|---|---|---|---|---|---|---|
| Standardized data sources with common definitions. | |||||||
| Statistical sampling of truck shipments. | |||||||
| Standardized analytic tools and applications. | |||||||
| Inclusion of behavior-based elements into freight models. | |||||||
| Data development to understand the nature, volume, and trends of intermodal transfers. | |||||||
| Industry-level freight data development at a sub-regional level and within urban areas. | |||||||
| Incorporation of local land use policies and controls for better local forecasting accuracy. | |||||||
| Development of a correlation between freight activity and various economic influences and macroeconomic trends. | |||||||
| Better accuracy of freight forecasts. | |||||||
| Development of a process to routinely generate new data sources and problem solving methods. |
Principles and Considerations for Local Data Collection
Although each data collection project was unique, each project involved the collection and use of new data, allowing several general principles to emerge from the research. Three of these general principles are addressed below.
Development of a Regional Freight Stakeholder Group
Nearly every project in the group of seven included the establishment or use of an existing freight stakeholder group. These groups performed many tasks, including project oversight and providing expert level input on specific issues. The early development of a freight stakeholder group will benefit any new freight data development project. Additionally, the stakeholders will lend weight and importance to any data development effort. They will likely be influential in obtaining assistance from agencies and companies that are requested to participate in the effort in some capacity.
Administering Surveys to Local Freight Producers and Consumers
Many of the data projects involved large data collection efforts that were dependent on surveys to gain input from freight-related businesses and others. Poorly designed or deployed surveys produce notoriously poor response rates. The experiences of the seven data projects contain lessons that can maximize the return on any surveys conducted and maximize the data collected.
Developing New Data Sources
The data projects clearly show that developing new data sources is a time-consuming and difficult task. Freight data is often fragmented and uncoordinated. Much of it was developed for purposes other than freight analysis and so contains data standards that vary widely and may make transformation of the data into usable freight information difficult. For these reasons, choose data sources wisely. Prioritize data sources that can be most readily transformed into usable information and used for the greatest number of analyses and purposes. Keep, however, a list of alternate data sources as well. A preferred source may turn out to be more difficult to use than originally thought and an alternate source may be needed.
Capital District Transportation Committee—New York
Project Overview/Need
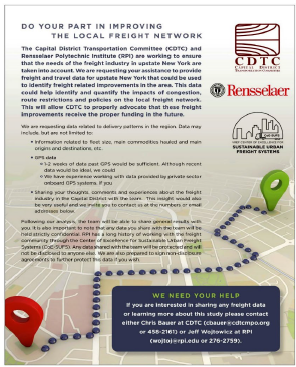
Located in Albany, New York, the Capital District Transportation Committee (CDTC) is the designated metropolitan planning organization (MPO) for the Albany-Schenectady-Troy, New York, metropolitan area. Surrounded by major highway, rail, and maritime routes, this region serves as a transportation crossroads to many industries and is home to several major freight generators. CDTC desired to collect, integrate, and maintain a variety of freight-related data from multiple sources to use for its planning purposes. As previously discussed, data collected for freight planning often has one or more problems including: fragmentation, inconsistencies in geographic coverage, lack of disaggregated data, and lack of shipper-specific information. The purpose of this project was to identify existing freight data at the national, State, and local levels as well as to develop new data sources from partner providers. CDTC then designed a business process to integrate all the data and keep it continually updated.
Data Innovations to Meet Need
CDTC developed a geographic information system (GIS)-based dynamic freight database as a central location to house freight-related data that the agency can use for future freight planning activities. The database contains data that has already been processed and integrated and is usable for any level of aggregation.
Existing datasets that were collected and integrated into the database included:
| Data | Source |
|---|---|
| Commodity Flow Survey (CFS) Data | USDOT/BTS |
| Employment Data (ZIP Code Business Patterns) | US Bureau of Labor Statistics |
| Freight Analysis Framework OD Data | USDOT/FHWA |
| Smart Location Data | EPA |
| 511 NY Data Feed | NYSDOT |
| Capital Region Updated Network Data (with Volume) | CDTC |
| Census of Vehicles | USDOT |
| Economic Data | NYS GIS Clearinghouse |
| E-ZPass Data | NYSTA |
| HERE Travel Time Data | FHWA |
| IHS Global Insights TRANSEARCH | CDTC |
| MIST Speed and Volume Data | CDTC / NYSDOT |
| Oversize/Overweight Permitting Data | NYSDOT |
| Truck Crash Data | NYSDMV |
| Truck Traffic Counts | NYSDOT |
| Weigh-In-Motion (WIM) Data | NYSDOT |
Source: Capital District Transportation Committee
Figure 1. Image. Data collection flyer.
The project team also collected new data to integrate into the database:
- To collect truck trip data, the project team conducted interviews with freight stakeholders in the area and received GPS data of the firms' truck trips. This data often required the team to sign non-disclosure agreements.
- To get a better understanding of the business practices of freight stakeholders in the region, the project team conducted interviews with manufacturers, retailers, supermarkets, and transportation service providers.
The new data was used to develop several models to describe goods movement in the region, including models focused on freight generation, freight trip generation, and service trip generation.
Lessons Learned/Transferable Lessons
CDTC's effort yielded several lessons that can be applied to similar future projects.
- The majority of the datasets are confidential, requiring extensive dialog with owners to ensure sharing. This is true of data from public agencies and especially true when collecting data from private shippers and freight stakeholders. Non-disclosure agreements were required in this project.
- Databases vary in units of measure, aggregation methods, and other factors. It takes a long time to clean and process the data before it can be released. Identifying sources and beginning the process of acquiring the data early is important.
- The creation of a central database with usable, processed data is essential to maximize the usefulness of the data. New studies and research are easier with immediately usable data. Data is always changing and must continually be refreshed. An established business process to update data is an important aspect of having usable data.
Next Steps for Research
The development of additional datasets is the next step needed. The central database allows this new data to be added as it is developed.
Delaware Valley Regional Planning Commission—Pennsylvania
Project Overview/Need
Delaware Valley Regional Planning Commission (DVRPC) serves as the MPO for Philadelphia and its nine surrounding counties. DVRPC had previously founded the Delaware Valley Goods Movement Task Force (DVGMTF) to guide and provide input to freight planning in the region. In 2013 DVRPC released PhillyFreightFinder, a centralized data clearinghouse and corresponding online mapping application. DVRPC is constantly seeking to improve the tool and identified several improvements to make as part of the SHRP2 process.
Data Innovations to Meet Need
Through this project, DVRPC updated and improved its core datasets, updated the interactive web-based mapping tool, and developed a complete set of open source documentation and generic templates to enable other agencies to create and implement a similar freight data clearinghouse and website for their regions. To complete this project, the project team:
- Identified and evaluated data sources.
- Developed methods to combine datasets.
- Automated the data importing and integration.
- Established a standard portfolio of core freight datasets that support freight planning, operations, and project prioritization for both the public and private sectors.
All data collected during this project were integrated into DVRPC's PhillyFreightFinder to provide a comprehensive product used by a variety of freight stakeholders, including the general public, municipal officials, economic development agencies, and private industry partners.
The first project task was to revise the freight network within PhillyFreightFinder for consistency with new datasets. Once the network was revised, the following new datasets were acquired, cleaned, and added to the database. Table 6 through Table 9 highlight this data.
| Data | Source |
|---|---|
| Classification Counts | Delaware Valley Regional Planning Commission |
| Weigh-in-motion Truck Counts | Pennsylvania Department of Transportation |
| Port Gate Turn Counts | Terminal Owner/Operators |
| Annual Vessel Report | Maritime Exchange |
| Train Counts | Class I Railroads |
| Data | Source |
|---|---|
| National Establishment Time-Series (NETS) | Walls & Associates |
| County Business Patterns | U.S. Census Bureau |
| Freight Finder | IHS Global Insight |
| Data | Source |
|---|---|
| Freight Analysis Framework | FHWA |
| TRANSEARCH | IHS Global Insight |
| Data | Source |
|---|---|
| Public Use Waybill Data | Surface Transportation Board |
| USA Trade Online | U.S. Census Bureau |
| U.S. Energy Information Administration (EIA) Company Level Imports | U.S. EIA |
With the new data collected, the project team added three tools to PhillyFreightFinder that took advantage of the new data: the Maritime Indicators Tool, the Highway Performance Tool, and the County Profile Tool.
The Maritime Indicators Tool
The Maritime Indicators Tool (Figure 2) tracks maritime activity in the region and communicates performance.
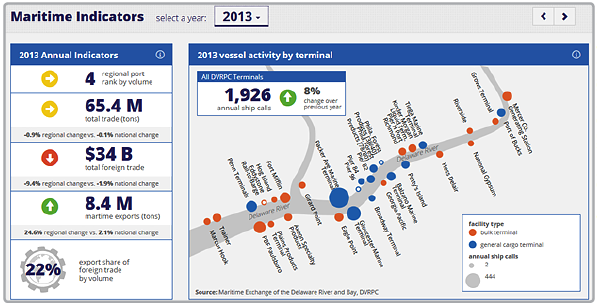
Source: Delaware Valley Regional Planning Commission
Figure 2. Image. Maritime Indicators Tool.
The Highway Performance Tool
The Highway Performance Tool (Figure 3) displays the region's truck travel time index and average truck speed.
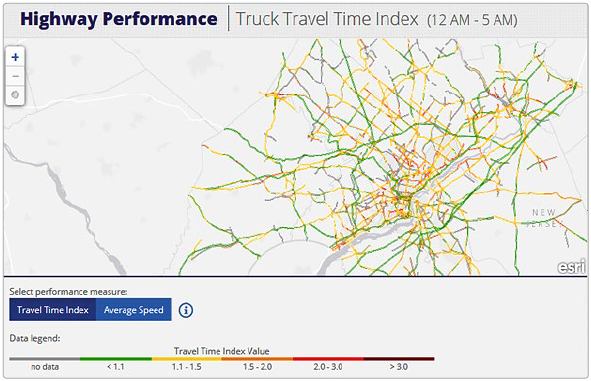
Source: Delaware Valley Regional Planning Commission
Figure 3. Image. Highway Performance Tool.
The County Profile Tool
The County Profile Tool (Figure 4) allows users to explore freight centers by displaying employment, establishment (i.e., type of businesses), and trade data for each of the nine DVRPC counties.
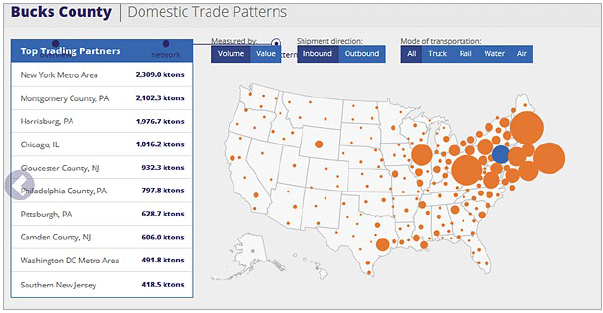
Source: Delaware Valley Regional Planning Commission
Figure 4. Image. County Profile Tool.
As a final task of this project, the project team developed OpenFreightApp, an open source version of PhillyFreightFinder. The OpenFreightApp includes documentation for various integration and use options, and all source material is publicly available for download and replication by any user. This open source version of the App creates true transferability to any other agency that wants to collect data and track performance monitoring the way that DVRPC does.
Lessons Learned/Transferable Lessons
DVRPC's efforts resulted in several lessons for its future work and for other agencies trying to replicate its efforts.
- First, building a good relationship with potential partners and maintaining open communication among all partners is critical for data collection. Good relationships established early will create a lasting partnership for data sharing.
- Second, identifying duplicative or redundant data sources during the identification stage can be beneficial. If one data source becomes unusable for any reason, alternatives are already identified.
- Finally, identifying, obtaining, cleaning, and integrating data sources into an existing database is a lengthy process. Prioritize the best data and focus efforts there. Data that is cleanest, requires the least manipulation, is usable to the greatest number of projects and analyses, or provides the most value in any way should be the highest priority for inclusion.
Next Steps for Research
The project positioned DVRPC to pursue a number of future activities.
- DVRPC is holding additional meetings with local planning partners and other users to discuss the enhanced application and potential uses for the tool.
- PhillyFreightFinder's effectiveness depends upon updates to the data it provides. The DVRPC project team established a plan to regularly refresh its datasets and will review publicly available data annually. Automation developed to parse and import data during the project will also help minimize the level of effort required to keep the information current.
- The application will be improved with the addition of other data types. DVRPC plans to add additional characteristics that help describe the freight facilities in greater depth. The team also intends to add rail freight activity and county-level import/export flows.
- The freight network will be improved by consolidating primary freight and regional model networks data into one system with truck counts and NPMRDS travel time. The consolidated network is expected to aid in the development, calibration, and use of a freight model for the region.
Florida Department of Transportation
Project Overview/Need
Petroleum from Port Everglades accounts for nearly 20 percent of all energy consumption in Florida, and represents all petroleum products (e.g., crude oil, gasoline, diesel, propane, etc.) consumed in the four counties surrounding the port. While Port Everglades tracks the volume of petroleum transported in and out of the port, it does not document the delivery locations. In addition, the Florida Department of Transportation (FDOT) often uses vehicle detection sensors to classify vehicles by length, but this classification data provides little information on the type of commodity being transported, including petroleum. Additional data on the makeup of traffic, routes used by petroleum shipments, and petroleum delivery locations would allow FDOT to better plan for enhanced freight mobility.
Data Innovations to Meet Need
FDOT District 4 combined emerging technologies for automated vehicle recognition and conventional data sources to better understand the supply and demand chain for petroleum in South Florida. The project team conducted a literature review to identify emerging devices and technologies that can automatically detect and classify tanker trucks and tanker rail cars. Through this effort, the project team identified 15 potential detection technologies. Of the 15, four were determined to have the highest potential for meeting the project's needs:
- Video image processing.
- Laser scanner/light detection and ranging (LiDAR).
- License plate recognition.
- Transponders.
After weighing the benefits and drawbacks of each technology, the project team selected video image processing and license plate recognition for field testing.
Source: Florida Department of Transportation
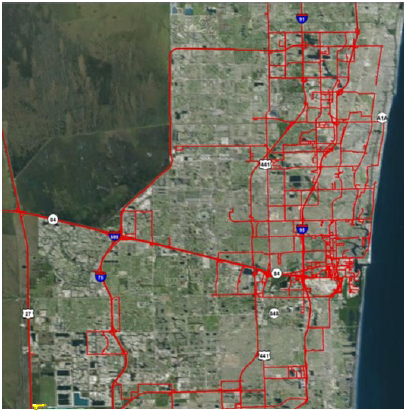
Figure 5. Image. Tanker truck routes in Broward County, Florida.
The project team felt that LiDAR technology has high potential, but the technology needs further improvement before it would be viable for detecting tanker trucks. The use of transponders was feasible; however, maintaining cooperation and coordination between the various entities providing the transponder data could be difficult during the course of the study.
Results of the field tests shed light on the application of each technology for large-scale deployments. License plate recognition posed many challenges. License plates can be obstructed by things like weather and other vehicles. Different States have different license plate standards that can make positive recognition difficult. Also, due to the interstate nature of freight, a national license plate database and multistate cooperation is required. Consequently, these problems prevented the project team from identifying the registration locations and delivery locations for many tanker trucks using license plate recognition technology.
Video analysis proved to be the most effective detection method for the project's purpose. The project team had 46 hours of field video analyzed through video image processing. While the video image processing algorithms and procedures are proprietary and were not available to the project team to review, the team found the results to be of good quality.
The project team also conducted a petroleum flow analysis to document petroleum delivery routes and locations. For this analysis, the project team used fuel tax records to plot the distribution of petroleum products on varying geographic scales, developing estimates on the number of truck trips in each micro analysis zone for use in travel demand modeling. Analyzing truck probe data allowed the project team to identify 807 trip chains from two months of data. Data on these trip chains were prepared in the form of a GIS shapefile that included trip-level information such as trip length, trip time, and origin/destination land use description. Finally, driver surveys provided additional validation to the analyses.
Lessons Learned/Transferable Lessons
Outreach and coordination was a significant focus of this project. Through close coordination between the project's steering committee and the regional partners, the project demonstrated that collaboration between public and private sector stakeholders resulted in an overall better understanding of the individual segments of the petroleum transport community, including shippers, carriers, and customers of the supply and demand chain.
This project conducted a thorough review of emerging technologies to classify tanker trucks and tank rail cars, evaluated each to determine which of the technologies had the highest potential for success, and tested two technologies. Findings from the deployment show that video image processing and license plate recognition can support the data collection process for tanker trucks and tanker rail cars. Of the two, video image processing was better suited to the project's requirements. Improvements are still needed, however, before these technologies can be successfully deployed on a large scale for this purpose.
Next Steps for Research
The project team has identified several potential opportunities to advance research in the area of automated freight data collection and to enhance FDOT's ability to plan for freight. One characteristic of the video image processing algorithms is that accuracy is often improved by a larger data sample size; obtaining additional video from around the State would continue to improve video image processing capabilities. Collecting more recent fuel tax data from Florida Department of Revenue would allow FDOT to fill the identified data gaps and better document the petroleum origin-destination pattern in the region.
Mid-America Regional Council—Missouri
Project Overview/Need
When congestion delays a freight shipment, the extra labor cost incurred due to the delay is either passed on to the consumer or absorbed by the freight carrier. To date, however, the specific link between freight shipment costs and congestion has not been detailed. As such, it is difficult to understand the direct economic impacts of congestion on freight carriers and other related businesses.
Data Innovations to Meet Need
The availability of new datasets, such as FHWA's National Performance Management Research Data Set (NPMRDS) and the private sector Real-time Freight Intelligence (RTFI) commercial freight waybill dataset, allows researchers to begin to calculate the impact of congestion on cost of freight movement. Together, these datasets provide detailed and specific cost information on freight shipments as well as average travel times along major highways. This project developed an analytical approach to identify common commodities and shipment routes originating in the MARC region, extracted pertinent information from freight waybill data, and calculated performance measures for selected shipment routes to understand how highway congestion affects freight shipment costs.
The NPMRDS data is large and not unified. To most efficiently extract performance data from the NPMRDS data for origin and destination pairs, the project team received access to the Regional Integrated Transportation Information System (RITIS) of the University of Maryland's Center for Advanced Transportation Technology (CATT) laboratory. RITIS provided the project team with a tool pre-loaded with all relevant NPMRDS data and allowed for easy route entry and performance measurement calculations. The project team next used RITIS to complete a performance summary analysis and develop a congestion profile for each route. The performance measures selected from the RITIS analysis were buffer index, planning time index, travel time index, average travel time, and average speed.
Findings from this project indicate some correlation between congestion and freight shipment costs as shown in Table 10. The project also identified potential improvements that will more clearly identify the link between congestion and cost.
| Measure | Destination | Percent Difference | |
|---|---|---|---|
| Detroit, MI | Cleveland, OH | ||
| Cost | |||
| Average cost per ton | $178.80 | $114.60 | 35.9 |
| Median cost per ton | $164.43 | $111.96 | 31.9 |
| Percent difference: average vs. median | 8.73% | 2.36% | N/A |
| Average cost per ton-mile | $0.25 | $0.15 | 39.3 |
| Median cost per ton-mile | $0.23 | $0.15 | 37.8 |
| Percent difference: average vs. median | 4.93% | 2.36% | N/A |
| Performance | |||
| Buffer index | 0.24 | 0.19 | 19.9 |
| Planning time index | 1.36 | 1.3 | 4.2 |
| Travel time index | 1.17 | 1.16 | 1.3 |
| Average travel time (minutes) | 732.6 | 804.1 | N/A |
| Average travel speed (mph) | 58.69 | 59.49 | -1.4 |
| Trip distance (miles) | 710 | 800 | N/A |
Lessons Learned/Transferable Lessons
The method developed to measure highway performance and tie it to freight shipping costs is transferable to any other area provided that waybill data is of a sufficient sample size and that shipping in the area primarily occurs on the National Highway System. Minor arterials and other secondary roads are not included in the NPMRDS dataset.
While the RTFI database is current and vast, the degree to which data included in this database represent all freight shipments is unknown. The NPMRDS dataset is very large, and the performance data is separate from the highway network data, requiring the user to complete an analytical step to link the two. Given the length of routes studied in this project, some routes typically required several hundred million data records, significant computational time, and considerable processing power. Fortunately, the project team was able to access RITIS at the University of Maryland's CATT laboratory to facilitate the capture, processing, and analysis of the NPMRDS data.
Next Steps for Research
This project focused on specific commodities and trip pairs. Additional commodities, origins, and destinations can be researched in subsequent studies. More detailed analyses to understand the cause of congestion and, ultimately, to plan improvements to those routes would naturally follow. Finally, findings from this project can be further explored to understand whether it is worthwhile to include the cost of congestion as a performance measure in regional freight travel demand models.
South Dakota Department of Transportation
Project Overview/Need
The agriculture industry has a $20.9 billion impact on the South Dakota economy. To ensure that agricultural products can be moved efficiently to market, the South Dakota Department of Transportation (SDDOT) routinely makes infrastructure investments. SDDOT, however, does not use agriculture production data to assist in making these investment decisions. Given the significance of the agriculture industry in the State and corresponding volume of related goods moved throughout the State, it is important to understand the impact of agricultural production and trends on the transportation system.
Data Innovations to Meet Need
The objective of this project was to demonstrate the feasibility and utility of collecting and combining agricultural data with existing transportation data sources to inform transportation planning decisions. Production and trends should be able to help identify those locations that are most critical to agricultural freight transportation.
The project began with stakeholder interviews, with the interviewees equally split between those with an agricultural focus and those with a transportation focus. Using the interviews as an input, the project team defined data requirements for the agricultural data. The agricultural data sources settled on as being desirable and reliable included:
- United States Department of Agriculture's (USDA) National Agricultural Statistics Service (NASS).
- Economic Research Service (ERS).
- Agricultural Marketing Service (AMS).
The USDA's NASS provides statistics across an array of agricultural topics, such as crops, livestock, related commodities, and processed products. The NASS also offers a geospatial data product, the Cropland Data Layer (CDL), which is generated annually to provide a geo-referenced, crop-specific land data layer. On the whole, the NASS provides fully robust information for common crops. In addition, the USDA's ERS offers a number of data sets and tools focused on crop and livestock production, including forecasts. Finally, the AMS provides access to data on agricultural-related topics such as standards and inspection, prices, volumes, transportation, and weather impacts.
To conduct the demonstration project, the project team first synthesized the agriculture and transportation data. The main data sources for this effort were the USDA NASS crop data GIS dataset on the land uses made by farmers in a calendar year and State and local transportation infrastructure data. The two data types were overlaid to determine expected crop yield, access to State highways or rail yards, and percentage of paved roadway miles per township within the demonstration area.
Next, the trip calculations were developed to understand the movement of goods within the study area. Crop yields were converted into truck trips using equivalent single axle loads (ESALs) and estimated per township and per quarter (for a baseline year of 2014). The USDA ERS forecast includes crop acres, crop yields, and crop uses up to the year 2024. Together, this information was combined with historical trends available from USDA's NASS to forecast ESALs per township, per quarter in 2024.
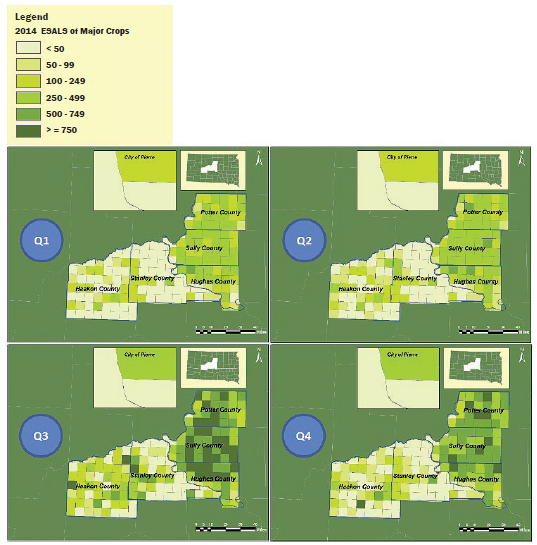
Source: USDA National CDL data, USDA, NASS data, ESRI and SDDOT GIS data, Agar WIM data, UGPTI, North Dakota Strategic Freight Analysis – Truck Size and Weight Issues in North Dakota, Final Report for North Dakota Department of Transportation, July 2007, David L Huft, Considerations for Imposing Local Load Restrictions, SDDOT, Research Note, last updated February 12, 2014, and UGPTI and Cambridge Systematics Analysis.
Figure 6. Image. Equivalent single axle loads of major crops per township per quarter.
By combining this new agricultural data with data about the transportation system within each township, the project team also assessed each township in the demonstration area for agricultural freight demand and transportation quality. As shown in Figure 7, townships were given one of four ratings:
- High Freight Demand, Poor Transportation Quality.
- High Freight Demand, Good Transportation Quality.
- Low Freight Demand, Poor Transportation Quality.
- Low Freight Demand, Good Transportation Quality.
These ratings can be used to direct agricultural and transportation improvement to locations with the greatest need.
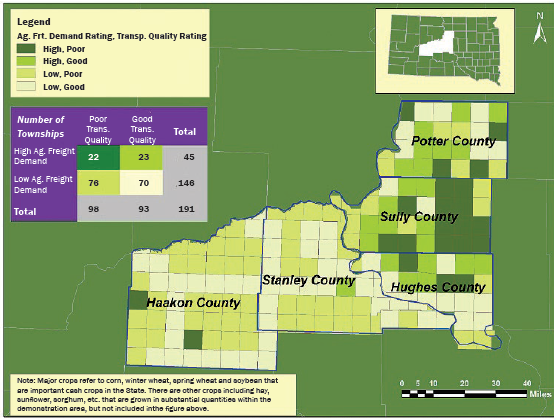
Source: USDA National CDL data, USDA, NASS data, ESRI and SDDOT GIS data, Agar WIM data, UGPTI, North Dakota Strategic Freight Analysis – Truck Size and Weight Issues in North Dakota, Final Report for North Dakota Department of Transportation, July 2007, David L Huft, Considerations for Imposing Local Load Restrictions, SDDOT, Research Note, last updated February 12, 2014, and UGPTI and Cambridge Systematics Analysis.
Figure 7. Image. Evaluation of agricultural freight demand and transportation quality.
Lessons Learned/Transferable Lessons
Although many of the details of this project are specific to South Dakota and the selected demonstration area, the approach and many of the publicly available data sources are scalable and transferable to other areas of the United States where there is significant land dedicated to agricultural uses. The spreadsheet tool developed as part of this project further facilitates the project's transferability.
Specific limitations encountered included the inability to collect data on truck counts and roadway conditions on local roads, which prevented the project team from completely understanding truck movement on the local system. The project team was able to overcome this challenge by using the existing data sources and estimating number of trucks per township using ESALs rather than number of trucks per specific roadway.
Additional data on the destination of agricultural products produced on a certain plot of land and the timing of movements would also help the method developed to be more accurate and helpful in understanding transportation impacts.
Next Steps for Research
The data gaps for the local transportation system identified through this project have spurred future action items for SDDOT. SDDOT is now pursuing options to strengthen data collection at the local level as well as monitor other innovative data sources that could provide coverage on the local transportation system.
Washington State Department of Transportation
Project Overview/Need
Within the transportation sector, several opportunities exist to reduce greenhouse gas emissions, including converting from traditional to alternative fuels and installing diesel retrofits, emission treatment technologies, or idle reduction devices. However, planners traditionally had little insight into how State policy scenarios aimed at reducing freight emissions would affect the freight system. This study aimed to collect both qualitative and quantitative data from two of the State's major supply chains: wheat production and food delivery. The ultimate goal was to apply the resulting insights into actionable methods to reduce carbon pollution in Washington State, as directed by the governor's Executive Order 14-04 from April 2014.
Data Innovations to Meet Need
A literature review was conducted to identify key actors within the supply chains and provide insight into the data collection plan. The illustrations in Figure 8 show the typical food distribution supply chains for wheat and other foods.
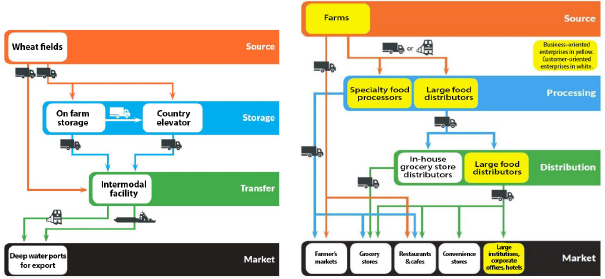 Source: Washington State Department of Transportation
Figure 8. Diagram. Typical Washington State wheat supply and food distribution chains.
Qualitative interviews were conducted to understand the wheat- and food-related supply chain responses to market conditions and potential policy changes aimed at reducing freight emissions. Surveys were developed to explore hypothetical policy and market scenarios focused on financial incentives/ disincentives for alternative fuels, changes in fuel costs, and changes to alternative fuel technologies. Finally, truck counts were conducted at grocery stores in the Puget Sound area to understand truck behavior at the user end of the food supply chain.
Lessons Learned/Transferable Lessons
Having an established relationship with the individuals or organizations to be interviewed or surveyed is important. Conducting "cold calls" and initially contacting organizations via e-mail often ended up as a dead end or took several weeks to identify the correct individual to interview. The project team found more success with in-person interviews, as those interviewed were more likely to elaborate on their responses and volunteer additional information. In addition, holding the interviews at the interviewee's facility often provided the project team with the ability to tour the facility and gain additional insight into the company's operations.
Respecting the interviewee's time and privacy is important. Interview questions should be direct and easily answered without needing to look up data. Interview responses should be anonymized. Much of the valuable information came from open-ended questions, so allowing interviewees to go off-script as they feel comfortable can provide valuable knowledge.
The use of human data collectors to collect information on food deliveries to grocery stores allowed more detail and context than automated collection, but also entails the possibility of a higher margin of error.
Next Steps for Research
The collection of food delivery data offers a ripe arena for automation. The project team is developing a data collection approach using a laser scanner to overcome some of the data collection challenges of capturing truck counts.
The initial surveys performed for the project shed light on supply chain actors' thoughts with regard to changes due to State policies regarding alternative fuels. However, more research is needed to quantify effects of these type of policies on freight movement in the State.
Winston-Salem Metropolitan Planning OrganizationNorth Carolina
Project Overview/Need
Major industries in the Piedmont region of North Carolina have shifted from the textile industry to freight and logistics. Agencies such as the Winston-Salem Metropolitan Planning Organization (MPO) have identified freight transportation goals and needs for their metropolitan planning areas. While transportation planners are turning to modeling to address these needs, the existing travel demand model, the Piedmont Triad Regional Model (PTRM), was not sufficiently describing freight flows in the region.
Data Innovations to Meet Need
This project identified freight model design and future data collection needs for the region and identified, tabulated, and surveyed freight facilities to support development of a tour-based truck model.
The model design was accomplished with the assistance of an experienced modeling consultant who helped focus the team on specific model alternatives, their benefits, and their limitations.
Freight node identification was accomplished using a multi-step process. An initial list was created using chamber of commerce data, which was verified with Internet research and the InfoUSA database. Missing freight nodes were identified through additional Internet research, GIS databases, and aerial image reviews. The identified nodes are shown in Figure 9.
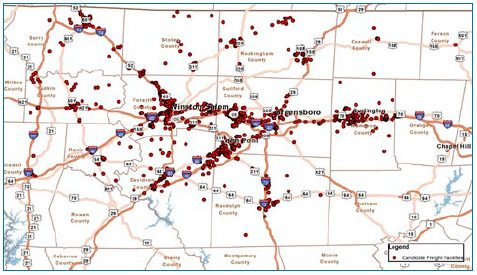
Source: Winston-Salem Metropolitan Planning Organization
Figure 9. Map. Freight facilities identified in the region.
Surveys of some of the identified freight nodes were conducted to verify node information as well as to gain additional insights into freight operations and characteristics. One of the additional data points that the surveys created was a correlation between daily truck trips (i.e., number of trucks entering the facility per day) and the number of truck bays present at a freight facility). This insight gave planners a technique to develop a rough estimate of truck trips that may start or end at a given facility.
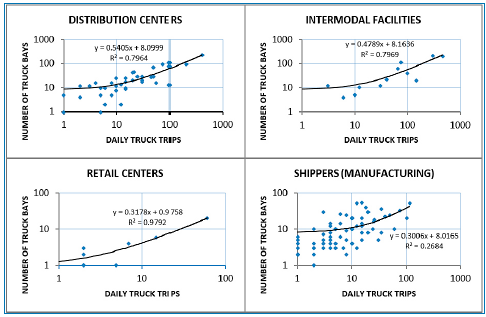
Source: Winston-Salem Metropolitan Planning Organization
Figure 10. Graph. Relationship between daily truck trips and number of truck bays.
The final model development step in this project was the recommendation of a set of data fields for a future phase of modeling. These data fields were informed by interviews with three MPOs well known for their advanced efforts in freight modeling: Atlanta Regional Commission (ARC), the San Diego Association of Governments (SANDAG) and the Maricopa Association of Governments (MAG). Recommended data fields include:
| TYPE | DATA FIELDS |
|---|---|
| Facility |
|
| Travel |
|
Lessons Learned/Transferable Lessons
The key lesson learned through this project is the caution that must be taken when relying on a single dataset. The initial approach to populating the freight node database relied on freight facilities listed in the chamber of commerce data available from each of the 11 counties in the Piedmont Triad region. The project team was able to increase the number of records in the database by nearly 50 percent from the initial iteration because it expanded its search to include additional data sources.
The project team learned several lessons with regard to the data collection process. Initial survey efforts fell far short of expectations. It was often difficult to reach the facility's contact on the initial phone call, and several follow-up phone calls were typically required to reach the appropriate individual. The project team made modifications to the survey process to improve the response rate by revising the survey to include only the most valuable information and, where possible, pre-populating the survey for each freight facility. Instead of attempting to schedule a time and date for the survey, the project team visited each facility unannounced, making contact with personnel at the site to determine if an appropriate individual was available to complete the survey. If an appropriate person was not available, the project team left a self-addressed and stamped envelope along with the pre-populated survey for the appropriate individual to fill out and return to the project team.
Next Steps for Research
Creation of a regional freight model includes several clearly defined steps. The next step in the process is the actual creation of the freight model. The third and final step will be the collection of additional local freight data to refine the model.
1 Federal Highway Administration (2017). SHRP2 Solutions: Freight Demand Modeling and Data Improvement (C20). Washington, DC. Retrieved from https://www.fhwa.dot.gov/goshrp2/Solutions/Available/C20/Freight_Demand_Modeling_and_Data_Improvement. [ Return to note 1. ]