Approaches to Presenting External Factors with Operations Performance MeasuresCHAPTER 2. ANALYSIS OF EXTERNAL FACTORSThis chapter summarizes a statistical analysis that was conducted to identify external factors that are closely correlated with actual system performance measures. The objective was to identify these key external factors, such that State and local agencies can include their corresponding external factor data in their own performance monitoring and reporting efforts. POSSIBLY INFLUENTIAL EXTERNAL FACTORS FOR ANALYSISThe project team identified a list of possibly influential external factors for which data was available on a recurring basis. This list of possibly influential external factors included the following general categories:
Table 1 lists 32 possibly influential external factors (grouped in the above four categories) that were included in the statistical analysis. Table 1 also lists the agency source for external factors data, as well as the reporting frequency. The following sections contain more detailed information on each of the 32 possibly influential external factors, including hyperlinks for obtaining the original source data. OVERALL ANALYSIS APPROACHIn the statistical analysis, these 32 possibly influential external factors were compared to three system performance measures as calculated in FHWA's Urban Congestion Report (UCR) program: 1) travel time index; 2) planning time index; and 3) congested hours. More details on these performance measures (including data sources and calculation procedures) can be found at https://ops.fhwa.dot.gov/perf_measurement/ucr/. The objective of the analysis was to identify those external factors from among the list of 32 (Table 1) that were most highly correlated with these system performance measures. The project team recognized that highly correlated external factors does not mean that these external factors are influencing system performance. In fact, the opposite could be happening—system performance could be influencing external factors (such as economic or employment indicators). Regardless of a proven causation, the project team determined that high correlation was a sufficient reason to recommend including key external factors in an agency's self-directed performance reporting (i.e., not the reporting required in 23 USC 150(e)).
The statistical analysis used principal components analysis (PCA) to reduce the dimensions of the multivariate data. The Granger causality method was then used to identify the most influential and highly correlated external factors. Details on both of these analysis methods are included in the Appendix. Travel DemandAverage daily traffic volumes were obtained from the Traffic Monitoring Analysis System (TMAS) at https://www.fhwa.dot.gov/policyinformation/tables/tmasdata/. TMAS data are collected by FHWA from the State Departments of Transportation (DOT)s. Researchers obtained the MSA traffic volume data from the TMAS stations using ArcGIS tools (Figure 1). 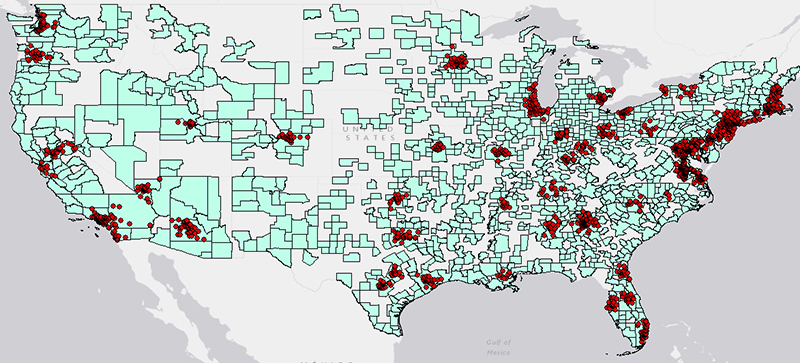 Figure 1. Graphic. TMAS Stations located at the selected 51 MSAs. After obtaining the station volume data, monthly average daily traffic (MADT) was calculated using the following equation (2016 Traffic Monitoring Guide, page 3-30):
Where:
The volume data were available from TMAS for January 2013 to December 2015. Partial volume data was available until June 2016; however, this data did not include the volume data from all stations. Therefore, to obtain the 2016 volume data the MADT were predicted using autoregressive integrated moving average (ARIMA) models. To obtain the missing data values for 2016, TRAMO (Time Series Regression with ARIMA Noise, Missing Observations, and Outliers) and SEATS (Signal Extraction in ARIMA Time Series) was used.(1) TRAMO/SEATS is an ARIMA model based on a seasonal adjustment method. TRAMO/SEATS, together with the X-12-ARIMA, are recommended by Federal Reserve Bank, European Statistical System (ESS) Guidelines on Seasonal Adjustment and officially used by Eurostat and the European Central Bank. Economic, Employment, and Price IndicatorsGross Domestic Product and Personal IncomeThe Gross Domestic Product (GDP) and Personal Income (PI) of MSAs and States are released by the Bureau of Economic Analysis (BEA), U.S. Department of Commerce at https://www.bea.gov/regional/downloadzip.cfm. The State data are released on a quarterly basis while the MSA data are released on an annual basis. Annual GDP/PI of the State is calculated as the average of quarterly GDP/PI. The quarterly MSA data were extrapolated from the State data. The following BEA datasets were used to calculate the quarterly GDP/PI:
A linear regression model is applied to estimate the relationship between the annual GDP of the MSAs (GMP, or Gross Metropolitan Product) with the annual GDP of the States they belong to. Then using the estimated coefficient, the quarterly GMP was calculated by multiplying the coefficient with the quarterly GDP's.
Where
To calculate the coefficient, 10 years of annual GDP data were used (2005-2015). For this analysis, the researchers included the following GDP components:
The analysis was conducted for each MSA separately. The same methodology was used to obtain the quarterly PI data for the MSAs. Economic Conditions IndexThe Federal Reserve Bank (FRED) reports the business cycle or Economic Conditions Indices (ECI) for the MSAs on a monthly basis at https://fred.stlouisfed.org/categories/27281. This is one of the important economic indicators used to describe the economic health of MSAs. ECI is calculated using the 12 most influential economic indicators that are assumed to determine the economic condition of the MSA. For more information, one may refer to the following document: https://research.stlouisfed.org/wp/2014/2014-046.pdf. House Price IndexHouse Price Index (HPI) is the broad measure of the movement of Single-Family (SF) house prices. HPI is reported on a monthly and quarterly basis by the Federal Housing Finance Agency (FHFA) at https://www.fhfa.gov/DataTools/Downloads/Pages/House-Price-Index-Datasets.aspx. The HPI includes house price figures for the nine divisions, 50 States and the District of Columbia, and the MSAs. Consumer Price IndexConsumer Price Index (CPI) of All Consumers, Rent Price, and Fuel Price are obtained from Bureau of Labor Statistics, U.S. Department of Labor (BLS) at https://data.bls.gov/pdq/querytool.jsp?survey=cu (note that this hyperlink is only available when using a Java browser). BLS publishes CPI information for 26 metropolitan areas (Table 2). Some of these metropolitan areas, as defined by the U.S. Census Bureau, include suburbs or counties that extend across State boundaries. The CPI for the rest of the MSAs were calculated using the neighboring and closest MSAs as the reference point (Table 3).
Note: CMSA = Consolidated Metropolitan Statistical Area
Employment IndicatorsMSA employment statistics are released by Bureau of Labor Statistics at https://www.bls.gov/bls/news-release/metro.htm. The following estimates are published on a monthly basis:
Population and Housing IndicatorsPopulation and MigrationPopulation, demographics, and tourism data were obtained from the U.S. Census Bureau at https://www.census.gov/data/datasets/2016/demo/popest/total-metro-and-micro-statistical-areas.html. Population estimates indicate the population changes and the migration in the MSAs. This is annual data and includes the following population estimators:
Homeownership and Rental RatesHomeownership and vacancy rates provide current information on the rental and homeowner vacancy rates, and characteristics of units available for occupancy. Rental and homeowner vacancy rates, and homeownership rates are reported for the U.S., regions, States, and for the 75 largest MSAs at https://www.census.gov/housing/hvs/files/currenthvspress.pdf. Public data for the three indicators were obtained from U.S. Census Bureau at https://www.census.gov/housing/hvs/data/rates.html.
Building PermitsThe Building Permits Survey shows the monthly number of the new housing units in MSAs authorized by building permits. Data are obtained from the U.S. Census Bureau at https://www.census.gov/construction/bps/. The indicators are available for the following:
Weather ConditionsMonthly weather and precipitation data are obtained from National Oceanic Atmospheric Administration (NOAA) at https://www.ncdc.noaa.gov/cdo-web/datatools/findstation. The data are collected from weather stations located at the airports and other locations. The following weather condition variables are used to analyze the performance measures:
ANALYSIS RESULTS WITH HIGHLY CORRELATED EXTERNAL FACTORSThe statistical analysis (detailed in the Appendix) found the most important external factors correlated with system performance were as follows:
The extent to which these external factors affect or are affected by transportation system performance is still unknown, but tracking these and other external factors may provide insight into the relationship between transportation, the economy, and other sectors of interest. Table 4 contains hyperlinks where data for these six important external factors can be obtained online for state and local performance reporting.
While these external factors are important at an aggregate national level, there may be others that are statistically significant and important to individual states or region. States and regions may also choose to track other external factors that may be of particular importance to them. Regardless, when tracking, visualizing, and publishing these external factors, states and regions should carefully consider not only the analysis in preparing the data, but also in how they present the data. The next chapter provides recommendations for presenting external factor information with performance measures. You may need the Adobe® Reader® to view the PDFs on this page. | |||||||||||||||||||||||||||||||||||||||||||||||||||||||||||||||||||||||||||||||||||||||||||||||||||||||||||||||||||||||||||||||||||||||||||||||||||||||||||||||||||||||||||||||||||||||||||||||||||
|
United States Department of Transportation - Federal Highway Administration |
||