2017 Road Weather Management Performance Measures Update
Chapter 3. Application of Road Weather Management Tools and Technologies
OVERVIEW
The previous chapter offered insights into the impacts on transportation system performance
(particularly highways) that States have experienced as a result of implementing road weather
management (RWM) strategies. This section focuses on the specific tools and technologies
used by agencies for road weather management, including the number of State departments of
transportation (DOT) that have adopted them to date.
PERFORMANCE FINDINGS
Use of Fixed and Mobile Observations
The first set of RWM tools pertains to the collection of fixed and mobile road weather observations,
which can take the form of real-time or archived road weather data. The objective is not only
to examine the availability of such data but also to review the subscription rates and use of
observational data among State DOTs—which gauge the impact of the availability of data on
strategic and tactical decision making for weather-related maintenance and traffic operations. The
overall success of this objective has been assessed by four performance measures, which track
the number of State agencies that use these types of road weather data collection systems and
strategies. The number of State DOTs using such systems since the previous report has decreased
for a few tools but increased for the majority of tools assessed, suggesting an overall slight
improvement in this objective.
The number of State DOTs participating in the National Oceanic and Atmospheric Administration's
Meteorological Assimilation Data Ingest System (MADIS) Program has increased. MADIS
is a system that offers a robust set of quality-checked data that is available to support traffic
management, inform maintenance-related decision making and performance measurement, and
provide information on current conditions to the traveling public at a national level. Since 2016, 10
more States have contributed data to MADIS, bringing the total number of participants to 21. These
States are Delaware, Florida, Georgia, Kansas, Massachusetts, Nevada, New Jersey, Ohio, South
Dakota, and Wisconsin.
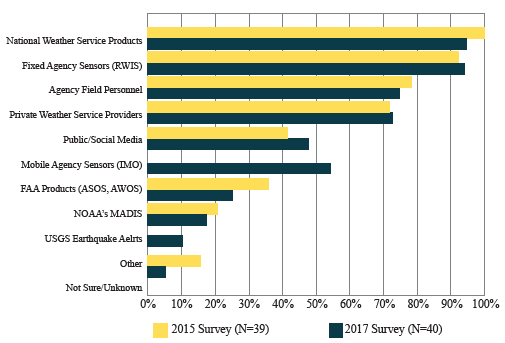
State DOTs reported high levels of subscription to weather and road-weather products and services
that support the DOTs' advisory, control, and treatment strategies. In addition to mass media, various
weather data are available to agencies from both public and private sources, including information
from the National Weather Service (NWS), the Federal Aviation Administration, sensors deployed
by Federal and State agencies, and private sector value-added services. Since 2015, the number of
subscribers of these services has remained relatively constant, with some products and services seeing
increases in popularity while other have seen declines as shown in Figure 8.
 ASOS = Automated Surface Observing System. AWOS = Automated Weather Observation System. IMO = Integrated Mobile Observations. FAA = Federal Aviation Administration. MADIS =
Meteorological Assimilation Data Ingest System. NOAA = National Oceanic and Atmospheric
Administration. RWIS = Road Weather Information System. USGS = United States Geological Survey.
Figure 8. Chart. Percentage of States that subscribe to weather and road weather products and services.
ASOS = Automated Surface Observing System. AWOS = Automated Weather Observation System. IMO = Integrated Mobile Observations. FAA = Federal Aviation Administration. MADIS =
Meteorological Assimilation Data Ingest System. NOAA = National Oceanic and Atmospheric
Administration. RWIS = Road Weather Information System. USGS = United States Geological Survey.
Figure 8. Chart. Percentage of States that subscribe to weather and road weather products and services.
Survey data reflect a notable growth in the collection and use of mobile road weather data from vehicle fleets since the last update (see Figure 9). In addition to vehicle location data from automatic vehicle location systems and radio communication between the driver and the maintenance center, mobile road weather observations can include more detailed maintenance vehicle information such as plow status and material usage, and/or road weather measurements such as pavement surface and air temperatures.
Overall, 23 of the 40 States that responded to the survey, more than 50 percent, collect real-time field data from maintenance vehicles. This is an increase from 20 States in the 2015 survey. Collecting plow status and material usage is most common, with 13 States reporting that they collect more than 50 percent of their data from maintenance vehicles. Compared to the 2015 survey, there was an overall increase in the number of States that collect at least 25 percent of their real-time field data on plow status and material usage, atmospheric weather data (e.g. air temperature, relative humidity), and road weather conditions data (e.g. pavement temperature). This growth is expected to continue with ongoing Road Weather Management Program (RWMP) efforts to implement Integrated Mobile Observations (IMO) as part of the Weather Savvy Roads Initiative.
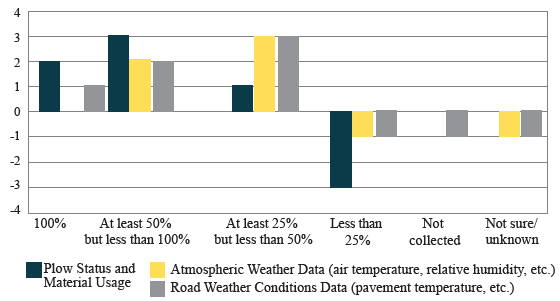 Figure 9. Chart. Change in the number of State departments of transportation collecting data from maintenance vehicles and percentage of applicable fleets from which data are collected (from 2015 survey).
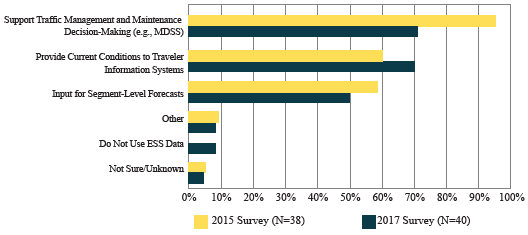
Finally, from the State DOT survey, the respondents reported managing a total of 2,464
environmental sensor stations (ESS), which continues the slight decrease seen in the previous
update. The majority of respondents use ESS data to provide current conditions to traveler
information systems, to support decision making, and as input to segment-level forecasts.
However, while 70 percent of State DOTs use ESS data for traveler information systems, only 73
percent report using this data for decision making, which is down from 95 percent in the previous
period. A positive change can be seen in the increase in the percentage of State DOTs that use
ESS data to provide current road conditions to traveler information systems – from 60 percent in
the 2015 survey to 70 percent in the 2017 survey.
 ESS = Environmental Sensor Station. MDSS = Maintenance Decision Support System.
Figure 10. Chart. Use of environmental sensor stations among State departments of transportation.
ESS = Environmental Sensor Station. MDSS = Maintenance Decision Support System.
Figure 10. Chart. Use of environmental sensor stations among State departments of transportation.
Use of Vehicle-to-Infrastructure or Infrastructure-to-Vehicle Applications and Connected Vehicle Technology
Still in its infancy, State DOTs are in early stages of connected vehicle deployments. Survey results reveal that only 17 percent of agencies said that they have developed applications or tools that leverage infrastructure-to-vehicle (I2V) or vehicle-to-infrastructure (V2I) connectivity:
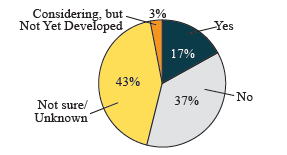 Figure 11. Chart. Performance Measure 14 – survey responses on the use of vehicle-to-infrastructure or infrastructure-to-vehicle connectivity.
Use of Decision Support Tools
The percentage of State DOTs using Maintenance Decision Support Systems (MDSS), both
statewide and partial, has shown a slight decrease; more importantly, there is an increase in the
number of States saying that they do not need an MDSS, whereas the percentage of States saying
they need it but do not have one has remained steady. While MDSS outreach has not been a focus
of the RWMP in the past few years, the need for continued promotion of MDSS benefits appears
to be warranted. Use of decision support tools for activities other than winter maintenance has
remained steady with traveler information, coordination with other jurisdictions, and non-winter
maintenance activities being the top categories of responses and consistent between the 2015 and
2017 surveys. (Refer to Figures 12 and 13.)
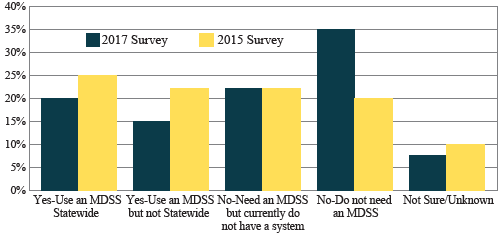 MDSS = Maintenance Decision Support System.
Figure 12. Chart. Performance Measure 19 – percentage of State departments of transportation indicating use or non-use of Maintenance Decision Support Systems.
MDSS = Maintenance Decision Support System.
Figure 12. Chart. Performance Measure 19 – percentage of State departments of transportation indicating use or non-use of Maintenance Decision Support Systems.
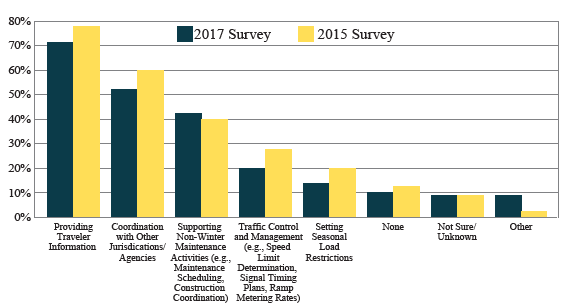 Figure 13. Chart. Performance Measure 20 – percentage of State departments of transportation using weather-related decision support tools for road weather management.
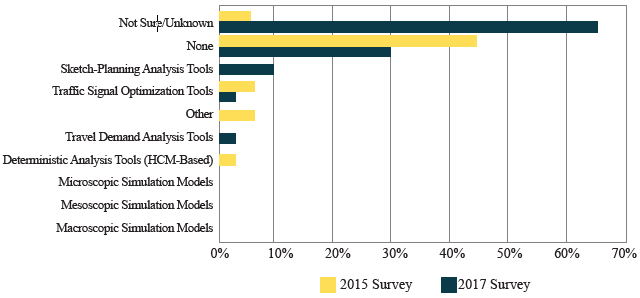 Figure 14. Chart. Performance Measure 21 – percent of State departments of transportation using weather-responsive traffic analysis and simulation tools for planning and evaluating road weather management strategies.
Ninety-five percent of the State DOT respondents either did not use or were not aware of whether their agency used weather-responsive analysis tools and models. This continues to reflect very low awareness and use of weather-responsive analysis, modeling, and simulation products.
The RWMP continues to support research on weather-responsive analysis, modeling, and simulation tools. These tools provide insight into the operations of new and emerging WRTM strategies and can incorporate the impacts of weather into traffic models. For example, the Chicago Analysis, Modeling, and Simulation testbed provides the ability to model and test several road weather connected vehicle applications and active transportation demand management strategies. In addition, RWMP is piloting the Integrated Modeling of Road Condition Prediction (IMRCP) tool in Kansas City. All these tools provide significant analytical capability, both in a real-time and an offline manner, for understanding the impacts of road weather on traffic volumes and roadway capacity. However, translating them from research to real-world operations remains a challenge due to the complexity in data assembly, calibration, and testing required to make these systems work at a State DOT. Not particular to road weather management alone, the greater use of analytical tools to support reliability is an effort that is being considered more broadly by the Federal Highway Administration (FHWA) Office of Operations as well.
Use of Advisory, Control, and Treatment Strategies for Road Weather Management
No universal approach to developing and implementing strategies to address winter weather exists. A wide range of potential methods and strategies can be tailored to address the unique local conditions. The RWMP encourages State DOTs to create a customized approach to road weather management that accounts for the local context (e.g., road conditions, forecasts, etc.).
When assessing RWM performance from this angle, it is clear that State DOTs are making improvements. Figure 15 shows an increase in the number of agencies (since the 2015 survey) that have deployed road weather information dissemination strategies statewide, such as publicizing atmospheric weather information on dynamic messaging signs, road condition information on dynamic message signs, and road condition information on agency-hosted social media or mobile applications.
In 2016, FHWA's RWMP partnered with the South Dakota DOT to develop and implement a weather responsive traffic management (WRTM) strategy. Twenty-four hour road condition forecasts transfer directly from South Dakota's MDSS to its traveler information systems as possible future "threats" when road conditions might deteriorate due to unsafe situations (Performance Measure 19). Furthermore, in a 2016 Transportation Research Board study, speed and visibility data were analyzed at several locations along I-64 and I-77 in Virginia, where fog often develops. The research aimed to understand motorists' existing speed choices during low visibility conditions. The models revealed that there is a significant differential between observed speeds and the desired safe speed (Performance Measure 21). Hopefully by recognizing more promising case studies like these, more states in the future will be able to integrate weather- related decision support technologies into their traffic operations and maintenance procedures.
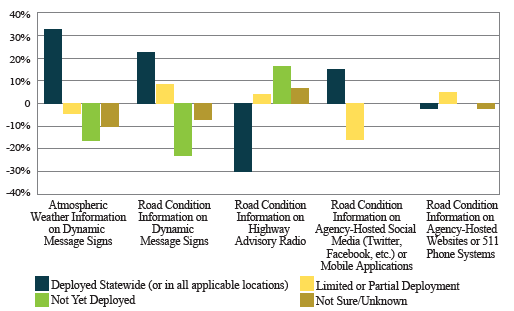 Figure 15. Chart. Performance Measure 15 – number of States disseminating weather advisory and other road weather information to travelers, by type (percentage change from 2015 survey).
The only significant drop in State participation in the above strategies is in the use of highway
advisory radio, which is arguably a more outdated means of communications with the public. The
more contemporary methods of social media and dynamic message signs, which more easily facilitate
real-time, en-route information, have shown significant increases in adoption by State DOTs.
In the past 2 years, as shown in Figure 16, there was a reported increase in the number of States deploying more automated, innovative traffic control strategies such as ramp meters, traffic signal timing, and variable speed limits. However, ramp metering and signal timing are still at low levels of deployment. This may be an indication that ramp meters, traffic signal timing technologies, and variable speed limits are a good area to focus on relative to road weather management.
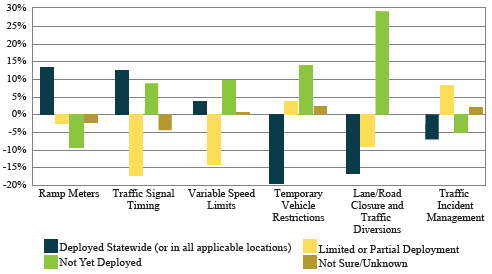 Figure 16. Chart. Performance Measure 16 – deployment levels of control and treatment strategies during weather events (percentage change from 2015 survey).
Consideration of Extreme Weather and Transportation Resilience and Sustainability
Sustainability for road weather management has largely been restricted to having a snow and ice removal policy. Few agencies have a dedicated road weather management program as shown in Figure 17. The percentage of agencies implementing plans for road weather management infrastructure and developing various processes for managing extreme weather has increased as shown in Figure 18.
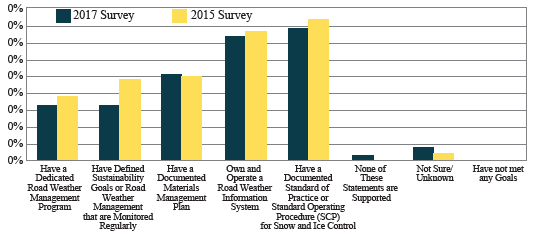 Figure 17. Chart. Performance Measure 26 – percentage of agencies meeting sustainability criteria related to road weather management.
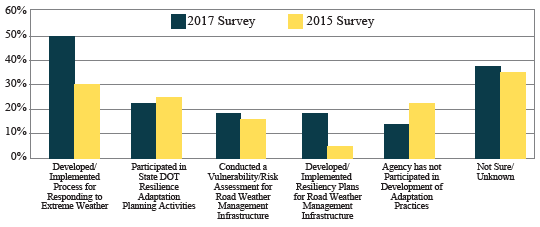 Figure 18. Chart. Performance Measure 27 – percentage of agencies involved in extreme weather or climate change activities.