2017 Road Weather Management Performance Measures UpdateChapter 2. Road Weather Management Impacts AssessmentOVERVIEWMeaningful improvements in highway performance during adverse weather conditions are expected to be realized as a result of increased nationwide implementation of various road weather management (RWM) strategies. The Federal Highway Administration (FHWA) Road Weather Management Program (RWMP) uses a handful of performance measures (discussed in the following Performance Findings section) to monitor the recent progress on road systems across the country, particularly as it relates to mitigating the negative impacts of adverse road weather conditions. The pathways from program activity to overall macro-level outcomes are complex, and direct correlation between a specific RWMP program activity and road weather impacts is not possible. However, overall trends provide a snapshot into the scope of the problem agencies face today, as well as some practices that have shown positive benefits. PERFORMANCE FINDINGSCollecting and Reporting Performance MeasuresState departments of transportation (DOTs) have demonstrated an enhanced level of awareness of and interest in understanding the performance of their systems and the outcomes associated with their road weather management response. However, State DOTs are still figuring out how best to collect and report this metric. Information from the State DOT survey was used to determine how many State transportation agencies currently collect road weather performance data (e.g., dashboards, winter maintenance reports, seasonal summaries) and report it to the public. Among the 40 State DOTs that responded to the survey, 22 of them (56 percent) reported regularly collecting and reporting some form of road weather performance measures, while 4 respondents were uncertain. The number of "yes" responses in the 2017 survey decreased slightly from the 2015 level (58 percent), as seen in Figure 2 below. 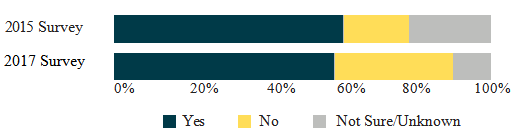 Figure 2. Chart. Percentage of agencies that collect and report road weather performance measures. While the reported number of agencies collecting RWM performance data in 2017 is slightly lower than it was in 2015, it is interesting to note that the "Not Sure/Unknown" responses were cut in half. Nevertheless, it is important that more than 50 percent of the responding States have begun considering the collection of road weather performance data. Continued development of a consistent set of measures in the future is critical to enabling assessment of impacts across the Nation. The 2017 survey also found that 41 percent of State DOTs (18 out of 40) use a "winter severity index" to compare performance across events or across years. This metric was not collected in the last iteration of this report, so this presents a new area of potential improvement to measure in the coming years. As seen in Figure 3, nine States reported having a process in place to evaluate return on investment or the net benefits of road weather management investments; this is almost twice the number of States that had such a process in 2015 (five States). A 2014 Transportation Research Board research paper4 compared winter crash data on roadway segments in Idaho before and after deployment of Road Weather Information Systems (RWIS) sites and calculated a benefit-cost ratio of 22, easily justifying the investment. As more States begin implementing such metrics and using the tools and resources that have been developed by FHWA RWMP for conducting benefit-cost analyses (BCA) on RWM activities, a stronger case can be made to further widen the breadth of RWM strategy deployment across the country. 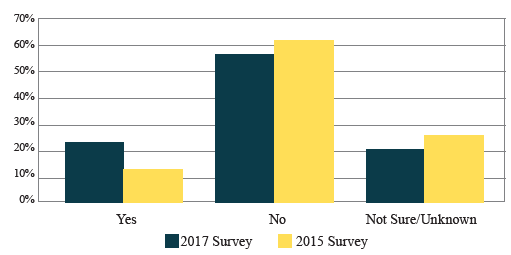 Figure 3. Chart. Performance measure 4 – percentage of agencies surveyed with a process for evaluating the return on investment or net benefit of their road weather management investments. National Trends in Road Weather ImpactsThe research team used additional performance measures to assess the economic impacts that States are facing every year – namely, winter maintenance costs (snow and ice removal, salt usage) – due to adverse road weather conditions. Figure 4 summarizes data from the latest iteration of FHWA Highway Statistics detailing national expenditures for snow and ice removal (in thousands of dollars) between 2001 and 2013: 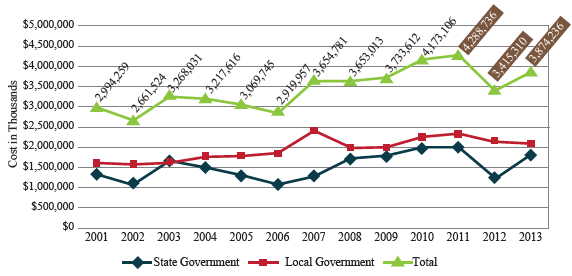 Figure 4. Graph. National expenditures for snow and ice removal, 2001-2013. While local governments have seen a reduction in expenditures for snow and ice removal between 2012 and 2013 (the latest period of data available), State government expenditures have risen in the corresponding time period – resulting in a total expenditure increase of about 13 percent. This slight increase in expenditure is a shift in direction from the previous decline between 2011 and 2012. The above observations in large part are attributed to the natural, unpredictable variation in weather and road weather conditions in the short run. Virginia and Pennsylvania experienced the largest increases between 2012 and 2013, spending an additional $80 million and $92 million on winter operations and maintenance, respectively. However, specific examples such as a 2016 case study in Idaho(5) demonstrated that equipping electronic spreader control systems on snowplow trucks and installing RWIS sites throughout the State helped lower the State's winter maintenance costs by 29 percent over three years; in fact, between 2013 and 2014, Idaho's winter maintenance expenditures were reduced by nearly $2 million. An assessment of the overall expenditures between 2001 and 2013 reveals no noteworthy trend in the data. While some States are implementing innovative solutions to reduce road weather maintenance costs, the long-term nationwide expenditures have slightly risen. This variability and the lack of a trend can also be seen in Figure 5, which summarizes the latest data on nationwide salt usage (2006-2014) from the United States Geological Survey (USGS). 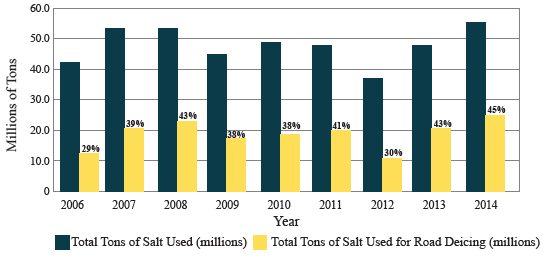 Figure 5. Graph. Nationwide salt usage, 2006-2014. While there was a 20 percent increase in the amount of salt used for de-icing between 2013 and 2014, the overall trend fluctuates often. Nevertheless, a few States have demonstrated notable, promising case studies of how nationwide salt usage can still be better controlled as a result of innovative RWM strategies:
Roughly half of the congestion experienced by travelers in the United States is caused by temporary disruptions or nonrecurring congestion. Inclement weather (snow, ice, and fog) is one of the main causes of non-recurring congestion, contributing to 15 percent of this type of delay.(9) This is estimated to result in an annual delay of 544 million vehicle-hours across the country.(10) In addition, snow accumulation, precipitation (type, rate, and start/end times), extreme wind speeds, and water levels also lead to a decrease in highway capacity. Directly reducing the delays experienced by travelers driving in inclement weather conditions, therefore, is one of the key elements of system performance improvement targeted by RWMP. Since the last performance measure update, two additional noteworthy delay-reducing strategies were identified.
Finally, an assessment of RWM impacts would not be complete without considering safety impacts of managing adverse weather – in this case, the reduction in number and types of fatalities and crashes on the road. On average, there are over 5,870,000 vehicle crashes (resulting in injuries or fatalities) annually, 23 percent of which are attributed to adverse weather and its effect on visibility and road surface conditions.(13) As listed in Table 1, Performance Measure 6 tracks the reduction in nationwide numbers and types of fatalities attributed to adverse weather. Databases like the Fatality Analysis Report System, National Highway Traffic Safety Administration's (NHTSA) National Automotive Sampling System General Estimates System, and NHTSA's National Motor Vehicle Crash Causation Survey provide national-level summaries, seen in Figures 6 and 7. 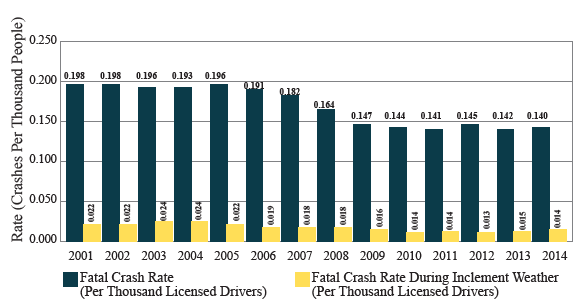 Figure 6. Graph. Fatal crash rates per thousand licensed drivers, 2001-2014. The 2014 data is the newest addition since the last iteration of this report. The number of fatal crashes during inclement weather in 2014 was 3,094—very similar to the 2013 number (3,157). However, since the total number of drivers on the road increased by nearly 2 million, this resulted in a slight decrease in the fatal crash rate during inclement weather (per thousand drivers). 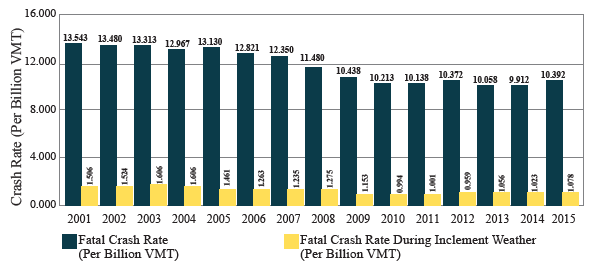 Figure 7. Graph. Fatal crash rates per billion vehicle miles traveled, 2001-2015. Viewed from the perspective of vehicle miles traveled (VMT), it is clear that fatal crash rates follow a similar trend. Both figures illustrate how the crash rates decreased since 2001; however, the last six reported years have leveled out. While there is a decrease in both the overall and the inclement weather crash rates, the weather crash rate is decreasing at a slower rate than the overall crash rate. Statistics show that the vast majority of weather-related crashes occur on wet pavement and during rainfall:(14)
The fact that the percentage of fatal crashes occurring during inclement weather held fairly steady at an average of 11 percent between 2001 and 2015 (without swaying more than 2 percent in either direction) suggests that the decrease in fatal crashes during adverse weather is most likely a result of decreasing crash rates overall—regardless of the weather condition. There is not enough evidence to suggest that weather-related fatal crashes decreased independently as a result of RWM-specific strategies. 4 Koeberlein, R., Jenson, D., and Forcier, M., "Relationship of Winter Road Weather Monitoring to Winter Driving Crash Statistics," Transportation Research Board, October 24, 2014. [ Return to note 4. ] 5 Idaho Transportation Department, The Transporter, "ITD sees drop in accidents on icy roads thanks to electronic spreader control system," January 8, 2016. Available at: http://apps.itd.idaho.gov/apps/MediaManagerMVC/transporter/2016/010816_Trans/010815_ITDIcyRoads.html. [ Return to note 5. ] 6 "Iowa's Salt Dashboard Helps Garages Use Salt Efficiently," Clear Roads Newsletter, August 2016. Available at: http://clearroads.org/august-2016/. [ Return to note 6. ] 7 Basch, M., "Road crews cut back on salt in Maryland," WTOP, December 15, 2016. Available at: http://wtop.com/weather-news/2016/12/road-crews-cut-back-salt-maryland/. [ Return to note 7. ] 8 Region of Peel-Public Works-Transportation-For Residents-Other Salt Reducing Initiatives website. Accessed September 11, 2017. Available at: https://www.peelregion.ca/pw/transportation/residents/salt-reduction.htm. [ Return to note 8. ] 9 USDOT, FHWA, Office of Operations Road Weather Management Program, "Operations Story." Accessed September 11, 2017. Available at: http://ops.fhwa.dot.gov/aboutus/opstory.htm. [ Return to note 9. ] 10 USDOT, FHWA, Office of Operations Road Weather Management Program, "How do Weather Events Impact Roads?" Accessed September 11, 2017. Available at: http://ops.fhwa.dot.gov/weather/q1_roadimpact.htm. [ Return to note 10. ] 11 USDOT, FHWA, Road Weather Management Program, "Michigan Department of Transportation (MDOT) Weather Responsive Traveler Information (Wx-TINFO) System," FHWA-JPO-16-324, January 2016. Available at: https://ntl.bts.gov/lib/57000/57000/57050/FHWA-JPO-16-324_v1_-_MDOT_Flyer.pdf. [ Return to note 11. ] 12 USDOT, FHWA, Office of Operations, "Collaboration Across the Road Weather Enterprise: The Pathfinder Project," FHWA-HOP-16-086, December 2016. Available at: https://ops.fhwa.dot.gov/publications/fhwahop16086/index.htm#toc. [ Return to note 12. ] 13 USDOT, FHWA, Office of Operations Road Weather Management Program, "How do Weather Events Impact Roads?" Accessed September 11, 2017. Available at: http://www.ops.fhwa.dot.gov/weather/q1_roadimpact.htm. [ Return to note 13. ] 14 U.S. DOT FHWA Office of Operations Road Weather Management Program, "How do Weather Events Impact Roads?" Accessed August 24, 2017. Available at: http://www.ops.fhwa.dot.gov/weather/q1_roadimpact.htm. [ Return to note 14. ] |
|
United States Department of Transportation - Federal Highway Administration |
||