Road Weather Management Benefit Cost Analysis CompendiumCHAPTER 5. CASE STUDIES FOR INFORMATION DISSEMINATION
Note: Use the hyperlinks in this table to jump directly to the case study.
CASE STUDY 5.1 – RURAL ITS DEPLOYMENT – OREGON'S AUTOMATED WIND WARNING SYSTEM29
Project Technology or StrategyTo address localized high cross-wind challenges, ODOT and Caltrans have used ITS installations to alert motorists of dangerously windy conditions automatically. Such a system is known as an automated wind warning system, or AWWS. ODOT designed its AWWS to send warning messages to drivers at locations where they can either stop and wait until conditions have improved or opt to take an alternate route. ODOT has deployed two such systems in the rural COATS study area, at the following locations:
The two systems had similar components and are being observed by both departments of transportation to evaluate future AWWS deployments in their respective States. Wind gauges (anemometers) were connected to roadside static message signs and flashers were activated when average wind speeds reached predetermined threshold levels. The system automatically recorded the severity of the cross winds and notified traffic operators of the system's status. Once wind conditions were verified by the Traffic Operations Center, additional warnings were posted on the Oregon DOT TripChek Web site. The warning messages were deactivated when wind speeds dropped below threshold levels. Project Goals and ObjectivesUS Route 101 is a very important corridor for the movement of freight and tourists, so it is critical to keep this highway open. Therefore, ODOT ITS Unit designed and deployed automated wind warning systems (AWWS) to reduce the number of road closures on US Route 101 and improve efficiency. As part of this process, ODOT performed BCA of these systems to evaluate their effectiveness in meeting their objectives. In order to provide comparable benefits and costs within the analysis, ODOT carefully selected key measures of effectiveness (MOEs) as the focus of this analysis. These measures included:
MethodologyThis analysis measured MOE 1 (Safety) through an analysis of crash data for the years 1997-2003, reviewed MOEs 2 through 5 (Efficiency, Customer Satisfaction, Reliability and Productivity) in the motorist survey results, and quantified MOE 6 (Operational Cost Savings) through the operational assessment. Table 17 summarizes the objectives and MOEs proposed for this evaluation.
COSTS The implementation costs were estimated to be approximately $90,000 for the combined systems. The annual maintenance costs of the South Coast and Yaquina Bay Bridge systems are expected to be $3,000 and $3,500 per year, respectively. These costs were estimated as the systems were designed, built and installed by ODOT, and numerous State resources were used in the process that was not readily traceable. Maintenance cost estimates are based on another COATS Showcase study on maintenance costs of field elements in rural areas. BENEFITS The direct benefits of the AWWS result from labor and equipment cost savings realized through avoiding road closures and the need to manually monitor conditions (on-site) during high-wind events at regular intervals. In both locations, annual savings are a function of the number of high-wind events observed at each site. As shown in Table 18, labor and equipment cost savings were calculated using average durations of road closures for two systems—the South Coast and the Yaquina Bay Bridge systems. The study compiled data on the number of annual closure incidents, the average distances between the maintenance yards and the system locations, the average labor and vehicle costs per closure and for an average year. The labor rates were calculated from prevailing wage rates published by the Oregon Bureau of Labor and Industries.
The study also calculated the benefits of two types of delay savings realized from the AWWS. First, road closures are not automatically enacted when high winds occur, which means that delay will be reduced for motorists when the road can be kept open. Second, for those occasions when a road closure is required, the automated system allows for quicker removal of the closure when winds subside. In both cases, the estimated delay associated with road closures is based on traffic characteristics associated with each location. Traffic volumes were used to estimate delay savings. Traffic volumes were estimated based on average duration wind events (6 hours for South Coast, 3 ½ hours for Yaquina Bay). Two volume scenarios are presented: an average volume scenario which assumes the closure may happen at any time of the day, and a high volume scenario, which includes the 30th highest hour volume as the volume during one hour of the closure. It is possible that a certain percentage of motorists choose to take an alternate route during high-wind events. An estimation of the percentage of drivers that may choose to take an alternate route was performed based on the responses to the motorist survey conducted for the two systems. As shown in Table 19, these traffic volume scenarios were then combined with value of time factors from the FHWA HERS model to calculate the average delay costs per road closure for passenger vehicles and heavy trucks.
BENEFIT COST RATIO The benefit cost ratios were estimated based on the following assumptions:
Model Run ResultsAccounting for motorist delay reduction as well as other benefits such as improved safety for motorists (and maintenance personnel) during high wind events, the benefit-to-cost ratios for the South Coast system and Yaquina Bay Bridge system were 4.13:1 and 22.80:1, respectively. The Yaquina Bay Bridge system had a higher benefit-to-cost ratio reflecting the higher frequency of cross winds in the area and heavier traffic volumes compared to the South Coast system. The analyses assumed the system would reduce delay by approximately 20 percent as a result of prompt deactivation of wind warnings. The benefit cost ratio calculations, and the number of years until the benefits exceed the costs (break even analysis), are shown in Table 20.
* "Average" scenario includes average number of wind events and average traffic volumes.
** "High" Scenario includes high number of wind events and high traffic volumes. *** Benefit-cost ratio is calculated based on "average" benefits. The estimated benefit cost ratios indicate that the direct benefits from the two AWWS systems in Oregon would exceed their installation, operational and maintenance costs between seven years for the Yaquina Bay Bridge system and twelve years for the South Coast system after installation, depending on the frequency of road closures related to high wind events and the traffic volume through these locations. If delay reductions to the motorists are considered, the benefits of the system pay for the system installation and maintenance costs within three years for the South Coast system and one year for the Yaquina Bay Bridge system. These benefit cost ratio estimates did not include any indirect benefits such as improved safety for maintenance personnel and improved safety for the motorists during high wind events. A positive benefit cost ratio was achieved counting only the motorist delay reduction benefits. The continued deployment of these systems will provide more information about the safety benefits to workers and drivers in the future. As this study was completed with only 1-2 deployment history, statistically reliable crash reduction estimates could not be developed at this time. The results of the BCA showed rural AWWS deployments to be an extremely efficient investment. The potential benefits included reduced travel time delay, crash reduction during adverse weather, and operating cost savings through more efficient use of winter maintenance resources. The results, made more relevant by the fact that they were generated through a valid and systematic process, were extremely valuable in making the case for investment in improved AWWS in the regions. Key ObservationsThis case evaluated AWWS in Oregon rural highway corridors. From the BCA results, AWWS deployments offered significant cost savings to drivers as well as ODOT. These systems also allow more prompt high wind notifications to the drivers thus reducing exposure of the driving public to high cross winds along US Route 101. Overall, this case showed that weather management costs decreased with increased use of weather information and with improved accuracy. Therefore, agencies should consider expanding the use of current resources and investing in improving the accuracy of their weather information to realize cost savings. The use of low and high traffic volumes can be used for a break-even analysis. It is also important to consider both direct and indirect benefits of your deployments. Care must be taken not to double count benefits as many indirect benefits may already be embodied in the direct benefits. This is the difference between BCA and Impact analysis. In impact analysis, all economic changes, positive or negative, direct or indirect, are accounted for. ReferenceKumar, Manjunathan, and Christopher Strong, Comparative Evaluation of Automated Wind Warning Systems, U.S. DOT Research and Innovative Technology Administration, February 2006. CASE STUDY 5.2 – SALT LAKE CITY'S TRAFFIC OPERATIONS CENTER STUDY30
Project Technology or StrategyThe UDOT Traffic Management Division established the weather operations component, known as the traffic operations center (TOC), featuring four staff meteorologists stationed in it providing year-round weather support for winter maintenance, road construction and rehabilitation projects, TOC operations, the Highway Avalanche Safety Program, planning, risk management, training, and incident management. With the staffed meteorologists, quality control of weather forecasts is ensured. Weather briefings are conducted in the TOC on a daily basis, involving TOC personnel, area supervisors, and maintenance foremen. In addition, the program provides tailored crew-specific forecasts in a text format for all 82 maintenance sheds. Project Goals and ObjectivesBeing a part of UDOT's Weather Operations program, TOC installations aimed to provide road and weather information with improved quality and accessibility to UDOT personnel and other stakeholders. This is expected to have a positive impact on UDOT's goals and objectives, in terms of overall safety, mobility, efficiency, productivity, environmental conservation, and customer satisfaction. As a part of the process, UDOT conducted the BCA to quantify the benefits of UDOT's TOC weather service to winter maintenance activities. Labor and materials cost (in U.S. dollars) at the maintenance shed level was considered to be a key MOE indicator. MethodologyThe project approach included surveying UDOT maintenance and construction personnel and analyzing data on labor and materials cost for winter maintenance along with other related data for the maintenance sheds in order to evaluate both the intangible and tangible benefits of the UDOT's TOC weather service to winter maintenance. The assumption is that the maintenance sheds that have more confidence in the UDOT weather service and use it more frequently might save money through better planning and proactive operations. By examining the labor and materials cost for winter maintenance in the 2004-2005 season for 77 UDOT sheds, this study adopted a complex data mining approach to establish the shed winter maintenance cost as a function of UDOT's TOC weather service usage, evaluation of UDOT weather service, level-of maintenance, seasonal vehicle-miles traveled, anti-icing level, and winter severity index.31 Once the empirical artificial neural network model (ANN model) was validated, it was used to predict the shed-level labor and materials cost of 77 UDOT sheds under three different scenarios: (1) all the sheds used non-UDOT weather service providers on a daily basis as the only source for weather information, (2) used poorer quality weather service providers than they currently use on a weekly basis, and (3) used the UDOT weather service as the primary source to a maximum level. As such, the ANN model was used to quantify the benefits of UDOT's TOC weather service to winter maintenance (in the form of cost savings). This evaluation included the benefits for only certain groups of users (specifically, central maintenance, field maintenance and construction). Model Run ResultsThe case shows that having a weather meteorologist work in a TOC can increase the accuracy of local weather forecast information resulting in improved operations and cost savings benefits. The benefit cost analysis (BCA) determined that the TOC had an estimated benefit of more than $2.2 million in 2004 to 2005 from UDOT's reduced winter maintenance costs. Given that the program costs approximately $200,000 to operate, the result translates into a benefit cost ratio of over 10:1. The BCA results highlight the potential benefits that may be realized by an agency expanding the TOC installations and using improved weather information to direct its winter maintenance activities. Key ObservationsThe BCA sought to quantify the benefits and costs of weather information by focusing on a case study of UDOT's TOC deployments. Using an artificial neural network approach, it is estimated that the benefit cost ratio associated with the program is over 10:1, based simply on the labor and materials cost savings associated with winter maintenance. As this research did not include the full extent of the range of costs and benefits resulting from this program, there are limitations to these findings. The true benefit cost ratio of the program may be higher, for there are other program users whose economic benefits were not considered as a part of this study. ReferenceXianming Shi, Katie O'Keefe, Shaowei Wang, Christopher Strong, Evaluation of Utah Department of Transportation's Weather Operations/RWMIS Program: Phase I, The Western Transportation Institute for the Utah DOT, February 2007. CASE STUDY 5.3 – MOTORIST ADVISORY AND WARNING (CONNECTED VEHICLE APPLICATION)32
Project Technology or StrategyThe Road Weather Motorist Advisory and Warning application provides the capability of collecting road weather data from connected vehicles and using that data to develop short-term warnings or advisories that can be provided to individual motorists. The information may come from either vehicles operated by the general public and commercial or specialty vehicles and public fleet vehicles. The raw data will be processed in a traffic management or control center to generate segment-based traffic and road condition information. The processing will also include road weather motorist alert algorithms to generate appropriate short, medium and long-term messages that will be pushed to traveler information systems and made available to the public and other users of information.33 Project Goals and ObjectivesRoad-weather connected vehicle data will support advanced warning on deteriorating traffic and road weather conditions on specific roadway segments to travelers before and during their trips. By utilizing these data, roadway users will be readily informed about adverse weather conditions along their route and can react in time, either by not making the trip or adjusting their travel plans and driving behavior. MethodologyCOSTS We used the information from the 2013 Road Weather Management Connected Vehicle Applications report34 to perform a benefit cost analysis (BCA) of the Motorist Advisory and Warning application. Based on this data, new cost line items were added to the existing cost sheet within TOPS-BC.35 Figure 20 shows the different cost items that were added. The illustration is taken from a spreadsheet within TOPS-BC that calculates the costs of specific CV strategies. Figure 20 shows the different cost items that were added. The illustration is taken from a spreadsheet within TOPS-BC that calculates the costs of specific CV strategies. Basic Infrastructure refers to the required common infrastructure investments to support multiple CV transportation systems management and operations (TSMO) projects while the Incremental Deployment section includes cost items that are application-specific. The Basic Infrastructure and Incremental Deployment sections include estimated annualized costs, operations and maintenance costs, item-specific counts and the user-selected quantities used in this analysis. Since the case study CV deployments, including motorist advisory and warning, are assumed to take place in a hypothetical State, the distinction between necessary basic CV infrastructure investments and incremental/strategy-specific deployments needs to be clear. For the purpose of this analysis, each CV deployment BCA assumes that the respective State or metropolitan planning organization needs to acquire both basic infrastructure and incremental/ strategy specific infrastructure. However, since the basic deployment investment supports many projects and strategies, only a portion of the total basic infrastructure cost is assigned to a specific CV technology. The percentage assumes that a set of CV technologies are deployed and the specific technology's basic infrastructure cost equals that technology's share of expected benefits in the set of deployed technologies. This cost assignment would vary depending on the full set of CV technologies deployed and supported by the basic infrastructure investment. For the motorist advisory and warning case study, the assumed percentage of total basic infrastructure costs is 26 percent. The CV BCA report focused on the entire United States, so for the individual CV case studies in this compendium the hypothetical State is assumed to have 2 percent (1 of 50 States) of the total U.S. population. The basic infrastructure quantities used in the analysis were derived from that assumption and are shown in Figure 20. When the new cost items are entered into TOPS-BC, the CV BCA report is used to identify which cost elements are needed to perform the appropriate cost analysis. If users want to analyze a specific Connected Vehicle Application deployment strategy, the table allows for a quick identification of the cost items needed. 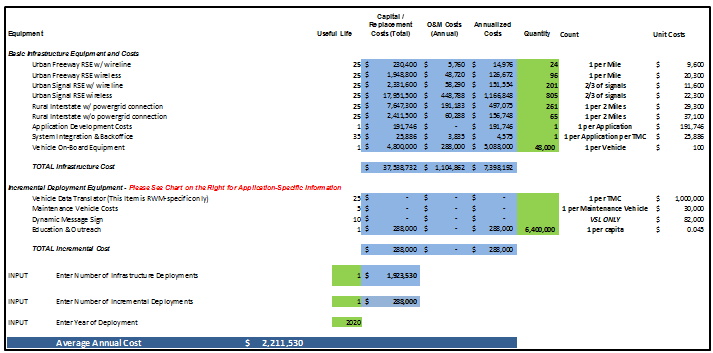 Figure 20. Screenshot. Annualized costs for motorist advisories and warnings. This CV application, Motorist Advisory and Warning, has several basic infrastructure cost items that need to be taken into consideration when conducting a BCA. The following cost items were considered for this analysis, and are also listed in Figure 20:
Figure 20 shows the cost sheet within TOPS-BC for this application. In addition to the basic infrastructure costs listed above, the figure also shows quantities and dollar values for a cost item specific for the education and outreach strategy: Education and outreach are necessary to inform the public about the implementation of the strategy. It is calculated on a per capita-basis, which means a cost occurs for every individual in the service area. Since the hypothetical State is assumed to have 2 percent of the U.S. population, this analysis uses the value of 6.4 million inhabitants, assuming that the U.S. population is 320 million. Finally, the number of infrastructure and incremental deployments was set to 1 each, because the extent of the roadway structure for the entire CV system and for this strategy in particular is already considered in the quantities shown in each cost line. The system is assumed to be operational in 2020. As Figure 20 shows, these assumptions result in average annual costs of about $2.21 million. BENEFITS In order to estimate the benefits of this strategy, we utilized data from the CV BCA report36 which estimates the effectiveness of this strategy to be 20 percent (i.e., crashes are likely to be reduced by 20 percent when the strategy is in place). Alongside this assumption is the assumed increase in capacity due to a lower amount of incidents that slow down traffic. The report set this number to 10 percent for all applications. Furthermore, crashes include three different types of incidents: property damage only, injury, and fatality. Since TOPS-BC calculates the number of each of these types of incidents for all weather conditions and not just for adverse weather conditions, these values needed to be adjusted. For the purpose of this analysis, and based on the CV BCA report, we assume that 24 percent of incidents are related to adverse weather conditions. Hence this analysis applies to 24 percent of property damage only, injury, and fatality incidents. Figure 21 shows the CV benefit sheet within the tool. The adjusted values for property damage only, injury and fatality were entered into the green cells in the Facility Performance section of the tool. The green cells can be changed by the user and override the default values used by TOPS-BC. The capacity increase and crash reduction assumptions were implemented below the section Impacts due to Strategy. These values were also entered in the green cells, since TOPS-BC regularly does not consider any changes in capacity and uses a different crash reduction rate. For this reason, the given data within the tools were overridden. These data could come from travel demand models, freeway simulations, counts or other sources. Note that other agency benefits—for example, benefits from reduced maintenance costs due to the Motorist Advisory and Warning—are not reflected in the benefit estimation. Analysts are encouraged to independently calculate such benefits and add them into the TOPS-BC estimates. 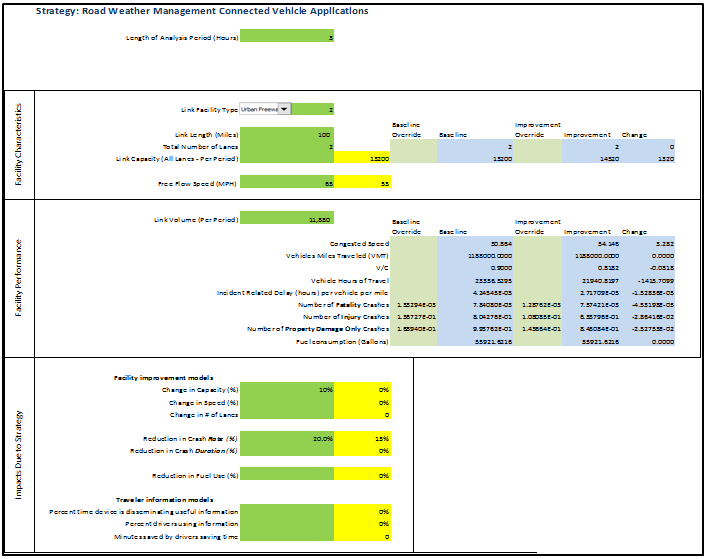 Figure 21. Screenshot. Benefit estimation assumptions for motorist advisory and warning system. Finally, Figure 22 shows the lower half of the CV benefit estimation page. It includes additional sections on travel time, energy and other safety benefits. The user is able to refine any TOPS-BC calculation using these sections in case more specific data is at hand. Through this flexible user interface, the user can generate refined and more accurate results. The total average annual benefit is calculated automatically by TOPS-BC and can be found the bottom of the benefit estimation sheet. The total average annual benefit for this application is $13.32 million. 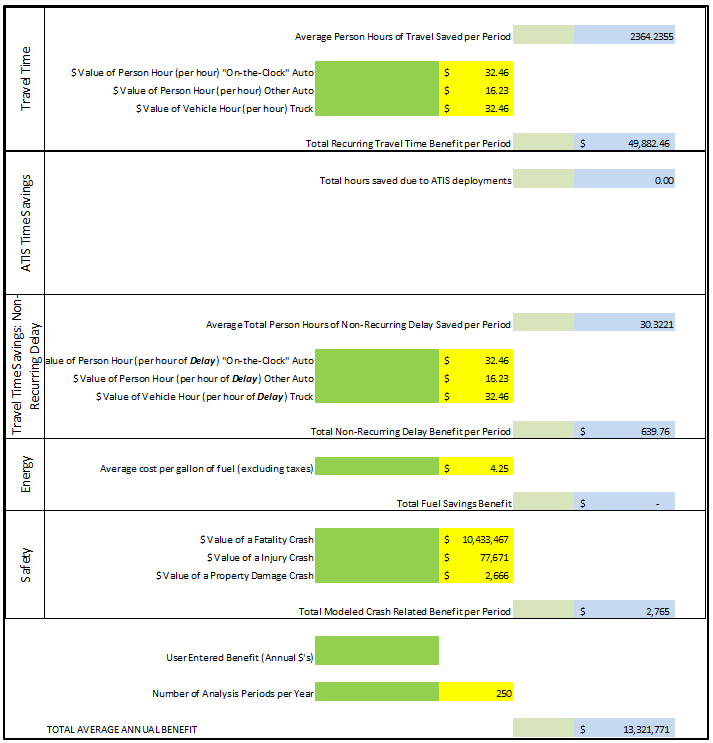 Figure 22. Screenshot. Benefit estimation results for motorist advisory and warning system. Model Run ResultsFinally, the analysis compares the results of the benefits calculation with the results of the cost calculations. This case study merely analyzes a specific set of costs and benefits for demonstration purposes. A full benefit cost analysis will include a wide range of additional costs and benefits that are not separately listed or analyzed in this case study; for example, vehicle operating cost reductions and an increased feeling of safety for roadway users. Figure 23 shows the section of TOPS-BC that compares benefits and costs for the connected vehicle strategy Motorist Advisory and Warning. The illustration indicates that the deployment of a Motorist Advisory and Warning System in a hypothetical State considering the underlying assumptions is cost effective, since the resulting BCR for the strategy is 6.02. The resulting net benefits for this analysis are about $11.1 million. 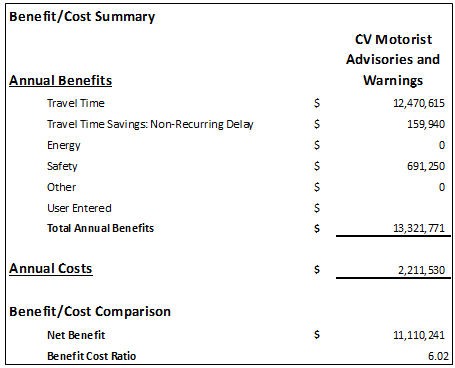 Figure 23. Screenshot. Results for connected vehicle motorist advisory and warning system. CASE STUDY 5.4 – INFORMATION FOR FREIGHT CARRIERS (CONNECTED VEHICLE APPLICATION)37
Project Technology or StrategyThe road weather information for freight carriers application is a special case of the road weather advisory and warning for motorists that is focused on freight carriers. This application provides the capability to collect road weather data from connected vehicles and use that data to develop short-term warnings or advisories that can be provided to individual commercial vehicles or to commercial vehicle dispatchers. The information may come from either vehicles operated by the general public, commercial entities, or specialty vehicles and public fleet vehicles. The raw data will be processed in a traffic management or control center to generate segment-based traffic and road weather information for truck drivers. The processing will also include a road weather commercial vehicle alerts algorithm to generate messages that will be pushed to traveler information systems and made available to commercial vehicle drivers and dispatchers.38 Project Goals and ObjectivesRoad-weather connected vehicle data will provide information on deteriorating traffic and road weather conditions on specific highway segments to both truck drivers and their dispatchers. This information can be used to improve scheduling decisions and parking availability and delivery schedules. Likely outcomes are a reduced number of crashes and unplanned delays, as well as higher reliability of delivery times. MethodologyCOSTS We used the information from the 2013 Road Weather Management Connected Vehicle Applications report39 to perform a benefit cost analysis (BCA) for the information for freight carriers application. Based on this data, new cost line items were added to the existing cost sheet within TOPS-BC.40 Figure 24 shows the different cost items that were added. The illustration is taken from a spreadsheet within TOPS-BC that calculates the costs of specific CV strategies. Basic Infrastructure refers to the required common infrastructure investments to support multiple CV transportation systems management and operations (TSMO) projects while the Incremental Deployment section includes cost items that are application-specific. The Basic Infrastructure and Incremental Deployment sections include estimated annualized costs, operations and maintenance costs, item-specific counts and the user-selected quantities used in this analysis. 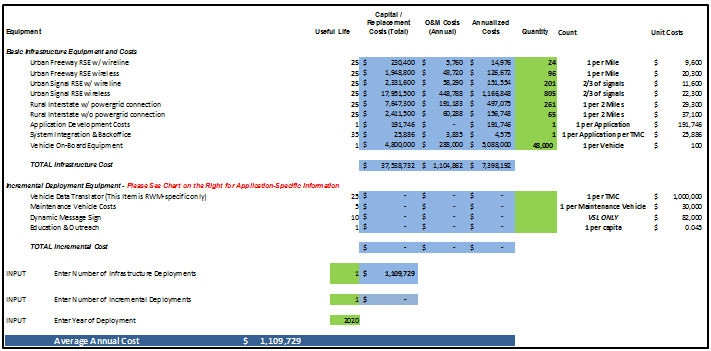 Figure 24. Screenshot. Annualized costs for information for freight carriers. Since the case study CV deployments, including Information for Freight Carriers, are assumed to take place in a hypothetical State, the distinction between necessary basic CV infrastructure investments and incremental/strategy-specific deployments needs to be clear. For the purpose of this analysis, each CV deployment BCA assumes that the respective State or metropolitan planning organization (MPO) needs to acquire both basic infrastructure and incremental/ strategy specific infrastructure. However, since the basic deployment investment supports many projects and strategies, only a portion of the total basic infrastructure cost is assigned to a specific CV technology. The percentage assumes that a set of CV technologies are deployed and the specific technology's basic infrastructure cost equals that technology's share of expected benefits in the set of deployed technologies. This cost assignment would vary depending on the full set of CV technologies deployed and supported by the basic infrastructure investment. For the Information for Freight Carriers case study, the assumed percentage of total basic infrastructure costs is 26 percent. The CV BCA report focused on the entire United States, so for the individual CV case studies in this compendium the hypothetical State is assumed to have 2 percent (1 of 50 States) of the total U.S. population. The basic infrastructure quantities used in the analysis were derived from that assumption and are shown in Figure 24. When the new cost items are entered into TOPS-BC, the CV BCA report is used to identify which cost elements are needed to perform the appropriate cost analysis. If users want to analyze a specific Connected Vehicle Application deployment strategy, the table allows for a quick identification of the cost items needed. As displayed in Figure 24, this application has several basic cost items that need to be taken into consideration when conducting a BCA. The cost items listed below were considered for this analysis:
Since these cost items are needed for all CV applications, they are discussed in other case studies in this compendium. This CV strategy does not require any other incremental cost items. In order to implement CV Information for Freight Carriers, it is sufficient for the agency to implement basic CV. Figure 24 shows the total annualized costs resulting from the TOPS-BC calculations. Finally, the number of infrastructure and incremental deployments was set to 1 each, because the extent of the roadway structure for the entire CV system and for this strategy in particular is already considered in the quantities shown in each cost line. The project is assumed to be in place in 2020. As Figure 24 shows, these assumptions result in annualized incremental costs of about $1.1 million. BENEFITS In order to estimate the benefits of this strategy, we utilized the data from the CV BCA report which estimates the effectiveness of this strategy to be 7 percent. This means that crashes are likely to be reduced by 7 percent when the strategy is in place. Alongside this assumption is the assumed increase in capacity due to a lower amount of incidents that slow down traffic. The report set this number to 10 percent for all applications. Furthermore, this analysis makes use of the parameters sheet in TOPS-BC. Using this sheet, the user is able to modify certain preset parameters that influence the calculation of benefits and costs. One of these parameters is the percentage of different vehicles present in traffic mix. Figure 25 shows the parameters page within the tool. Note that the orange cells represent the percentage of trucks in the traffic mix. For this analysis, this percentage was set to 100 percent, since trucks are the primary beneficiary of this strategy. This change in the parameter page will result in TOPS-BC calculating and displaying truck related benefits only. 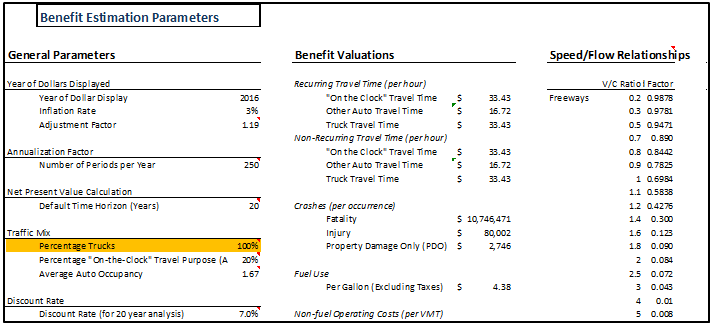 Figure 25. Screenshot. Tool for Operations Benefit/Cost parameters sheet modification for information for freight carriers. Additionally, crashes include three different types of incidents: property damage only, injury, and fatality. Since TOPS-BC calculates the number of each of these types of incidents for all weather conditions and not just for adverse weather conditions, these values needed to be adjusted. For the purpose of this analysis, and based on the CV BCA report, it is assumed that 24 percent of incidents are related to adverse weather conditions. Hence this analysis applies to 24 percent of property damage only, injury, and fatality incidents. Furthermore, since trucks make up a lower share within the traffic mix than cars do, the amount of vehicle-miles-traveled (VMT) used for the calculation was adjusted. This analysis assumes that trucks only make up 1/3 of all VMT, which is why the amount of VMT calculated by TOPS-BC was overridden in the green cells. Figure 26 shows the CV benefit sheet within the tool. The adjusted values for property damage only, injury, and fatality were entered into the green cells in the Facility Performance section of the tool. The green cells can be changed by the user and override the default values used by TOPS-BC. The capacity increase and crash reduction assumptions were implemented below the section Impacts due to Strategy. These values were also entered in the green cells, since TOPS-BC regularly does not consider any changes in capacity and uses a different crash reduction rate. For this reason, the given data within the tools were overridden. These data could come from travel demand models, freeway simulations, counts or other sources. Note that other agency benefits, such as benefits from reduced maintenance costs due to the Information for Freight Carriers are not reflected in the benefit estimation. Analysts are encouraged to independently calculate such benefits and add them into the TOPS-BC estimates. 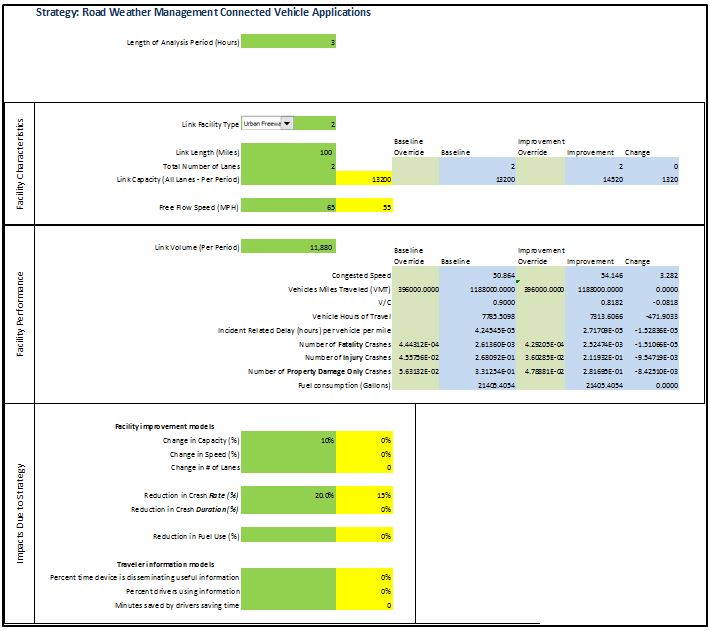 Figure 26. Screenshot. Benefit estimation assumptions for information for freight carriers. Finally, Figure 27 shows the lower half of the CV benefit estimation page. It includes additional sections on travel time, energy, and other safety benefits. The user is able to refine any TOPS-BC calculation using these sections in case more specific data is at hand. Through this flexible user interface, the user can generate refined and more accurate results. The total average annual benefit is calculated automatically by TOPS-BC and can be found the bottom of the benefit estimation sheet. The total average annual benefit for this application is $7.76 million. 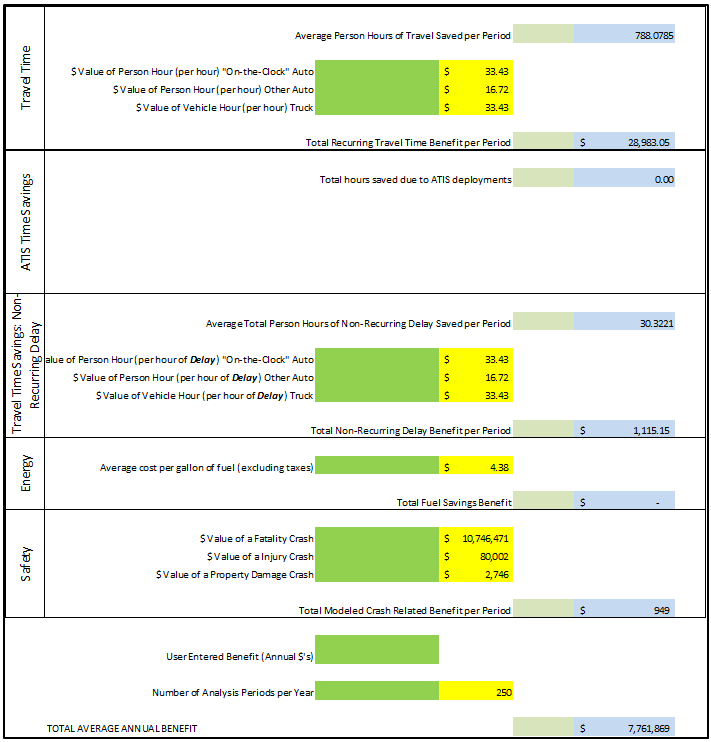 Figure 27. Screenshot. Benefit estimation results for information for freight carriers. Model Run ResultsIn this section, the analysis compares the results of the benefits calculation with the results of the cost calculations. Note that this case study merely analyzes a specific set of costs and benefits for demonstration purposes. A full benefit cost analysis will include a wide range of additional costs and benefits that are not separately listed or analyzed in this case study. Figure 28 shows the section of TOPS-BC that compares benefits and costs for the connected vehicle strategy "CV Information for Freight Carriers." The illustration indicates that the deployment of an information system for freight carriers in the hypothetical State is cost effective, since the resulting BCR for the strategy is almost 7. The resulting net benefits for this analysis are about $6.65 million. 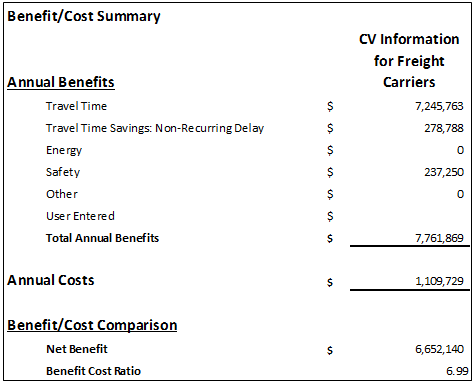 Figure 28. Screenshot. Results for the Connected Vehicle Information for Freight Carriers strategy. 29 Chapters 2 and 3 of this Compendium contain a discussion of the fundamentals of BCAs and an introduction to BCA modeling tools. These sections also contain additional BCA references. [ Return to note 29. ] 30 Chapters 2 and 3 of this Compendium contain a discussion of the fundamentals of BCAs and an introduction to BCA modeling tools. These sections also contain additional BCA references. [ Return to note 30. ] 31 This study adapted a multiplayer feed-forward artificial neural network (ANN) paradigm to assess the large amounts of data collected and to associate it with impact of deployment on shed operating costs. More information on this system can be found in the referenced report at the end of this Case. [ Return to note 31. ] 32 Chapters 2 and 3 of this Compendium contain a discussion of the fundamentals of BCAs and an introduction to BCA modeling tools. These sections also contain additional BCA references. [ Return to note 32. ] 33 Connected Vehicle Reference Implementation Architecture, Enhanced Maintenance Decision Support System, available at https://www.iteris.com/cvria/html/applications/app46.html. [ Return to note 33. ] 34 FHWA, Road Weather Management Connected Vehicle Applications, available at https://ntl.bts.gov/lib/54000/54400/54480/Road_Weather_Connected_Vehicle_Applications_Benefit-508-v8.pdf [ Return to note 34. ] 35 FHWA, Tool for Operations Benefit/Cost Analysis, available at https://ops.fhwa.dot.gov/plan4ops/topsbctool/index.htm [ Return to note 35. ] 36 FHWA, Road Weather Management Connected Vehicle Applications, available at https://ntl.bts.gov/lib/54000/54400/54480/Road_Weather_Connected_Vehicle_Applications_Benefit-508-v8.pdf [ Return to note 36. ] 37 Chapters 2 and 3 of this Compendium contain a discussion of the fundamentals of BCAs and an introduction to BCA modeling tools. These sections also contain additional BCA references. [ Return to note 37. ] 38 Connected Vehicle Reference Implementation Architecture, Enhanced Maintenance Decision Support System, available at https://www.iteris.com/cvria/html/applications/app40.html [ Return to note 38. ] 39 FHWA, Road Weather Management Connected Vehicle Applications, available at https://ntl.bts.gov/lib/54000/54400/54480/Road_Weather_Connected_Vehicle_Applications_Benefit-508-v8.pdf [ Return to note 39. ] 40 FHWA, Tool for Operations Benefit/Cost Analysis, available at https://ops.fhwa.dot.gov/plan4ops/topsbctool/index.htm [ Return to note 40. ] | ||||||||||||||||||||||||||||||||||||||||||||||||||||||||||||||||||||||||||||||||||||||||||||||||||||||||||||||||||||||||||||||||||||||||||||||||||||||||||||||||||||||||||||||||||||||||||||||||||||||||||||||||||||||||||||||||||||||||||||||||||||||||||||||||||||||||||||||||||||||||||||||||||||||||||||||||||||||
|
United States Department of Transportation - Federal Highway Administration |
||