Freight Performance Measure PrimerCHAPTER 4. COMMON FREIGHT MEASURESPublic agencies do not all use the same freight performance measures, but there are some common performance measures that have continually emerged. These include truck travel times, travel time reliability, safety, infrastructure conditions, and congestion. This section provides information and links to common freight performance measures. Truck travel times – Truck travel times can measure freight flow speeds as well as identify speed trends over time. Truck travel times can be obtained by working with private sector members of a Freight Advisory Committee (FAC). Freight stakeholders can supply average freight delivery travel time data that can be compiled and analyzed. Also, data sources such as National Performance Management Research Data Set (NPMRDS), INRIX and American Transportation Research Institute (ATRI) can provide speed data for links to supplement data collected directly from FAC members. Truck travel times – Truck travel times can measure freight flow speeds as well as identify speed trends over time. Truck travel times can be obtained by working with private sector members of a Freight Advisory Committee (FAC). Freight stakeholders can supply average freight delivery travel time data that can be compiled and analyzed. Also, data sources such as National Performance Management Research Data Set (NPMRDS), INRIX and American Transportation Research Institute (ATRI) can provide speed data for links to supplement data collected directly from FAC members. Travel time reliability – Travel time reliability is used to estimate on-time arrival performance of trucks to their delivery destination. It is measured based on the probability distribution of travel times and compares the spread between the median time and 95 percentile time of all trips. This provides a Planning Time Index that allows shippers to know how much time to plan to ensure a 95 percent on-time arrival performance. Safety – Safety metrics consist of truck-involved accident reports. This information should consider fatalities, injuries, time of day, weather conditions, speeds, type of roadway, type of truck, and other vehicles involved. Law enforcement typically produces documentation for every truck crash that is reported. While this is a good source of information, it is not uncommon for the information collected by law enforcement (involving truck crashes) to be incomplete. Education of the need for accurate accident reporting is key to obtaining accurate data to serve as performance measures. Infrastructure (conditions of highways and bridges) – Infrastructure condition data can be analyzed on freight routes to determine freight impacts. States are required to collect Highway Performance Monitoring System (HPMS) data, Proposal and Estimate System (PES) data, and bridge condition inspection data. The data obtained on freight corridors can be used to identify freight performance measures with little to no data collection expense. Congestion – Congestion data are typically collected via Intelligent Transportation System (ITS) sensors and converted to information that is disseminated to the public through sources like the national 511 system. While this data consists largely of passenger vehicle data in addition to truck data, the congestion levels along identified freight corridors can be used to identify freight performance measures. There are also private sector sources for this data including systems like NPMRDS, INRIX, and ATRI. FREIGHT DEMAND MEASURESSeveral of the common freight demand measures are described below. Freight VolumesFreight movement has grown considerably over the past decade and will grow steadily over the long-term. An understanding of current and future freight volumes is an important measurement. The Freight Analysis Framework (FAF) provides comprehensive and multi-modal information to understand levels of freight movement and provides projections for the next 20 years for all modes that practitioners can use in estimates. The HPMS truck count data can be used to measure truck volumes and provide averages of daily and annual truck traffic. Other modal data can provide baseline information for current demand, which can then be compared to FAF data and projections. Jason's Law/Truck ParkingTruck parking shortages are a national safety concern. Jason's law was passed in 2012 as part of the Moving Ahead for Progress in the 21st Century (MAP-21) to prioritize Federal funding toward construction of safe parking lots for truckers to rest. Jason's Law directed the U.S. Department of Transportation (USDOT) to conduct a survey and a comparative assessment to:
These surveys were supplemented by information solicited via customized questionnaires for stakeholder community members, including representatives from truck drivers, trucking firm logistics personnel, and travel plaza and truck stop owners and operators. In 2015, the Federal Highway Administration (FHWA) published the Jason's Law Truck Parking Survey as well as a geocoded file with accompanying database of all the public and private facilities and spaces throughout the United States in response to MAP-21 requirements. The results provided an understanding of truck parking facilities, spaces, usage, and other areas of analysis. This information is available at https://ops.fhwa.dot.gov/Freight/infrastructure/truck_parking/index.htm. Several additional studies have been completed in recent years to analyze the adequacy of truck parking and the associated safety risks. Many of these studies documented projected growth of truck traffic on the Nation's highway system, severe truck parking shortages in some regions, a lack of adequate information for truck drivers about parking capacity at existing facilities, and the challenges associated with routing and delivery requirements and accommodating rest periods. The studies' findings strongly correlate with anecdotal information collected from the trucking industry as well. Additionally, stakeholders supported the development of metrics that would best measure truck parking. Metrics include:
Other metrics for demand, driver, economic valuation, and safety are included for truck parking in Appendix F. FREIGHT EFFICIENCY - HIGHWAY SPEEDS, AVERAGE SPEEDS, RELIABILITYMeasuring efficiency can be done at the segment level, facility level, or corridor level. Most data used to obtain travel times such as the NPMRDS, probe data, or other travel time data (i.e., Bluetooth or ITS) are provided at the segment level. To measure efficiency for larger sections of roads, the practitioner will need to aggregate the segments together. The 2015 "Freight Performance Measure Approaches for Bottlenecks, Arterials, and Linking Volumes to Congestion Report" offers the following performance measures for measuring congestion and reliability, based on travel time (Cambridge Systematics 2015, p. 46):
In addition to the measures recommended above, there are also "second order performance measures" recommended that are a direct result of changes in congestion and reliability. To simplify, first order performance measures can be directly measured. For example, travel speed can be directly measured and could be considered a first order performance measure. An example of a second order performance measure could be the loss of worker productivity based on lost time at work due to slow congestion related travel speeds (the first order measure). Second order performance measures are most commonly used to estimate impacts of bottlenecks and the benefits of improving them (Cambridge Systematics 2015, pp. 64, 65). Two examples of second order performance measures are delay and reliability costs, which are discussed below. DelayDelay Cost – This is the monetized value of delay. It is computed separately for passenger cars and trucks using the following formulas.
Many studies have attempted to quantify the magnitude of delay and then estimate the costs of these delays on an annual basis. One of the most recent studies to address this issue, published in April 2016 by ATRI, calculates Total Delay and Delay Cost utilizing four data sources (NPMRDS, FAF, the FHWA's Freight Performance Measurement [FPM] program Global Positioning System [GPS] data, and ATRI's Industry financial data). At the national level, delay associated with weekday traffic congestion on the NHS totaled over 728 million hours in 2014. This amount of delay is the equivalent of 264,781 commercial truck drivers sitting idle for an entire working year. Applying the 2014 national average operational cost per hour of $68.09 equated to just over $49.6 billion in increased operational costs to the trucking industry. Spreading this cost evenly across the 10.9 million registered large trucks in the United States results in an increased average cost per truck of $4,546" (ATRI 2016, p. 14). For this study, ATRI implemented several standardization procedures so that the results could be compared to future studies that follow the same standardization procedures. "Incorporating these new procedures will allow this 2014 report to become a benchmark of comparison for future study years, as well as allow future year-over-year comparisons" (ATRI 2016, p. 2). The ATRI standardization procedures included:
For additional information on how ATRI quantified the national average operational cost per hour of $68.09, refer to the ATRI report: "An Analysis of the Operational Costs of Trucking: 2015 Update." In ATRI's 2016 report, "Cost of Congestion to the Trucking Industry," there is a variety of information on congestion costs at various levels. States can contact ATRI directly to request congestion figures for their respective metropolitan areas or counties in their State (ATRI 2016, pp. 23, 26). Reliability Cost – In addition to the costs of typical delays, studies have shown that highway users also value reliability, or minimizing the variability in travel conditions. The 2013 Strategic Highway Research Program (SHRP) study, "SHRP2 Project C11: Reliability Analysis Tool," developed a method for computing both typical congestion costs and reliability portions of congestion costs by using a "travel-time equivalent approach." The report includes equations for Travel Time Equivalent for both passenger vehicles and commercial vehicles shown in Figure 8. Figure 8. Equation. Travel Time Equivalent.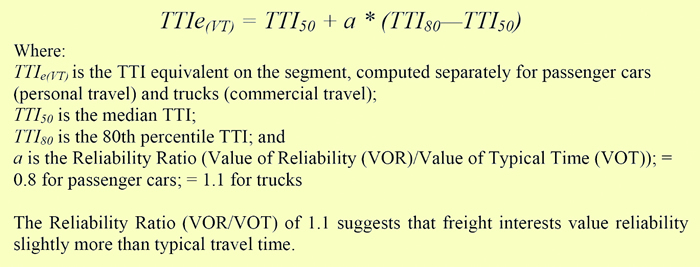
Although there have been improvements in data available for determining congested locations, local knowledge is still very useful in identifying congestion problems. Anecdotal information or observations from field engineers can be used to verify (or eliminate) potential congestion locations and to also identify locations that should be studied but may have been missed. This information can be gathered through formal, or informal, surveys of local engineers, planners, major shippers, and carriers. The survey questions should try to distinguish between commuter bottlenecks (weekday peak-period bottlenecks experienced by all vehicles—trucks and cars) and primary freight bottlenecks (where trucks are the primary vehicles or suffer the most delay). For example, designated port or freight distribution center truck routes can affect truck traffic more than commuter traffic. Depending on time of day or number of ships or trains that are loading and unloading, designated truck routes may experience peak period delays due to poor signal timing, grade crossings at entrances to freight facilities, poor signage, and many other issues that A resource for methods for measuring travel time reliability and understanding the calculations is the FHWA Office of Operations, Office of Transportation Management website, https://ops.fhwa.dot.gov/perf_measurement/reliability_measures/index.htm, which has resources that describe measures and gives examples of congestion measures that employ the metrics suggested. SpeedA common freight performance measure is speed. Freight corridors can have speeds monitored and used as a metric. Speed can also be used as a surrogate for time. While it is not always possible to measure travel times from origin to destination, it is possible to measure speeds. The high cost of congestion and consequences associated with freight delivery delays influence location decisions for distribution centers, manufacturing facilities, and other commercial real estate development. The FHWA collects national freight link speed data, presented graphically on Figure 9 below. Per USDOT Facts and Figures, the national average truck speed data are collected from 500,000 trucks at 250 freight-significant highway infrastructure locations annually (USDOT website 2016). While the national truck speed data graphic provides a national indication of truck speeds (and heavy congestion zones), it does not have the granularity necessary to establish regional and local priorities based on truck speeds. Figure 9. Map. Average truck speeds on select interstate highways, 2010.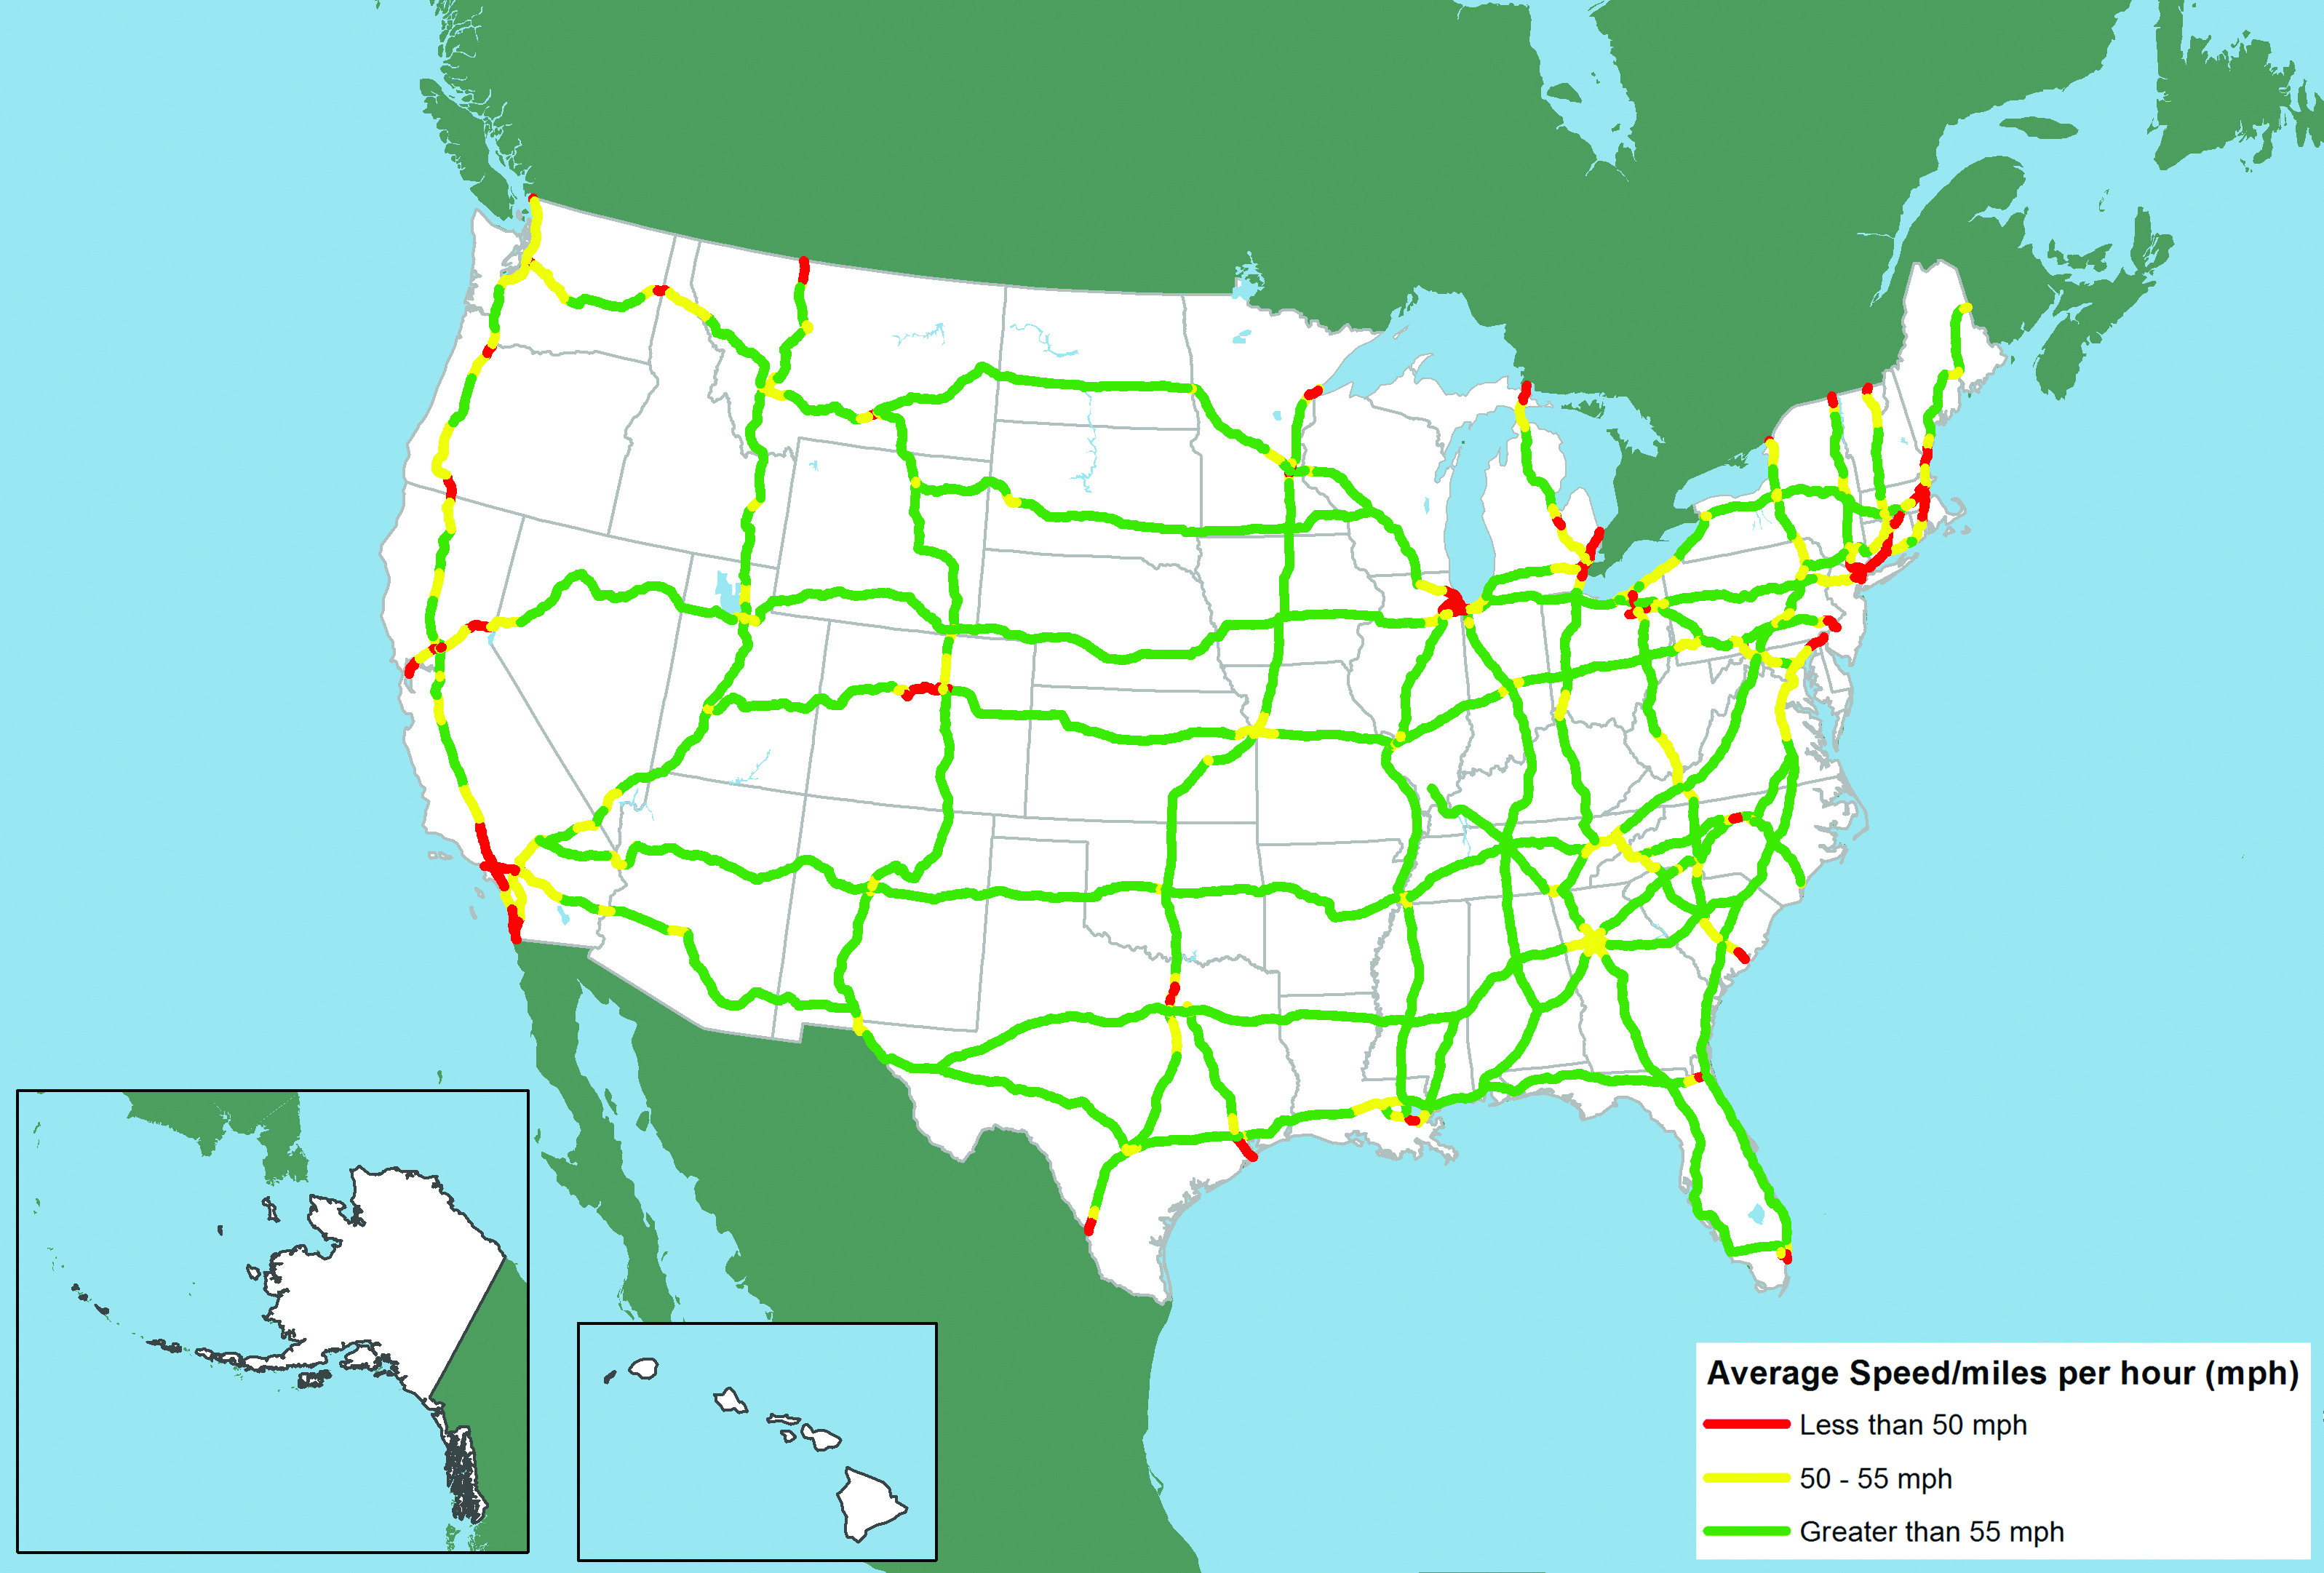
Source: Federal Highway Administration. FREIGHT MODELINGFreight planning and forecasting employ a variety of tools and techniques, including economic trip-based models, and other analytic tools. Typically, data for forecasting models is obtained and maintained by public agencies. A variety of data sources are used, such as local data (including traffic counts, traffic forecasts, demographics, and land use), the National Transportation Atlas Database, the Commodity Flow Survey, the FAF, Transearch data, and numerous Federal sources. In addition to the public data collected, modeling also utilizes a variety of private sector data sets. Some of these include private shipper data, purchase orders, bills of lading, and ship manifests. These tools can be used in freight planning and forecasting to document existing demographic and employment conditions and characteristics of freight transportation (tonnage, origin/destination, and modes of transport). They can also be used to estimate the future measure of transportation (tonnage, origin/destination, and modes of transport) based on projected changes in population, employment, development, and economic forecasts. Current forecasting and modeling tools have their limitations, however. Most commodity flow data sources are geared towards larger geographic regions and do not necessarily translate effectively to local planning efforts. Additionally, current tools do not accurately depict the complexities of the supply chains. Numerous factors influence transportation needs making it difficult to link the data resources (land use, demographics, and/or employment) to the freight activity that relates to these measures (truck counts, rail activity, and/or vessel activity). Generally, transportation forecasting models focus on average trip generation rates; however, freight activity does not lend itself to average rates of production and consumption. Lastly, third- party providers make freight less visible to shippers and receivers, making it more difficult for the public sector to document freight activity through the normal channels (Transportation Research Board [TRB], SHRP July 2013). Valid performance metrics can and should be used as variables in the freight models that exist today. Performance metrics such as congestion, safety, and travel speeds will affect freight modeling outcomes, which in turn can directly affect infrastructure investment decisions. BottlenecksFreight congestion problems are most apparent on highways that routinely experience recurring congestion and traffic backups because traffic volumes exceed highway capacity. Bottlenecks are estimated to account for about 40 percent of vehicle hours of delay. The balance, about 60 percent of delay, is estimated to be caused by nonrecurring congestion, the result of transitory events such as construction work zones, crashes, breakdowns, extreme weather conditions, and suboptimal traffic controls. Freight bottlenecks occur on highways that serve high volumes of trucks. They are found on highways serving major international gateways like the ports of Los Angeles and Long Beach, at major domestic freight hubs like Chicago, and in major urban areas where transcontinental freight lanes intersect congested urban freight routes. A freight bottleneck is defined by a combination of three features: the type of constraint, the type of roadway, and the type of freight route. A freight bottleneck may be caused by congestion at an interchange on a freeway serving as an intercity truck corridor, or by poorly timed traffic signals at intersections on an arterial road that serves as an urban truck corridor. Truck bottlenecks may also include "truck specific" delays caused by roadway features that impact truck movements, such as steep grades, substandard vertical or horizontal clearances, weight restrictions, delays at border crossings or terminals, or truck operating restrictions. The identification of a freight bottleneck starts with simple methods to scan for potential locations. The "Freight Performance Measure Approaches for Bottlenecks, Arterials, and Linking Volumes to Congestion" Report suggests the following data upon which scans can be based:
Most of the methods reviewed attempted to identify recurring bottlenecks, including physical characteristics often associated with bottleneck locations such as interchanges, bridge crossings, and lane drops that were matched against the data scans. This step was necessary to identify other causes of slow speeds, such as long-term work zones or bad weather, and to give the bottleneck an identity. Performance measures used in the studies are the usual suite of travel-time-based measures made truck-specific. Delay is a common metric because it can be valued. The performance of trucks on arterials is important because of first and last mile access to origins and destinations, ports and transfer facilities, but it has not been widely studied. This is because more serious truck bottlenecks occur on freeways and are due to the limited availability of data on port and transfer facility access. A few studies have used vehicle probe data to study port and transfer facility access, but this does present some technical concerns. More recent studies, which use vehicle probe data to develop detailed travel-time measures, rely on planning-level estimates of truck volumes. A step by step guide to measuring bottlenecks is available on FHWA's website: https://ops.fhwa.dot.gov/publications/fhwahop15033/index.htm#toc. The FHWA recommends that States and Metropolitan Planning Organizations (MPOs) consult this reference for guidance in addressing bottleneck analysis and understanding the application of the NPMRDS or other probe data for bottlenecks. (USDOT 2013) RAILROAD SPEEDS AND RELIABILITYSpecific railroad reliability measures are rarely published, unless used to help support justification for a project seeking public funds. Public sector practitioners have sought rail speeds and reliability hoping to achieve multi-modal measures and identify freight bottlenecks. While specifics are not available, practitioners can consult some private sector resources for possible aggregated data. Train speeds are measured by the haul times between terminals, with average speed being calculated by dividing train miles by total hours operated (excluding yard and local trains, passenger trains, maintenance-of-way trains, and terminal time) (refer to Table 4 for 52-week unweighted averages). The six major North American railroads voluntarily report train speed on a weekly basis. In addition to a composite speed, the railroads report train speed for various components of their network, such as Intermodal, Multilevel, and Coal Unit. Data is only presented at the national level; therefore, obtaining estimated speeds for a State or region may be challenging.
FREIGHT SYSTEM CONDITION INDICATORSBridge Structural DeficienciesThe National Bridge Inventory is the primary source of data for evaluating the conditions of over 116,660 bridges on the NHS in the United States. The overall performance trends for NHS bridges have improved since the early 1990s. Structural deficiencies as a percentage of total bridge deck area on the NHS have dropped from 13.3 percent in 2001 to 9.1 percent in 2010. The primary considerations in classifying structural deficiencies are the bridge component condition ratings for the deck, superstructure, and substructure. These structural deficiencies are considered separately from functional deficiencies such as width, vertical clearance, approach curvature, or other factors that may reflect current design standards and not the structural integrity of the bridge. Certain structural deficiencies could result in load limits, which can affect freight movement. Functional deficiencies may result in vertical or horizontal clearances that hinder freight movement, particularly for oversized loads. States are required to report this information to FHWA, so States and MPOs would already have an assessment of bridge data. Intermodal Connector ConditionsThe NHS freight connectors are the public roads leading to major intermodal terminals. NHS connectors were designated in cooperation with State departments of transportation (DOTs) and MPOs based on criteria developed by DOT. Although they account for less than one percent of NHS mileage, NHS connectors are key conduits for the timely and reliable delivery of goods. Hence it is important to evaluate the condition and performance of connectors and related investment needs. Pavement ConditionsStates collect extensive pavement condition data as part of their pavement management systems and asset management plans. States provide FHWA the following pavement condition data for HPMS on the full extent of the NHS and a statistically valid sample of other roadway sections:
The HPMS data are compiled every year and are used for national system monitoring. The data are included in FHWA's biennial Condition and Performance Report to Congress. FREIGHT ENVIRONMENTAL MEASURESEmissionsPractitioners can estimate air quality by estimating volumes of pollution from sources of emissions. Pollution is typically measured in tons or metric tons and is generally estimated for particulate matter, oxides of nitrogen, volatile organic compounds, ozone, and greenhouse gas emissions. Data is available from State environmental agencies, State DOTs, MPOs that are part of non-attainment areas, and the Environmental Protection Agency (EPA) for all modes. This information is useful in State Freight Plans and for project evaluation, but it is also required by the EPA. The EPA promulgated the Air Emissions Reporting Requirements (AERR) in December 2008. The AERR consolidated and streamlined previous requirements of several older rules for States and local air pollution control agencies to submit emissions inventories for criteria pollutants to EPA's Emissions Inventory System. The EPA uses these submittals, along with other data sources (primarily for air toxics), to build the National Emissions Inventory. Many of the States voluntarily report air toxics along with the required criteria air pollutants, and these air toxics reports are also used to build the National Emissions Inventory. FREIGHT SAFETY MEASURESTruck Injury and Fatal Crash RatesHighway injuries and fatalities involving trucks are generally much lower proportionally than the percentage of all highway crashes, despite the higher number of miles traveled by these vehicles each year. Although truck traffic has a relatively good safety record, concern over truck safety remains significant because of the size, weight, and reduced handling characteristics of trucks compared to automobiles. To provide a more stable measure over time of the trucking industry's safety performance, the most common measure used is the number of injury and fatal crashes involving trucks per 100 million miles of travel. The National Highway Traffic Safety Administration (NHTSA) is the most reliable source of data for this measure. However, a major challenge is that States code truck-related incidents differently, so a push for common coding is necessary to truly understand the impacts of truck-related injuries and fatalities. Highway-Rail at-Grade IncidentsHighway-rail at-grade crashes occur when a rail user and a highway user impact at a crossing site. This includes motor vehicles and other highway, roadway, and sidewalk users at both public and private crossings. Overall, the safety for highway-rail at-grade crossings in the United States has improved over the last two decades, most noticeably from 2000 to 2003 and from 2006 to 2008. Although the number of at-grade crossing incidents has decreased, the Federal Railroad Administration (FRA) has prioritized the modernizing of grade crossings and the evaluation of public education and awareness strategies to reduce incidents on railroad rights-of-way. Railroads operating in the United States are required to submit monthly accident reports to FRA and crash data updates are published monthly. The FRA website allows users to query the incident database with a wide range of filters, including railroad, State, county, public and/or private crossings, and start/end date. FREIGHT ECONOMIC DEVELOPMENT MEASURES AND ANALYSISOrigin and Destination PairsThe "Freight Performance Measure Approaches for Bottlenecks, Arterials, and Linking Volumes to Congestion" Report looks at Origin and Destination (O/D) pairs and discusses challenges with obtaining quality O/D data. The report notes that past studies have focused on the facility-based view of truck impacts but truckers and shippers are usually more concerned with the performance of the entire trip. Facility performance is more common since it is at the level at which the data are available to State DOTs. True O/D data that defines entire trips are not readily available to public agencies. The study recommends that in general, incorporating the user's perspective into freight performance is a key step to advancing the state of the practice. However, both perspectives provide for a comprehensive freight performance management program, especially since most improvements that can be effected by transportation agencies are facility focused (Cambridge Systematics 2015, p. 3). The GPS readings produce data from on-board or personal devices, but are heavily processed by the vendors so that any specific O/D data are aggregated. This is true of the vendors that provide the data as speeds assigned to a link, usually defined by the Traffic Message Channel standard. When using link data for freight purposes, specific freight truck data (rather than general traffic data) is recommended as several studies have confirmed both route and speed differences between cars (including taxis and limousines) and freight trucks (Cambridge Systematics 2015, p. 3). A number of methods can be used to understand O/D. First, States and MPOs can talk to their freight stakeholders to understand actual business patterns. Anecdotal information is important to customize O/D analysis and identify the correct locations of interest. Second, the FAF, Commodity Flow Survey, and other economic information, such as the Census Business Patterns, are all great resources to identify origins and destinations or key freight nodes, freight generators, and their trading partners. For more information, consult the FAF documentation and resources on FHWA's website that illustrate how to apply FAF analysis in an O/D analysis. Additionally, ATRI data can aid in the development of anonymous O/D truck trip models and tables. States may contact ATRI directly for information on obtaining these data. Other methods to obtain performance measure data include working directly with Freight Advisory Committees (FACs) and private sector stakeholders to obtain actual O/D data. Practitioners can also investigate using ITS technology probe data collected through traveler information systems, and partnering with university research centers for collecting O/D survey data from industry representatives. Economic EvaluationThe U.S. freight network consists of over 985,000 miles of federally aided highways, with most national and international freight moving along the interstates. Freight reliability is essential along these corridors to promote economic competitiveness and economic growth. However, many of these facilities suffer from significant congestion and deteriorating conditions that negatively impact the flow of goods and the economy they support. Understanding the relationship between freight activity and economic influences, such as fuel prices, employment rates, inflation, and economic trends, provides valuable information on how the freight industry functions and evolves as the economy changes. Understanding these trends is key to obtaining the analytics and insight needed for the continued support of the freight industry's role in the U.S. economy. FHWA recently published a reference document on how to adapt economic valuation tools for freight analysis. This work focuses on measuring economic performance through three tools: 1) benefit-cost analysis (BCA), 2) economic impact assessments, and 3) analyses focused on estimating the impact of transportation on industry productivity and competitiveness. This document is available on FHWA's website: https://ops.fhwa.dot.gov/publications/fhwahop15034/ch1.htm. The practitioner can develop measures of economic activity or benefit for freight projects using these types of measurement tools. These measures can also be used in project or plan development. This document also provides a description of how typical performance measures relate to economic activity. For example, the average speed and the transit time performance measures have similar economic impacts. The difference in these performance measures is in how they are measured and the perspective of the agency using the performance measure. The transit time performance measure is more often used by shippers, who focus on how long it takes to move a shipment between two points. The average speed measure is more often used by transportation planners, who are considering how investments in infrastructure can improve the performance of specific segments of the transportation network. Reliability and transit time variance are also closely related performance measures. Reliability measures the variability of congestion or delay on a specific roadway segment. This measure would typically be used by a transportation planner. Transit time variance provides a measure of performance from the perspective of the shipper, measuring the level of unexpected delay for the shipment. There can be significant differences in what these performance measures capture. For instance, vehicle speeds are often measured for peak and off-peak traffic. If freight traffic moves disproportionately at night, improvements in peak speeds may have a smaller impact on truck traffic. Factors other than vehicle speeds on the network affect transit times. The hours-of-service rule for truck drivers is one example of this. Drivers who have exhausted their allowable driving time are required to stop. Transit time and average vehicle speeds measured on the network are thus not always related in linear fashion. Because some of the performance measures discussed are closely related or overlap, there is also some overlap in the economic factors. Some of the economic factors are more easily measured than others. For instance, the average speed and transit time performance measures affect vehicle and driver costs for the truck, which affects the cost of delivering freight. These costs are traditionally measured in BCA. Estimating driver labor costs is relatively straight-forward, as time savings can be translated into monetary values using estimates of average driver wages and benefits. Data is available to represent the capital and operating costs associated with the truck. The cost of delay for the freight shipper and receiver is more complex, depending greatly on the type and value of the freight carried, and how the freight shipment is being used by the customer. The average cost of delay for freight can mask a wide range of costs for different commodities, consuming industries, and customers. Estimating how performance measures affect long-term productivity improvements in industry is even more complex. These effects include increasing the supply and market areas, providing access to lower cost or higher quality suppliers, allowing for improved inventory management and a more efficient supply chain. Over the long-term, improvements such as these may allow for business reorganization, expansion, and increased economies of scale. Table 1, presented in the executive summary, summarizes the performance measures and the economic factors that can be linked to them. FREIGHT ACCESSIBILITY MEASURESTwo types of freight accessibility measures are infrastructure-based and area-based. Infrastructure-based measures focus on the mobility associated with transportation infrastructure or services. Area-based measures quantify the accessibility of a given location (Geurs & van Wee 2004). These two measures differ in their measurement approach, but are interrelated in their capacity to identify and assess freight accessibility problems or constraints. Infrastructure-based measures are best suited to identifying the transportation performance factors that may constitute the sources of accessibility constraints. Area-based measures quantify the accessibility of a given location or user group. In addition to measures that fit into the more academic categorization of infrastructure- or area-based measures, there is another class of measures that can be classified as network coverage or completeness measures. Rather than measuring performance on specific links or at specific nodes within the transportation network, these additional measures describe properties of the network itself and are addressed along with infrastructure-based measures. INFRASTRUCTURE-BASED AND NETWORK MEASURESInfrastructure-based measures capture the level of performance on transportation infrastructure that serves a given place. Infrastructure-based measures are applied at the link- or corridor-level, and in some cases to nodes within the system. They measure factors that affect accessibility and thus overlap considerably with other (non-accessibility) categories of transportation and freight performance measures. Common infrastructure-based measures used to characterize factors affecting freight access are shown in Table 5, along with a description of the infrastructure elements to which they are typically applied, and the other performance areas to which they also relate. Infrastructure-based measures can be applied to any set of selected links and nodes. In some cases, the measures are applied to specific corridors, links, or nodes that have been identified by planners and freight stakeholders as being particularly important to freight movements. In this case, the measures incorporate an implied focus on origins and destinations. For example, the American Association of State Highway Transportation Officials (AASHTO) Standing Committee on Performance Measurement suggests that targets for their proposed Annual Hours of Truck Delay (AHTD) measure and their Truck Reliability Index (RI80) could be established "for truck trips on multi-state corridors between major city pairs, and at major international border crossings" (AASHTO 2013). Similarly, Virginia experimented with a distance-weighted TTI metric for all road links within a 10-mile buffer of key freight nodes (Michael Baker Inc. et al. 2012). Infrastructure-based measures, however, do not directly incorporate measures of the activities that attract freight movements (i.e., the opportunities afforded by freight accessibility). Area-based measures, discussed in the following section, offer this crucial "access to what" perspective.
Network coverage and completeness measures, like infrastructure measures, capture characteristics of the transportation system without directly measuring land-use and activity distributions in a geographic space. These measures evaluate network properties related to the coverage, directness, and connectivity of the transportation system. In practice, these measures are applied to a geographic area and are used to compare network characteristics across different target areas. Table 6 presents a set of measures that could be applied to a local or regional geography around a point of interest (e.g., a freight generator such as a port or industry cluster). This set of measures was developed and tested by the Virginia Department of Transportation (VDOT) as part of that agency's pilot on accessibility measures. The local measures capture last-mile issues, while the regional measures are aimed at issues of network connectivity at the scale of a same-day truck delivery market.
AREA-BASED MEASURESArea-based measures capture the accessibility of a location or area, relative to a set of other spatially distributed activities. Within the academic literature, area-based measures are more broadly accepted than infrastructure-based measures as measures that capture the full meaning of accessibility—access for whom and to what. They measure accessibility itself, rather than measuring performance or composition of the transportation network that enables or constrains freight access. Nevertheless, infrastructure-based and network measures can also capture elements of accessibility if they are applied to key O/D pairs or to key freight generators. There are three key dimensions of an area-based measure that together define the details of any measurement approach:
Figure 10 presents a taxonomy of these three dimensions, with various options presented under each of the three headers. Figure 10. Chart. A taxonomy of the most common area-based measurement approaches.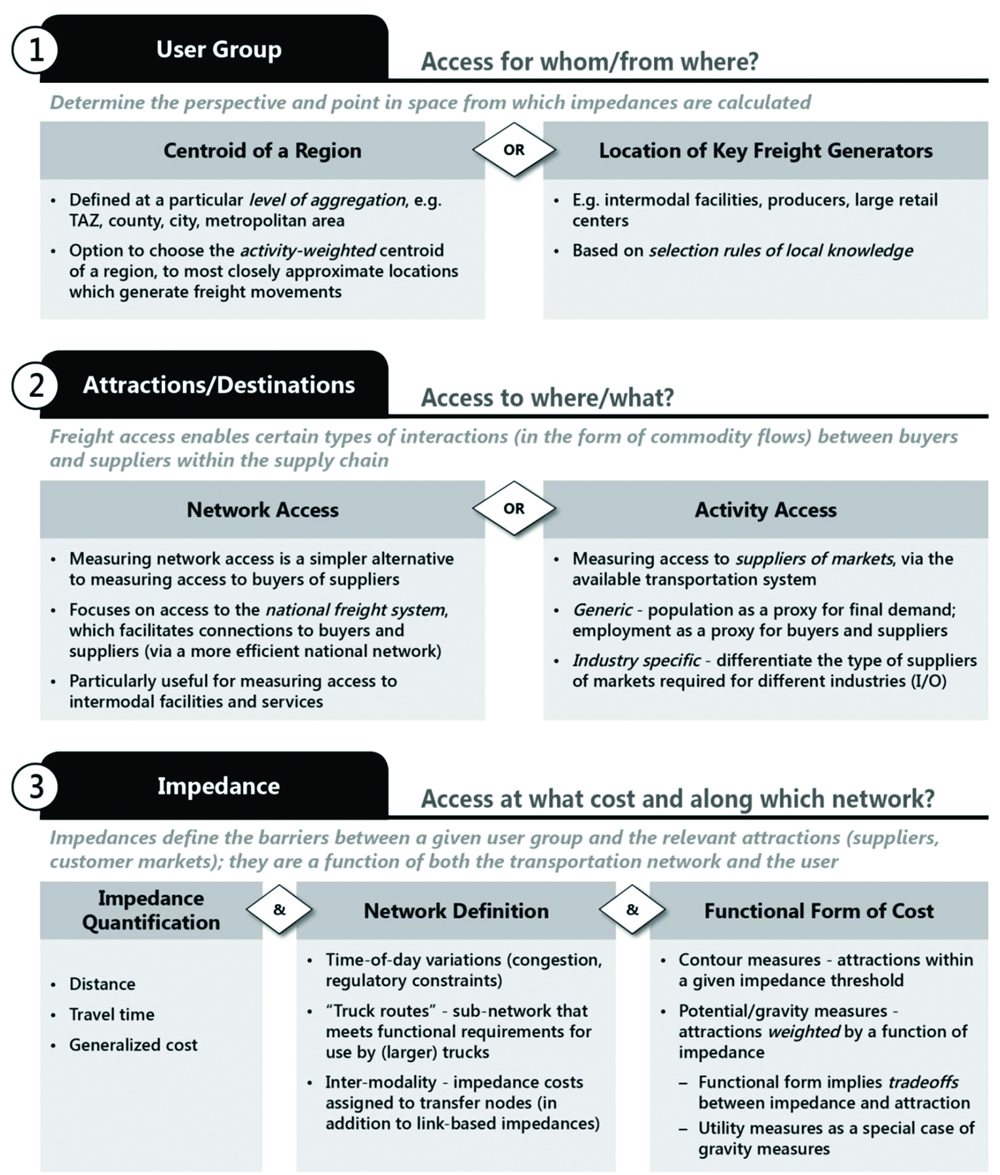
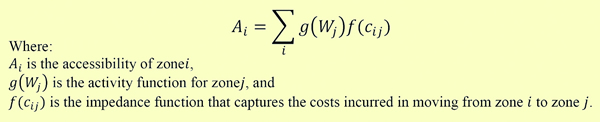
Source: Federal Highway Administration. User GroupThe first dimension within this taxonomy is that of the user group. The analyst must select the point in space from which impedances are calculated. If the process is to be applied in an automated or uniform fashion across an entire region, the most common choice is the centroid (weighted or unweighted) of a zone—a transportation analysis zone from a travel demand model, for example. An alternate approach is to focus specifically on generators of freight activity such as ports, warehousing districts, large box stores, and other freight generators. This approach does not attempt to develop a measure of access for every zone in a region; rather, it selects a set of freight generators and thus focuses the analysis. This approach appears in State practice. For example, the Minnesota Statewide Freight Plan (Cambridge Systematics 2005) reports on measures of the percent of major generators with appropriate roadway access to interregional corridors and major highways. The focus on specific generators is akin to the focus of certain infrastructure-based measure approaches on identified subsets of the transportation system that are particularly important for freight movements. Attractions or DestinationsThe second dimension is the attractions or destinations to which access is measured. The "access to what" component of analysis is central to the idea of accessibility. Accessibility is about providing businesses with access, throughout the entire supply chain, to (a) their required material inputs that must be transported from the location of relevant suppliers, and (b) markets for their products, accessed by means of transport to the location of relevant buyers. Given the disaggregated and varied nature of industry requirements, there are a variety of approaches available for measuring relevant activities or opportunities. Each approach creates a proxy variable at some level of abstraction. Accessibility metrics are necessarily aggregate, and no area-based measure will by itself fully capture the level of access an individual business has to its potential buyers and suppliers. Nevertheless, there are opportunities for industry-specific approaches. A network access approach uses access to the national freight system (defined as access to a highway interchange, rail terminal, or a port) as a proxy for the buyer and supplier markets that are more efficiently accessible via the higher-speed and lower-cost "backbone" of the transportation system. It focuses on the impedances of so-called "last mile" connections and, in some cases, the importance of intermodal services. If measuring access to an intermodal facility, the analyst may choose to incorporate an activity variable that captures the level of service provided by the other mode (e.g., number of flights or trains per day or number of destinations reachable). Adding this weight would result in a functional form more like that of the activity access metrics discussed next (refer to Figure 11).
Activity access approaches seek to quantify the specific activities that are accessible via the available transportation system (the Wi in Figure 11). The most common approach is to proxy activities by counts of population or employment within a given accessible area. This population most closely acts as a proxy for final demand, while employment serves as a proxy for buyer and supplier firms. This generic approach could also be expanded to an industry-specific approach that would, for a given industry, target known categories of input suppliers and output consumers. ImpedancesThe third dimension of calculating an area-based accessibility measure pertains to the quantification of impedances—the barriers between the user group and the identified attractions/destinations. Here the analyst defines the approach along three dimensions: impedance quantification, network definition, and the functional form used to incorporate impedance values into the overall accessibility metric. Impedance can be quantified in units of travel time, travel cost, or generalized cost (which generally incorporates time, cost, and sometimes other relevant non-monetary costs of freight movements). These costs must be then calculated on a selected network representation of the available transportation system, such as a network within a Geographic Information System (GIS) based system, travel demand model, or other routing software. Finally, the analyst must select a functional form with which to incorporate impedance values into the overall accessibility metric (the f(cij) in Figure 11). There are two common classes of functional forms adopted for accessibility measures: contour measures (also called cumulative opportunity, isochronic, or threshold measures) and potential/gravity-type measures. Contour measures count the attraction activities within a given impedance threshold from the point of origin. Thresholds are usually selected with some behavioral basis, e.g., using a three-hour threshold to capture the range for same-day truck deliveries. Potential measures, on the other hand, are continuous measures that count all activities in the region, weighted by a function of impedance. The chosen functional form of a gravity measure implies a tradeoff or equivalence between units of impedance and units of attraction (not necessarily 1:1). Utility-based measures are a special form of the more general gravity measure. They are based on a discrete choice theory and represent the utility of available choices, with the choice set being the activities located in all other zones, and the utility function representing preference-based weighting of costs and attractions for a given entity (individual or industry). Utility-based measures are derived from the estimation process used in discrete-choice modeling and represent observed behavior. FUTURE PROGRAMS (FREIGHT FLUIDITY)Transport Canada has developed an innovative approach to measuring freight performance that has been an excellent economic development and system improvement tool at the national, provincial, and local government levels. Canada's "Fluidity System" approach incorporates multi-modal freight movement data on key freight corridors and infrastructure and reveals congestion points and trends. Truck transit GPS travel time data is obtained from a third-party provider and this information is used to understand the multi-modal performance of goods movement in the United States and across the borders of both Canada and Mexico. (Transport Canada 2014). This information has been used to identify where operational investments are most needed to improve the system and has helped Canada to realize economic and environmental improvement opportunities. Most notably, this national effort has been applied to provincial and local governments, as the tool can be focused both broadly at the total system level and specifically on congestion points. Canada has begun to include select U.S. locations, highlighting the importance of considering freight flows throughout North America and the importance to the regional and global economy. The FHWA is leading efforts in the United States to implement a fluidity system of freight performance measures and analysis. The FHWA has assembled partners from Canada and Mexico, other operating administrations, Federal agencies, academic institutions, the TRB, and the private sector to discuss and design a path forward for implementing a fluidity system in the United States. In addition, the I-95 Corridor Coalition (I-95 CC) and Department of Commerce (DOC) are applying the concept of fluidity to major supply chains and corridors in a limited way using only truck probe data. A similar effort is underway with the North American Transportation Statistics Interchange to apply the fluidity concept using probe data to the North American Free Trade Agreement (NAFTA) corridor from Windsor, Ontario to Nueva Laredo, Mexico. These efforts focus on the use of truck probe data and will supplement multi-modal data as their projects progress to illustrate the performance of multi-modal connections. An application of multi-modal freight flows encompassing the full trip of goods (e.g., port to rail to highway to customer) such as the one Canada has implemented has not yet been developed in the United States. FHWA plans to build on the research path designed through TRB efforts and will use the results of the I-95 CC and DOC concepts to advance corridor and mega- regional approaches to multi-modal fluidity measures. The focus will be on U.S. freight flows, but FHWA intends to coordinate with Canada and Mexico to explore a North American application. This project is supported by stakeholders, USDOT operating administrations, and Federal economic, environment, agriculture, energy, and related agencies. Additionally, this project responds to calls from the private sector for public sector support for freight infrastructure improvements and economic growth. The MAP-21 and the Fixing America's Surface Transportation (FAST) Act legislations require the USDOT to develop new tools and/or improve existing tools to support an outcome- oriented, performance-based approach to evaluating proposed freight related and non-freight related transportation projects. One potential method could be to use fuel tax documentation to approximate monthly truck movements. Using fuel tax documentation to approximate the movement of trucks across the United States is based on the premise that all truck movements are a series of trips beginning at a fueling station. Each truck travels a certain distance until it runs out of fuel, which is based on the average miles per gallon for specific truck sizes. Origins of all truck trips are identifiable as the addresses of the fueling stations that are reported on the monthly fuel tax reports. Trucks can only travel within an area bounded by the distance allowed on an average fill-up, effectively providing a known area where all truck travel associated with each fueling station occurred. For additional detail on this potential truck movement tracking method, refer to Appendix G. | ||||||||||||||||||||||||||||||||||||||||||
|
United States Department of Transportation - Federal Highway Administration |
||