Freight Performance Measure Primer
APPENDIX G. INNOVATIVE RESEARCH: USING FUEL TAXES TO
TRACK TRUCK MOVEMENT
INTRODUCTION
The Moving Ahead for Progress in the 21st Century (MAP-21) legislation and the subsequent Fixing America's Surface Transportation (FAST) Act legislation require the U.S. Department
of Transportation (USDOT) to develop new tools and/or improve existing tools to support an outcome-oriented, performance-based approach to evaluating proposed freight-related and non-
freight-related transportation projects. These tools must include developing methodologies for analyzing benefits and costs of transportation projects and ensure that projects consider safety,
economic competitiveness, environmental sustainability, and system condition.
ISSUE
USDOT utilizes a variety of resources to collect freight related data including Freight Analysis Framework (FAF), Commodity Flow Surveys (CFS), and vehicle probe data. But this data
does not show the complete picture of how freight moves within the United States. Many data gaps still exist, such as the lack of local commodity flow data, origin/destination data, zip code
data, trip frequency data, routing information, and better accident or crash data that will require additional multi-modal research and development.
POTENTIAL SOLUTIONS
The method of using fuel tax documentation to approximate truck movement across the United States is based on the concept that truck movements can be observed as a series of trips with
each trip beginning at a fuel station. Each truck travels a limited distance until it runs out of fuel. Its next trip begins after refueling. This method collects the known location information of the origins of all truck trips: the addresses of the fueling stations that are reported on the monthly fuel tax reports. All trucks refueling at a given station can only travel within an area bounded by the distance they can travel after refueling. This results in a known area where truck travel associated with each fueling station occurred. The center of that area is the fuel station address. Regardless of whether a truck returns to the same station or travels to another fuel station, its miles traveled can always be associated with the station where it began its trip.
Using geospatial software, fuel consumption areas are mapped, yielding information such as:
- Macroscopic level: Plot the fuel consumption at all distributor addresses graphically to present the variations in density of travel across the United States. In addition, comparing
the results across multiple timeframes and only displaying where changes occurred would result in trend maps that emphasize where change is happening.
- Microscopic level: Assign all truck mileage associated with each distributor's area to specific truck route segments in that area. The truck mileage could be assigned in a logical manner such as using weighted average daily traffic (ADT) values. The geospatial database could sum the segment mile totals from all overlapping fuel distributor areas to give a total of all truck traffic for each segment. The resulting map would then display
truck travel densities per roadway segment. In addition, trend maps can be produced, comparing maps across multiple timeframes, displaying only the changes.
METHODOLOGY
Step 1 - Create a template for each fuel vendor (refer to Figure 12):
- The center represents the address of a fuel vendor such as a truck stop.
- The radius represents the maximum travel distance a typical truck can drive between a
typical fill-up (calculation based on average fuel consumption rates and typical fill-up
quantities).
- This template represents the territory where that fuel will be spent, which also equals the
territory where all truck miles associated with that vendor will travel.
Figure 12. Diagram. Fuel vendor location and average distance of truck travel.
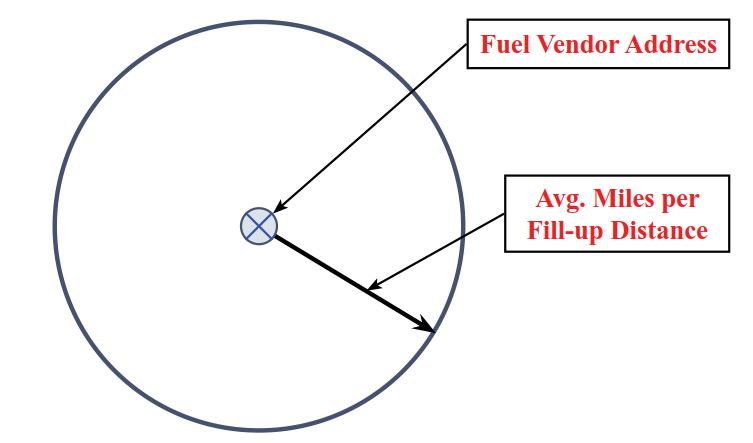
Source: AECOM.
Step 2 - Place vendor template on a GIS map of truck routes (refer to Figure 13):
- The center of the template is placed at the address of the fuel vendor on the GIS map.
- The truck routes within the circle represent all possible routes for trucks to use in that area as they consume the fuel.
- The ADT (acquired from State GIS databases) is then captured for each roadway segment that falls within the circle.
- Each segment's centerline mileage is multiplied times its ADT value to produce a vehicle miles traveled value for that segment. If a State distinguishes ADTs by vehicle type, that
would be a more precise method.
- All segment vehicle miles traveled are then totaled to produce a grand total for the vendor area.
- The contribution (percentage) of each segment's vehicle miles traveled then becomes a multiplier. This multiplier is stable over time and represents to what extent trucks use that
segment.
- The gallons of truck fuel reported by that vendor on their monthly tax statement is then converted to total truck miles by multiplying the total gallons times a typical truck's fuel
consumption rate.
- Each roadway segment is then assigned a portion of the total miles driven by multiplying the total mileage times the multiplier for that segment.
The resulting table approximates how the total miles driven by trucks fueling at that vendor can be assigned specific roadway segments each month.
Figure 13. Diagram. Roadway segments attributed to fuel vendor.
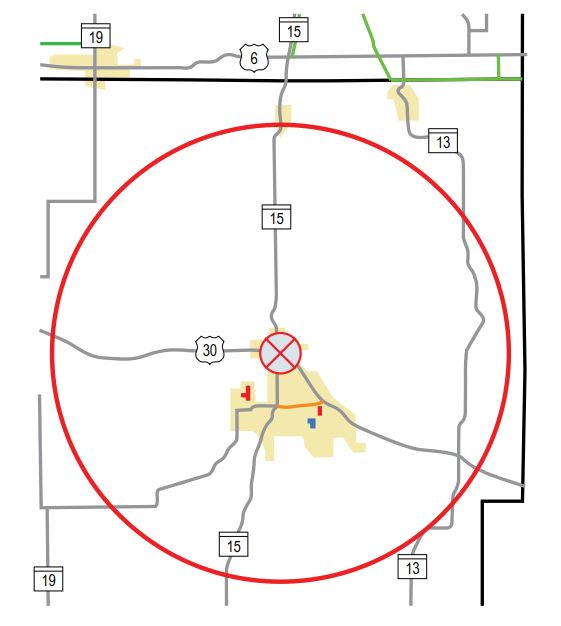
Source: AECOM.
Step 3 - Repeat Step 2 for all vendors:
- Repeat the mileage assignments in
Step 2 for each vendor reporting fuel
tax. The template circles will overlap.
- Sum the truck miles traveled on each
individual roadway segment across all
vendor templates.
The table of segments represents approximately where all the truck miles were driven during that month. Once the model is created (Steps 1 through 3), it can be updated by replacing the monthly fuel usage reported by all vendors.
Step 4 - Derive performance measures
The resulting table applied to a GIS database can be used for a variety of purposes including:
| a) | At the macroscopic level, a "heat map" could show roughly where the truck traffic is operating. Plotting semi-transparent circles to represent the fuel quantity dispensed at all distributor addresses will show the variations in density of travel across the United States. |
| b) | At the microscopic level, truck route segments would provide a more detailed
presentation of truck traffic volumes. |
| c) | Historical fuel tax reports could be used in analysis. Any time range could be used, but
the smallest unit would be in months (the typical vendor fuel tax reporting frequency). |
| d) |
A table or map displaying changes can identify trends in behavior, such as comparing the vendor node values or segment values across multiple timeframes. These changes could
result from a number of causes such as seasonal, weather impacts, economic downturns, or commodity usage trends. |
ADVANTAGES
There are many advantages to this tool. One advantage is the ease of data acquisition. Data would be available for any area, and there are no privacy issues related to acquiring vehicle miles traveled minimizing trucking industry concerns.
This tool can also be used to:
- Enable the use of historical data to produce truck traffic volumes.
- Monitor freight movement trends over different time frames.
- Monitor when shipping contracts and manufacturing rates change because of economic trends.
- Enable methods for assessing changes in truck movements at different levels over different
periods of time:
- Macroscopic: changes in regional wholesale fuel distribution would indicate changes
in regional truck miles driven.
- Microscopic: changes in truck miles driven by route could be estimated.
The results of this tool can be used to:
- Identify trends in freight movements at local and regional levels beyond commodity analysis
- Study locations for new commercial/industrial facilities that have high freight movement
activity in their operations.
- Recommend highway capacity improvements where roadway capacity is being challenged
due to increasing truck volumes.
- Focus truck motor carrier inspection resources by knowing where the truck movement
trends are occurring.
- Adjust pavement life cycle maintenance per trending behavior
- Determine if hydrocarbon emission measuring sites are reporting the same trends in
pollution as the trends in vehicle miles traveled.
- Overlay truck crash heat maps with truck traffic maps to identify the correlation between
truck volumes and crashes involving trucks. This could then lead to targeted enforcement campaigns and prioritized highway safety improvement plans for routes that have
excessive crashes per truck mile rates.
CONSIDERATIONS
- There is error inherent in the mileage assignment system. However, this method leverages the knowledge of where trucks fueled. All travels emanated from these points of origin,
enabling approximations of truck operations and distances.
- Updates to the model could be accomplished by replacing the fuel quantities sub-table of
the GIS database with fresh values reported by each vendor each month.
- Periodic updates to the list of vendors and updates to the ADT values would be necessary
to recalibrate the model.
- The radius of each template is critical to this system, and calculations would have to be
identified. Factors to consider include:
- A typical 18-wheeler has two 100 to 150 gallon tanks, and average about seven miles
per gallon, so the truck has a long travel range between fill-ups. There are a number of
factors influencing when a driver chooses to refuel. For example, drivers have hours
of service limits, and 700 miles (the approximate range for one typical saddle tank) is
roughly the miles they could drive during their allowable hours of service. It seems
reasonable to assume that long-distance drivers would tend to refuel during their rest
break time.
- Local and intrastate trips would be shorter, but would likely occur entirely within a
smaller template area than the long-distance drivers. This would suggest a smaller
radius for the vendor template for these types of vehicles.
- The typical mileage driven between refueling is also critical to the accuracy of the
system. One way to get a realistic mileage per tank would be to conduct a statistical
analysis of the number of gallons per fill-up using a sampling of vendors to get a
realistic typical value for all trucks using these facilities. This could be derived from
their fuel purchase receipts.
- States tax fuel in several ways, including:
- Wholesale level: Where the tanker trucks fill up
- Retail level: Where the trucks refuel
- State fuel sales tax
- Weight-mile tax along with a fuel tax. (Only Oregon has a weight mile tax)
It would be necessary to develop State-specific processes for capturing the monthly
gallons of fuel (or miles driven in some cases) reported by each fueling station.
- Validation of the model can occur using actual carrier data. For fuel tax apportionment purposes, motor carriers are required to keep detailed records for each trip, including fuel
consumption and routes driven through each jurisdiction, as well as fuel purchase receipts. This information is then summarized and used to report to the International Fuel Tax Association (IFTA) where their fuel was consumed.
Summaries are submitted when carriers report their taxes. The IFTA requires that detailed trip records be retained for four-years for auditing purposes. Many of the carriers contract
this tax reporting process out to specialized freight accounting services. It may be possible to contract these accounting services to anonymize clients' trip data of any carrier-specific
information and provide route-specific reports of actual trip mileage.
A sampling process can validate the computer model results. This approach uses reports of actual routes and miles driven per carrier. It can provide more accuracy than calculating
mileage from fuel consumed. However, acquisition of this detailed data from carriers would be difficult. However, a sampling of the accounting services could be used for validation purposes in a few specific sampling areas.
CONCLUSION
There are several benefits to using fuel taxes to track truck movement. This method can help identify freight trends at the local and regional levels beyond the typical commodity flow
analysis. The results can also help identify land use trends. Finally, enforcement agencies could use the data to properly locate inspection facilities and resources and State DOTs would be able
to use this data in determining pavement wear and life cycles.