Freight Performance Measure PrimerCHAPTER 2. PERFORMANCE MEASUREMENTPerformance measurement has evolved over the decades into an effective methodology for quantifying goals and objectives and communicating progress toward their attainment. Many State Departments of Transportation (DOTs) have integrated performance measurement into their business practices. Developing and analyzing freight performance measures can be challenging for many reasons, including the large number of possible measures, the extensive and potentially expensive data that might be required, and the computational complexity that is often introduced (Transportation Research Board [TRB], National Cooperative Highway Research Program [NCHRP] 2011). Transportation agencies tend to place performance measures into one of three categories: agency performance, system performance, and the impact on broader social performance measures. Agency performance focuses on service delivery, such as projects completed. System performance focuses on capacity and conditions of the transportation system as well as issues such as travel times, cost, and safety. Social performance measures deal with broader societal concerns such as economic development and the environment (McMullen et al. 2010). Traditionally, performance measures at the State level focus on evaluating key highway or transit/rail, and port infrastructure performance such as interstates and national highways, Class I railroads, and key ports. Freight performance measures require a multi–modal evaluation of the performance including highway, rail, waterway, air, and intermodal connections. Performance measure data can be used in several ways:
There are many elements that go into the successful development of freight performance measures, including:
Most performance measurement systems are evolutionary and start with the current data available. The systems tend to mature, evolve, and improve over time. Although a universally used comprehensive and consistent set of freight performance measures do not exist, important elements of freight performance are captured in Federal data sources. These data sources are predominantly available for highway and waterway infrastructure conditions, freight volumes, and freight externalities such as air emissions and crashes. Private–sector trade associations often produce robust freight performance metrics that can augment the public agency metrics. There is no single agency or entity that has the mandate or resources to develop and sustain a comprehensive freight performance measurement program. Many individual agencies and private–sector trade organizations measure components of freight system performance, but there is no single agency compiling a comprehensive reporting system. Therefore, the recommended framework outlined later in this primer seeks to capture the existing performance measurement information from both Federal and private sources. FREIGHT PERFORMANCE MEASURESFreight performance measures are tools used to evaluate the level of accountability, efficiency, and effectiveness throughout the various freight modes including air, rail, highway, and water/marine transportation. Performance measures provide a way to focus attention on the goals that an organization has defined while monitoring whether those goals are being attained. Analyses of freight performance measures assist in the prioritization and selection of specific freight improvement projects in long–range transportation plans, transportation improvement programs, and freight–specific investment programs (McMullen et al. 2010). Some jurisdictions measure freight performance by linking funding to the existence of these measures. Other jurisdictions are pro actively tracking freight performance measures because freight is integral to their economy and impacts congestion, air quality, roadway safety, and infrastructure preservation. Thus, freight performance measures grow in importance each year. Some jurisdictions measure freight performance to identify priority levels for funding new projects. With input from the private sector, public sector jurisdictions can determine potential freight bottleneck areas. This partnership can also identify major investments planned by the private sector that might result in increased congestion and costly delays to the freight industry and passenger traffic in the region. Public agencies can also better understand the economic benefit that could occur because of these private sector investments. Measuring freight performance also allows public agencies to establish transparency for public sector funding decisions. Because funding is limited, not all projects can be funded in each fiscal cycle. By collecting and sharing freight performance measures, the public can understand the justification that was used in the funding priority process. Public jurisdictions are also recognizing that freight performance measures can provide an indication of the return on investment for the funding of capital improvement projects. Projects such as adding highway capacity, reconfiguring interchanges, and grade separated railroad crossings, can be costly. Capturing existing and future projected freight data allows public agencies to determine if the project will improve freight flow and, therefore, justifies selection of the performance measures. Alternatively, if the project shows no appreciable positive impact to freight flow, the agency can re–evaluate a performance measure. Surface transportation legislation in the Moving Ahead for Progress in the 21st Century (MAP–21) and the Fixing America's Surface Transportation (FAST) acts calls for freight planning, freight performance measurement, and the development of tools for freight analysis and data collection to justify eligibility for Federal funding. The Federal Highway Administration (FHWA) has developed freight data and analytical tools to support analysis, plans, and project development. However, more needs to be done to improve freight analysis so that it allows States and Metropolitan Planning Organizations (MPOs) to understand the multi–modal nature of freight. States and MPOs can use several existing data sources and approaches to get baseline and performance measures that support freight planning. This document identifies the most common data and analytical methods, which will assist State and MPO practitioners to respond to MAP–21 requirements. A region's ability (or failure) to relieve traffic congestion and provide a reliable freight network can impact whether jobs are created locally or are shifted elsewhere. Congestion increases travel time for freight movement, which in turn means increased costs for delivery of consumer goods. Workplaces and residents that relocate due to congestion within metropolitan areas equates to tens of millions of dollars lost to local economies—jobs, schools, housing, taxes, and decreased standard of living.
Literature searches on the impacts of truck congestion on the economy have yielded few results. Data on commodity flows are limited and the impacts to the economy may vary depending upon the commodities transported and the types of delivery locations (e.g., manufacturing facilities, urban retail, grocery stores, and restaurants). Many transportation professionals do not have the expertise to analyze economic indicators and the impact the market may have on business development or business relocations and failures. At the same time, many economists are not trained in the field of transportation (multi–modal options, fuel cost impacts, deregulation, distribution center strategies, and variable roadway usage taxes). In addition, the freight industry is struggling to develop highly reliable statistical freight models that can determine mode choice, route choice, and optimal time of day for travel and deliveries. Effective freight performance measures can be a valuable tool in determining a correlation between qualities of freight flows and economic impacts. Establishing and using freight performance measures provides many benefits. A jurisdiction cannot improve a system if it does not first collect the data necessary to measure and analyze the system. However, the process for choosing the appropriate freight performance measures can be complex. The performance measure depends greatly upon who is using the measure and what the goals may be. It is also important to distinguish between performance goals, measures, and targets. Performance goals are broad statements that describe a desired result or outcome and set the strategic direction for the performance process. Performance measures are used to convey goals in measurable objectives and assess progress toward meeting goals. Performance targets represent the expected success level within a specified period toward reaching the stated goal. For example, an enforcement agency may have the goal to minimize commercial vehicle crashes. Many crashes are due to driver error while other crashes are due to inadequate braking systems or other equipment failures. A performance measure used to track this goal may be the number of safety inspections of commercial vehicles. The target may be to increase the number of safety inspections of commercial vehicles by a yearly percentage. This is a measurable action to achieve the goal to reduce commercial vehicle crashes. However, performance measures can be in conflict, such as certain highway or enforcement safety measures and travel times measures. For safety purposes, enforcement officers may want to stop as many commercial vehicles as possible to aid in a safe and crash free environment. For economic purposes, however, the goal may be to minimize any freight flow delays into and out of ports which could have a negative impact on safety. Developing a single set of performance measures which will satisfy all agencies and the private sector is not a simple task. What may be beneficial to some stakeholders may be detrimental to others given the disparate sets of objectives from each stakeholder entity. LINKAGE OF PERFORMANCE MEASURES TO ECONOMIC IMPACTSThere is a direct link between performance measurement and the economy, as shown in Table 2. These relationships were studied in the September 2015 FHWA report "Measuring the Impacts of Freight Transportation Improvements on the Economy and Competitiveness". The authors note that while some of the performance measures are closely related to each other, they should be considered separately as many times the performance measure is "in the eye of the beholder". For example, it was noted that average speed and transit time performance measures have similar economic impacts. The difference in these performance measures is in how they are measured and the perspective of the agency using them. The transit time performance measure is more often used by shippers, who focus on how long it takes to move a shipment between two points. The average speed measure is more often used by transportation planners, who are considering how investments in infrastructure can improve the performance of specific segments of the transportation network (ICF & Leidos 2015, p. 12).
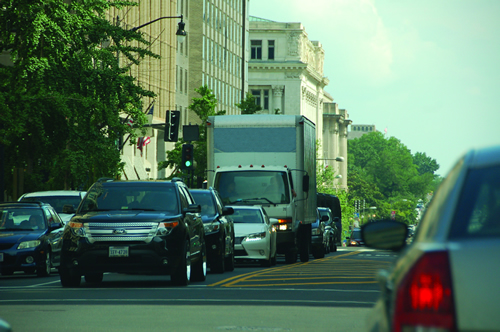
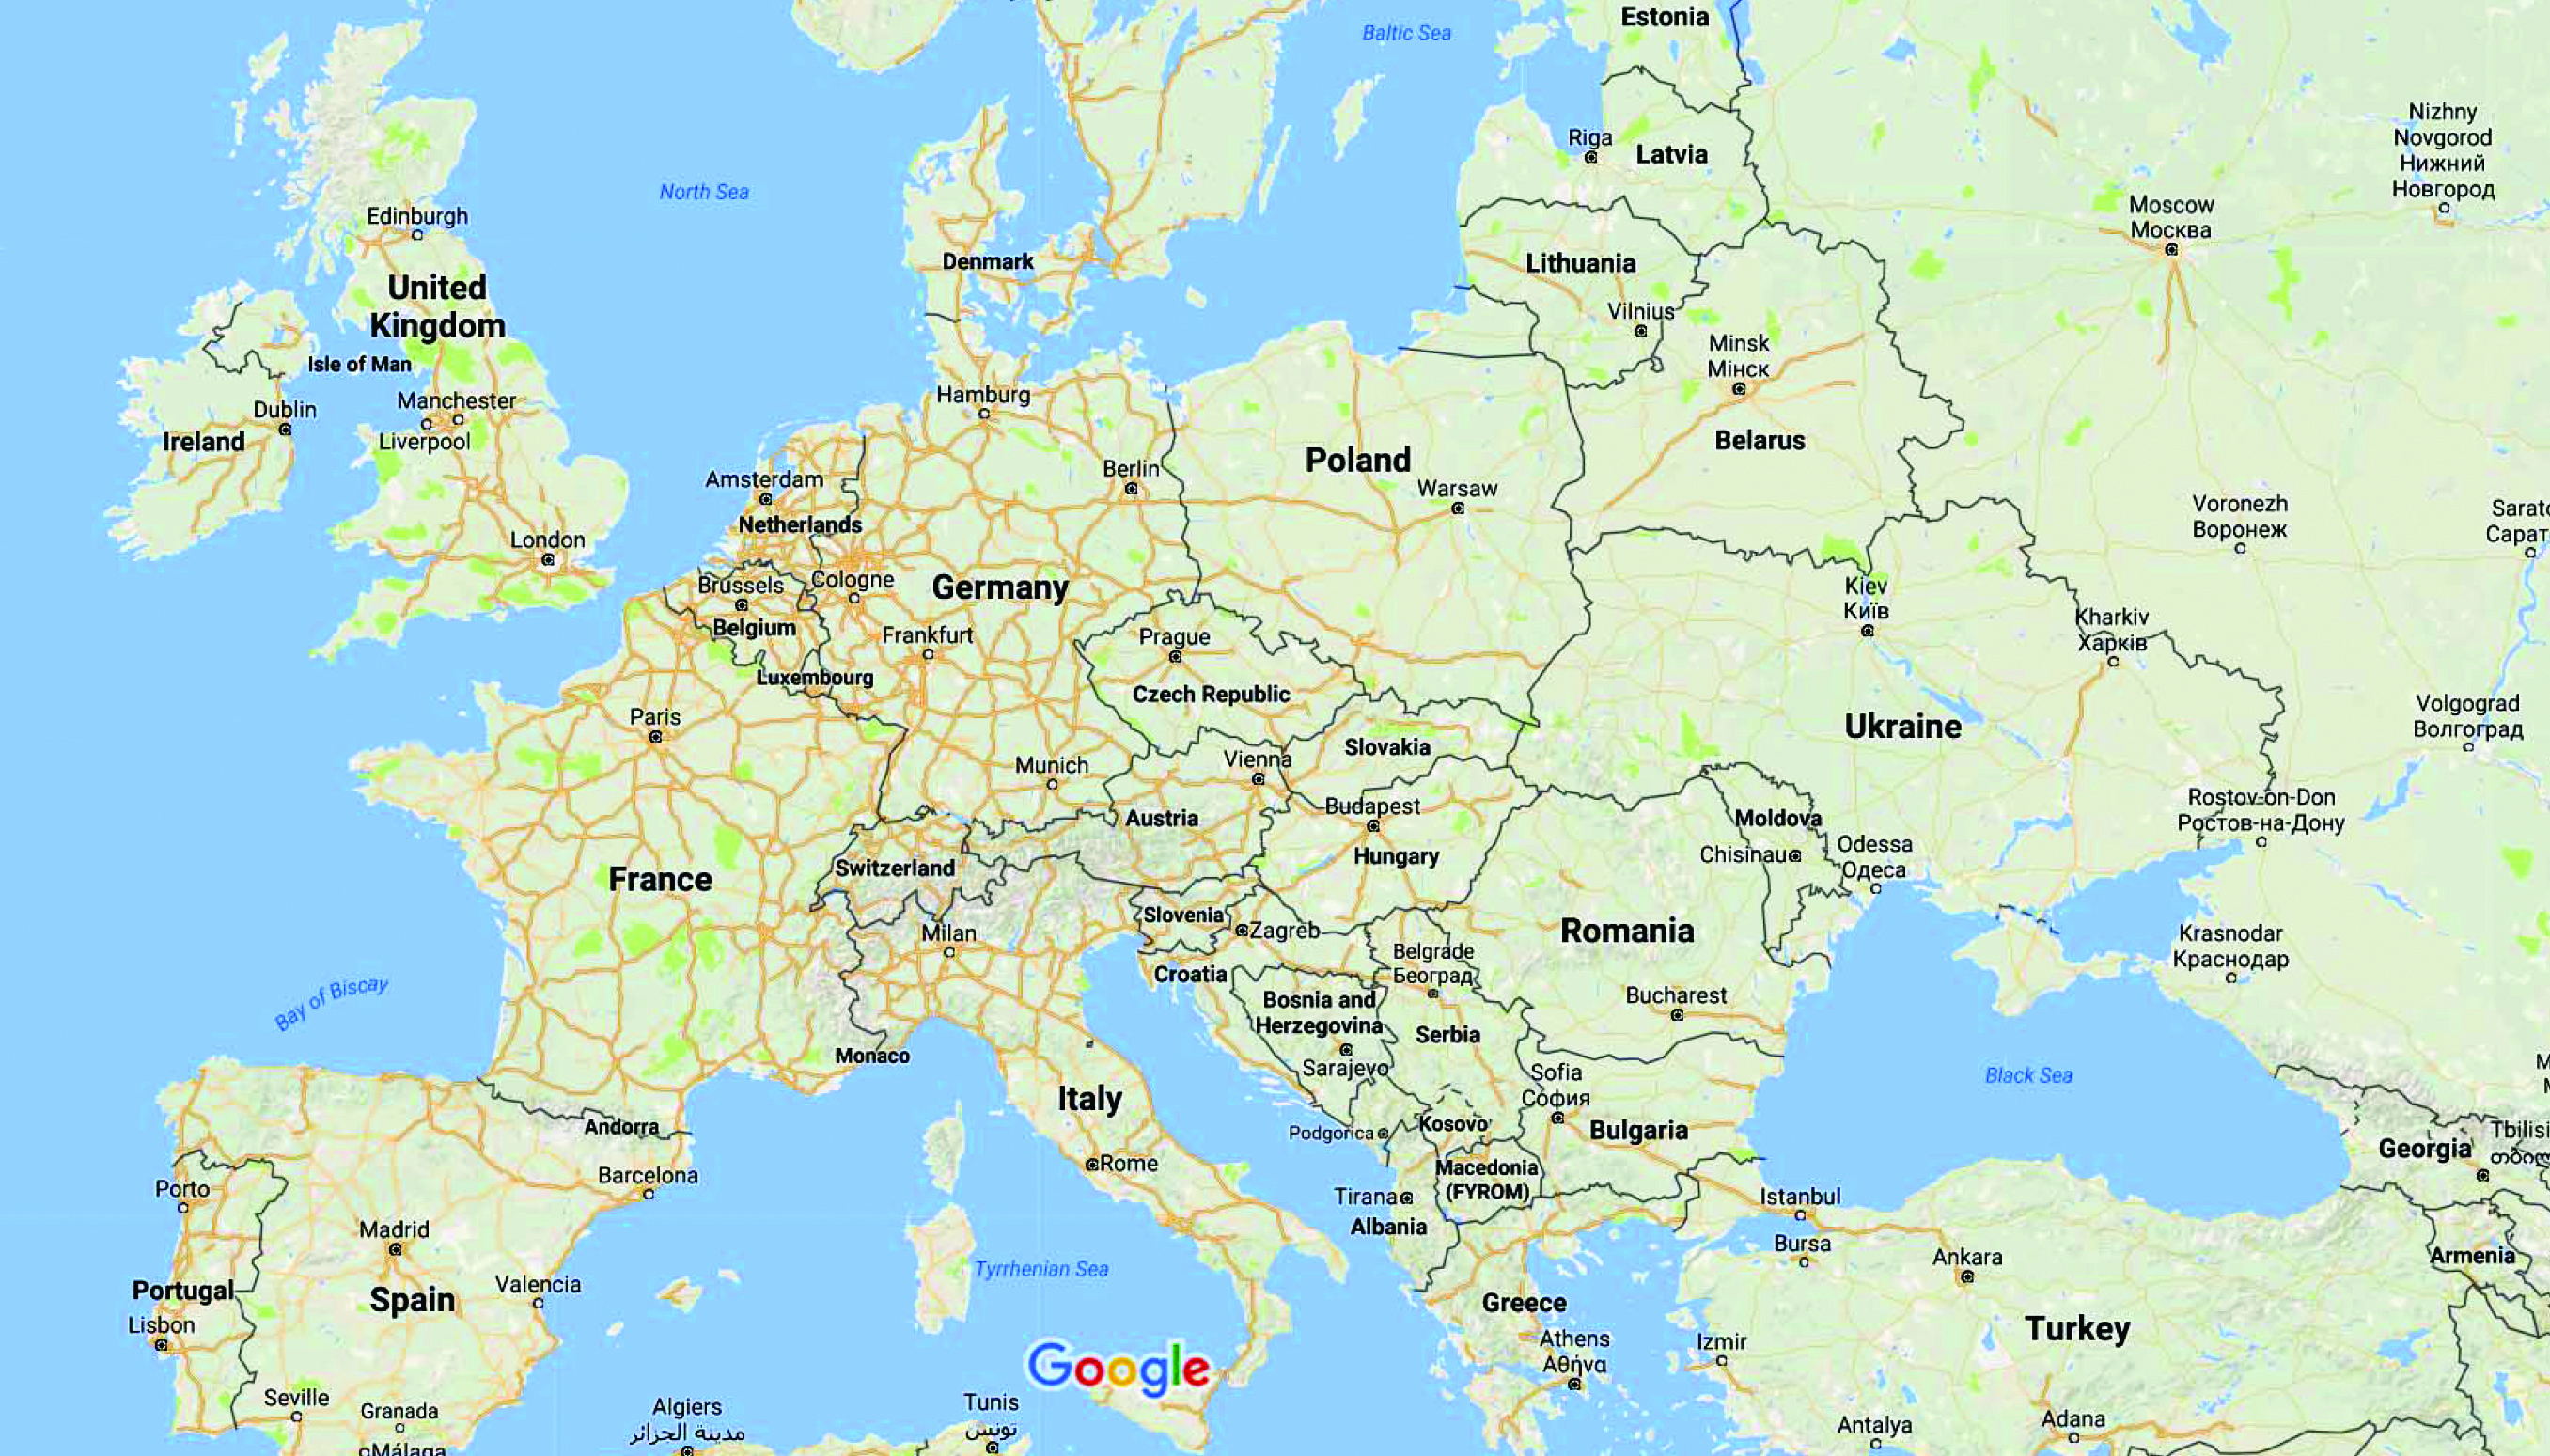
The report identifies another example of related performance measures: reliability and transit time variance. Reliability measures the unexpected congestion or delay on a specific roadway segment measured by the variance in travel speeds. This measure would typically be used by a transportation planner. Transit time variance provides a measure of performance from the perspective of the shipper, measuring the level of unexpected delay for the shipment. Transit time differs from reliability because other factors, unrelated to vehicle speeds, can affect the transit time of a shipment. One example is a driver that exhausts his or her hours of service and must stop before completing the delivery. There would be a delay in the shipment's transit time that was unrelated to the speed at which the vehicle could travel to make the delivery (ICF & Leidos 2015, p. 12). Some economic factors are easier to measure than others. For example, the average speed and transit time performance measures affect vehicle and driver costs for the truck, which in turn affect the cost of delivering freight. Estimating driver labor costs is relatively straightforward, as time savings can be translated into monetary values using estimates of average driver wages and benefits (in those cases where drivers are compensated with an hourly wage rate). In situations where drivers are compensated on a per mile basis, the impacts of reducing transit time may be more difficult to determine. Data are also available for the capital and operating costs associated with the truck. The cost of delay for the freight shipper and receiver is more complex, because it depends largely on the type and value of the freight carried, and how the freight shipment is being used by the customer. The average cost of delay for freight can mask a wide range of costs for different commodities, consuming industries, and customers (ICF & Leidos 2015, p. 13). Estimating how performance measures affect long term productivity improvements in an industry can be more complex. Productivity measurements can include the increase in supply and market areas, level of access to lower cost or higher quality suppliers, improvements to inventory management, and increase in supply chain efficiencies. Productivity improvements can occur when average speed or transit times are reduced. Over the long term, improvements such as these may allow for business reorganization, expansion, and increased economies of scale (ICF & Leidos 2015, p. 13). LEVELS OF ANALYSISAlthough a review of available literature provides many potential freight performance metrics, the small number of States that do have freight performance measures focus only on a few performance metrics. The National Cooperative Freight Research Program (NCFRP) Report 10 reports that "mature performance measurement States" such as Washington, Missouri, and Minnesota use between five and ten measures. It was noticeable that no two States had the same measures, and in most cases, there were wide differences in the metrics. Although States reported freight performance metrics, most of the metrics were not used to calibrate performance of specific State programs except for Missouri's customer satisfaction with its motor carrier office. Generic measures such as travel time in freight–significant corridors were likely a contributing factor to State efforts to improve overall travel times. However, it was unlikely for a State DOT to use freight performance measures to make decisions. Most of the measures appear to be indicators of broad trends of overall transportation system performance (TRB, NCFRP 2011, p. 32). As part of the process to gather information for this primer, interviews were conducted with freight stakeholders from jurisdictions of varying types and sizes. The purpose of the interviews was to get input from practitioners in the field that are working on performance measures for their respective organizations. Interviews were conducted with stakeholders from State DOTs, MPOs, and municipalities, as well as internationally. Stakeholders were asked general questions about their organization's position on freight performance measures to gather a personal perspective on their organization's freight performance measurement usage. The interviewees were told that there were no "right" or "wrong" answers, and that the goal of the interviews was to obtain a ‘real world' understanding of how freight performance measurement is conducted (or not conducted) within their organization. The interviews are summarized below. The list of interview questions and interviewees can be found in Appendix B. NationalThose interviewed indicated that agreeing to valid national–level freight performance measures has been challenging. One challenge is the lack of agreed upon definitions. This not only varies from State to State, but also from partners within a State (or corridor, mega region or municipality). The development of a "freight report card" from which jurisdictions can measure their respective freight performance measures against their peers has been reported to be flawed due to differences in jurisdictions, and therefore not suited to comparison. Figure 1 provides an example of performance report card used by the Florida Department of Transportation (FDOT). Unfortunately, there is no agreed–upon set of measures and definitions that all States use. Thus, the metrics cannot be easily compared from jurisdiction to jurisdiction. The data sources used also vary from one jurisdiction to another, as well as the resources available to obtain the data. In the event that two jurisdictions are in complete agreement on a common definition of a freight measure, the respective data collection methods and frequencies may be vastly different, which would yield differing trending results. In addition, some data sources used for freight performance measures may be adjusted (outliers and gaps accounted for) while other data sources are not. Figure 1. Chart. Florida Department of Transportation performance measures graphic.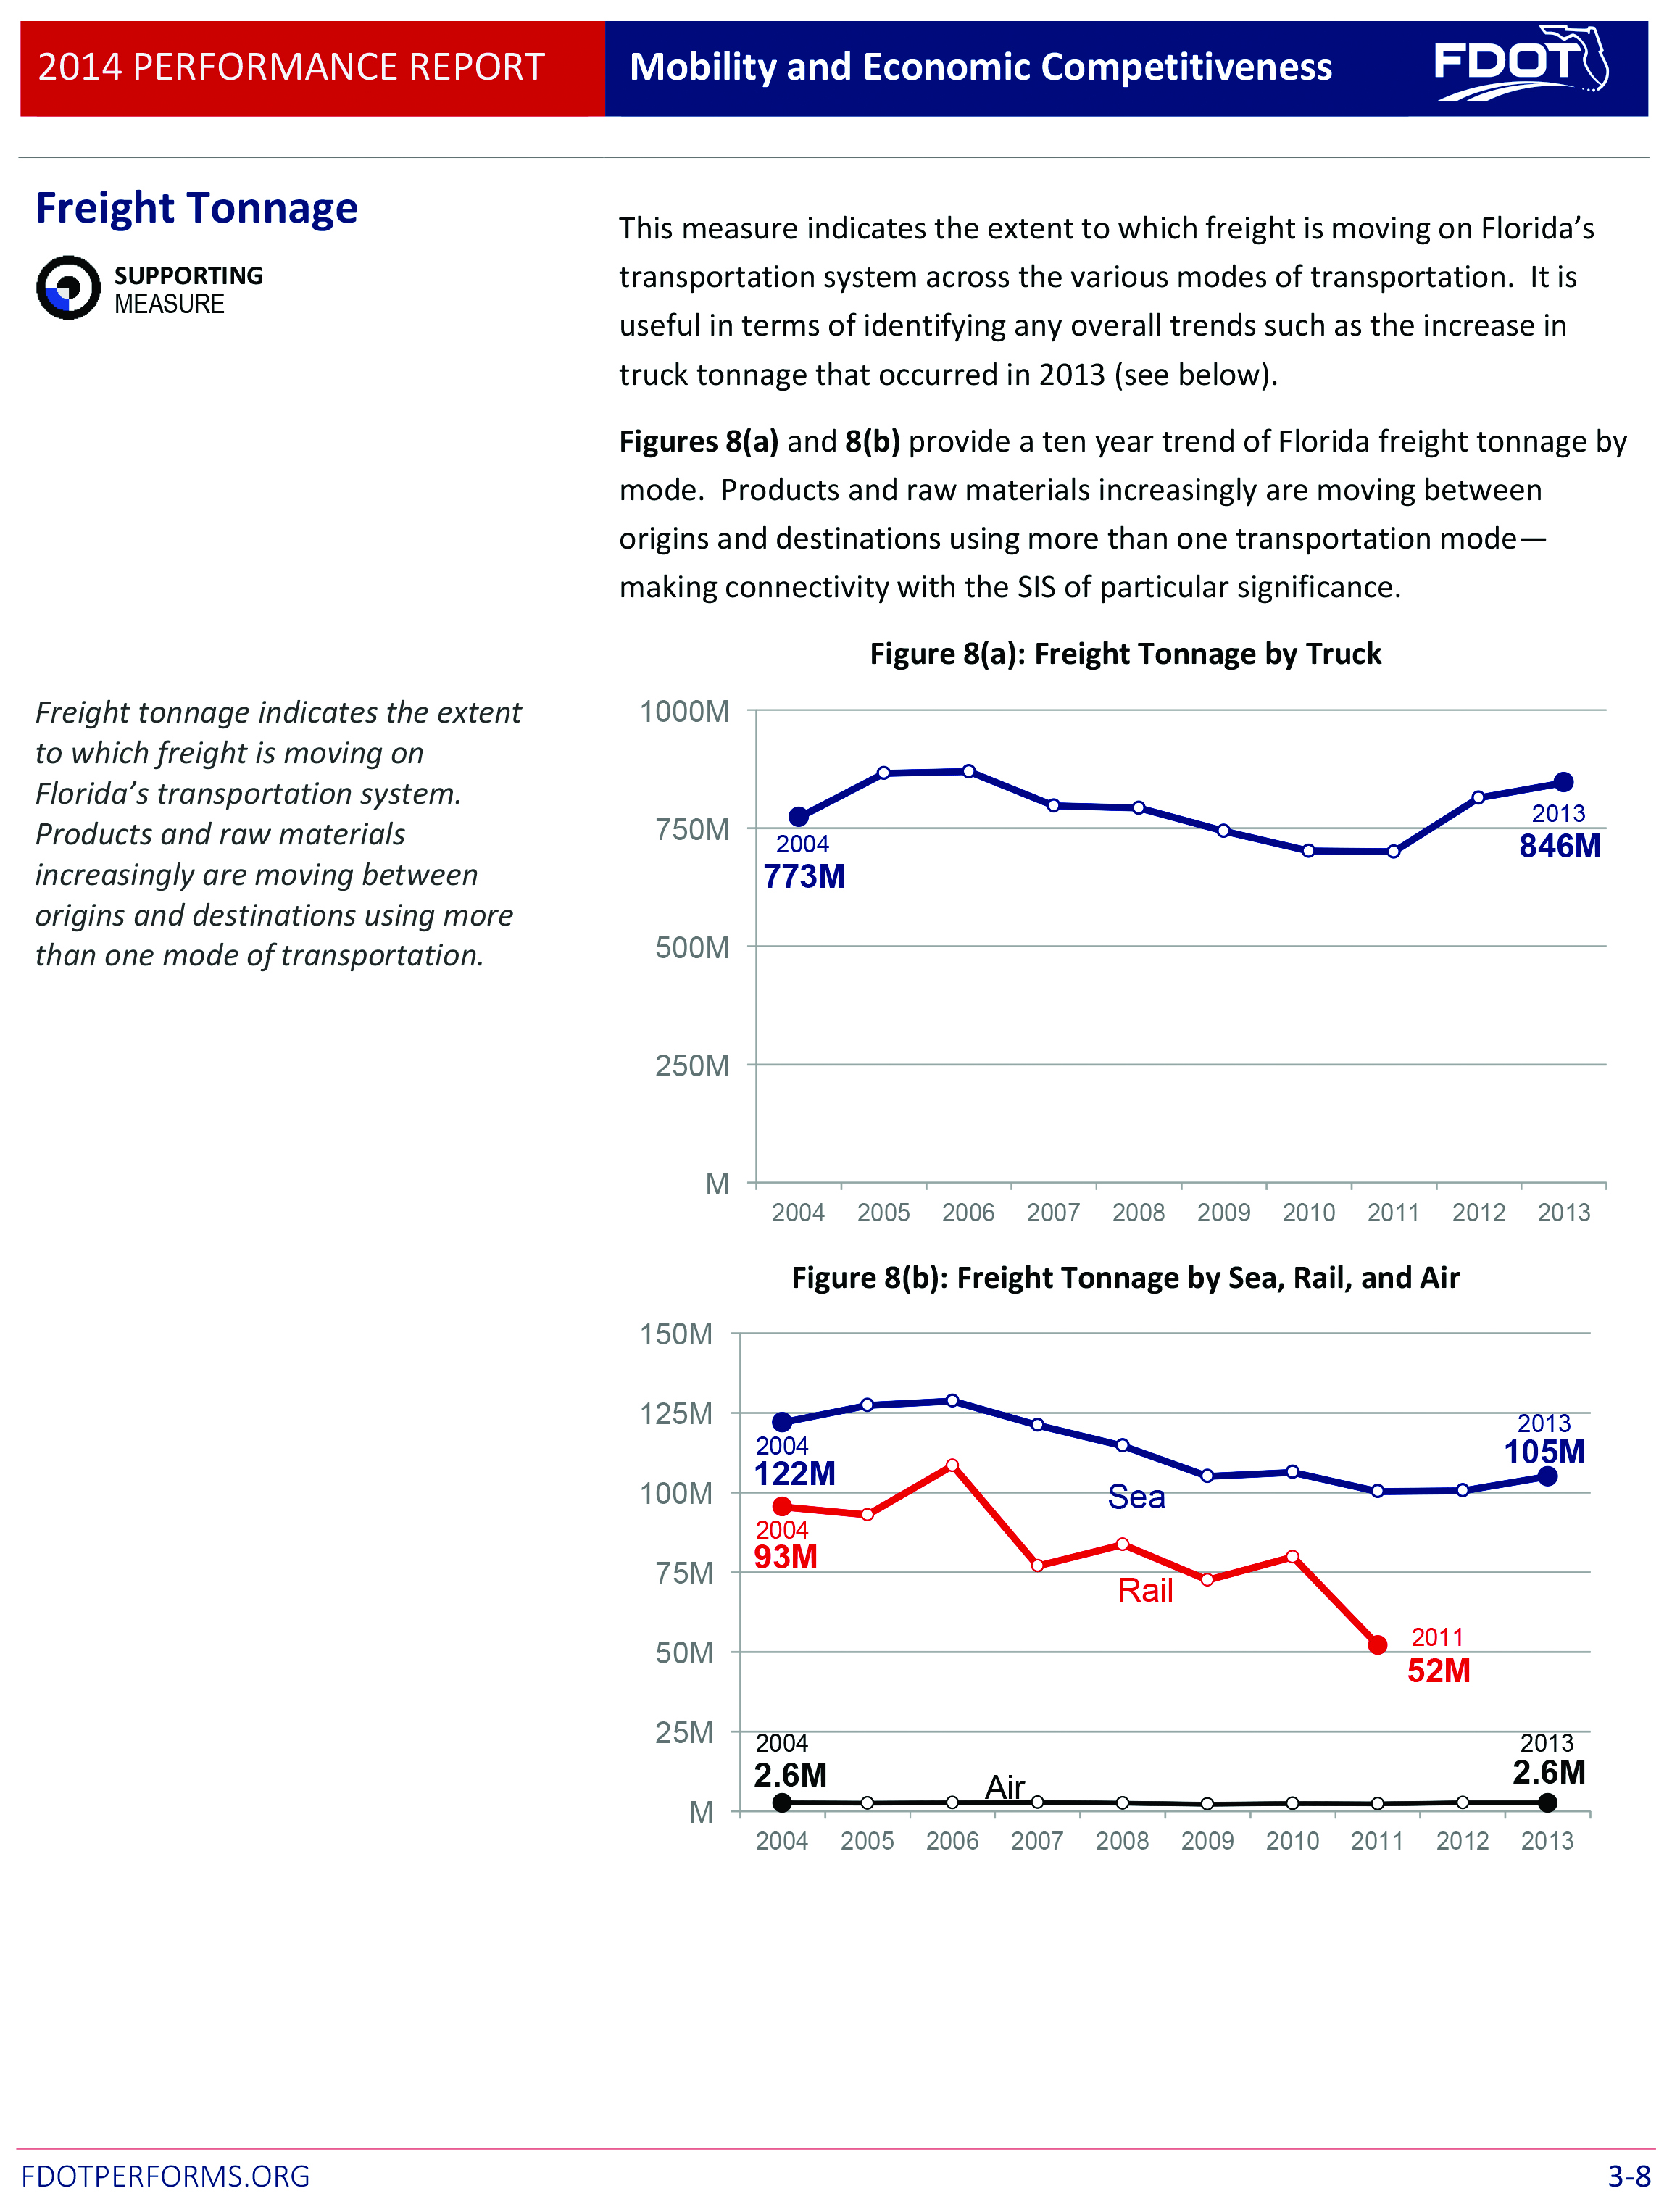 Source: Florida Department of Transportation. From a national perspective, it is difficult to obtain a consensus on many performance measures definitions. Travel time reliability, safety, and congestion are just three examples of performance measures that have different meanings to different freight stakeholders. In addition to unclear definitions, many entities have different organizational goals. Differing goals result in differing measures. While various studies have been conducted, including those through NCHRP, there is still work to be done on the issue of freight performance measure establishment, uniformity, and universal understanding and acceptability. The FHWA Rulemaking process will ultimately clarify specific performance measures that States and MPOs will be required to adhere to. StatesAll States interviewed indicated that their organizations collected some form of freight performance measures, but no two States collected the same measures. The State freight performance measures varied greatly and included various combinations of the following: truck travel times, truck operating costs, truck emissions, transportation network reliability, on time travel performance along freight corridors, maintenance of waterway depths for marine freight, safety, infrastructure (conditions of highways and bridges), congestion, mobility, economic development, environmental, preservation, and percentage of roadway miles of roadway that are upgraded on critical rural freight corridors. Some States are not measuring freight–specific performance, but are instead applying aggregate measures to freight (extracting data on fatalities that involve trucks or linking travel speeds and using this for freight travel, for example). Several States reported that their data are not fully processed or analyzed. While States often used free data provided by FHWA, all data sources are not free, and the data often has gaps and outliers that must be accounted for before an analysis can be conducted. Some States lack the tools to analyze their own data and they use contractors to analyze raw data, which can limit the ability to experiment with various analytical scenarios. If freight office staff is not able to manipulate the data, they must rely on outside sources to perform the analytical manipulations. Most State DOTs reported having multiple staff members who are exclusively or partially dedicated to freight–related initiatives. This is a departure from the limited staff resources that are available to local and regional agencies. Freight performance measure data are frequently collected at the State level, but are usually evaluated annually. States routinely collect data in support of various programs such as the Highway Performance Monitoring System (HPMS), which includes data on the extent, condition, performance, use, and operating characteristics of the Nation's highways. FHWA provides freight data through the Freight Analysis Framework (FAF). However, this data poses a challenge for States that need specific corridor–related data or even targeted regional freight data. The required granularity of data is not available from Federal sources. Some States are using truck probe data which can be helpful, but this type of data is reported to be poor in certain areas due to gaps in data and outliers in the evening and early morning hours. Depending on the State, there is a large variation in modal freight performance data capture. Some States only evaluate truck data, while others may analyze truck, waterway, and rail data. Some even include air freight in their evaluation. Performance analysis for rail or pipeline is limited because private sector data are difficult to acquire due to the proprietary nature of the information, and some States believe they have little impact on private sector investments and operational parameters. All States indicated that the requirements of the FAST Act will influence their freight performance measure data collection processes, and agreed that the uniformity in requirements should help as the U.S. Department of Transportation (USDOT) develop State freight "report cards." Some States noted that it is difficult to develop meaningful comparative assessments since not all States are collecting the same performance measures, or using the same data sources. Some States have the funds to purchase additional data, while others use free sources of data, or data obtained from other departments or agencies, to analyze and produce performance measures within their limited budget. Additionally, the scales of infrastructure can vary greatly from State to State. One State may not have to perform much maintenance on newer infrastructure and can plan (and devote resources to) other projects to enhance freight traffic. Other States must plan projects to maintain current infrastructure while keeping the flow of traffic running as smoothly as possible on already crowded highways and roads. Both the FAST Act and MAP–21 recommend the establishment of Freight Advisory Committees (FACs), so most States or regions report forming a FAC that holds either regular meetings or ad hoc meetings/consultations. These committees provide valuable stakeholder input to State planners. Figure 2. Photo. Truck delivery on streetcar tracks, Washington, D.C.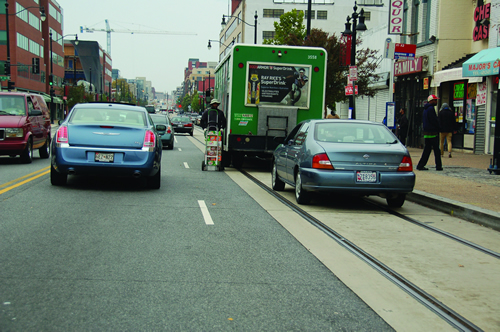 Source: E–Squared Engineering. Figures 2 and Figure 3 portray the urban environment in Washington D.C. in which freight movement and delivery take place. The figures demonstrate some of the difficulties encountered during urban deliveries and the need to develop meaningful and useful data to combat these delivery concerns. RegionsNational or State–based freight performance data can be difficult to accurately disaggregate down to local or regional levels. Many cities and smaller regional planning organizations do not have dedicated staff for collecting and analyzing freight performance measures data. Figure 4 shows the major U.S. freight corridors where there is extensive data available. Some agencies collect freight performance data while others evaluate existing traffic data and make assumptions on freight challenges. Others utilize freight advisory councils to help identify bottlenecks and determine freight related project priorities. Many of the performance measures collected are not specific to freight. Those region/city entities that produce freight performance reports do so on a variable basis. Some produce freight performance information as infrequently as every 10 years, while others may evaluate performance on an annual basis primarily using non–freight related data collection results for freight applications. Figure 4. Map. U.S. Department of Transportation major freight corridors.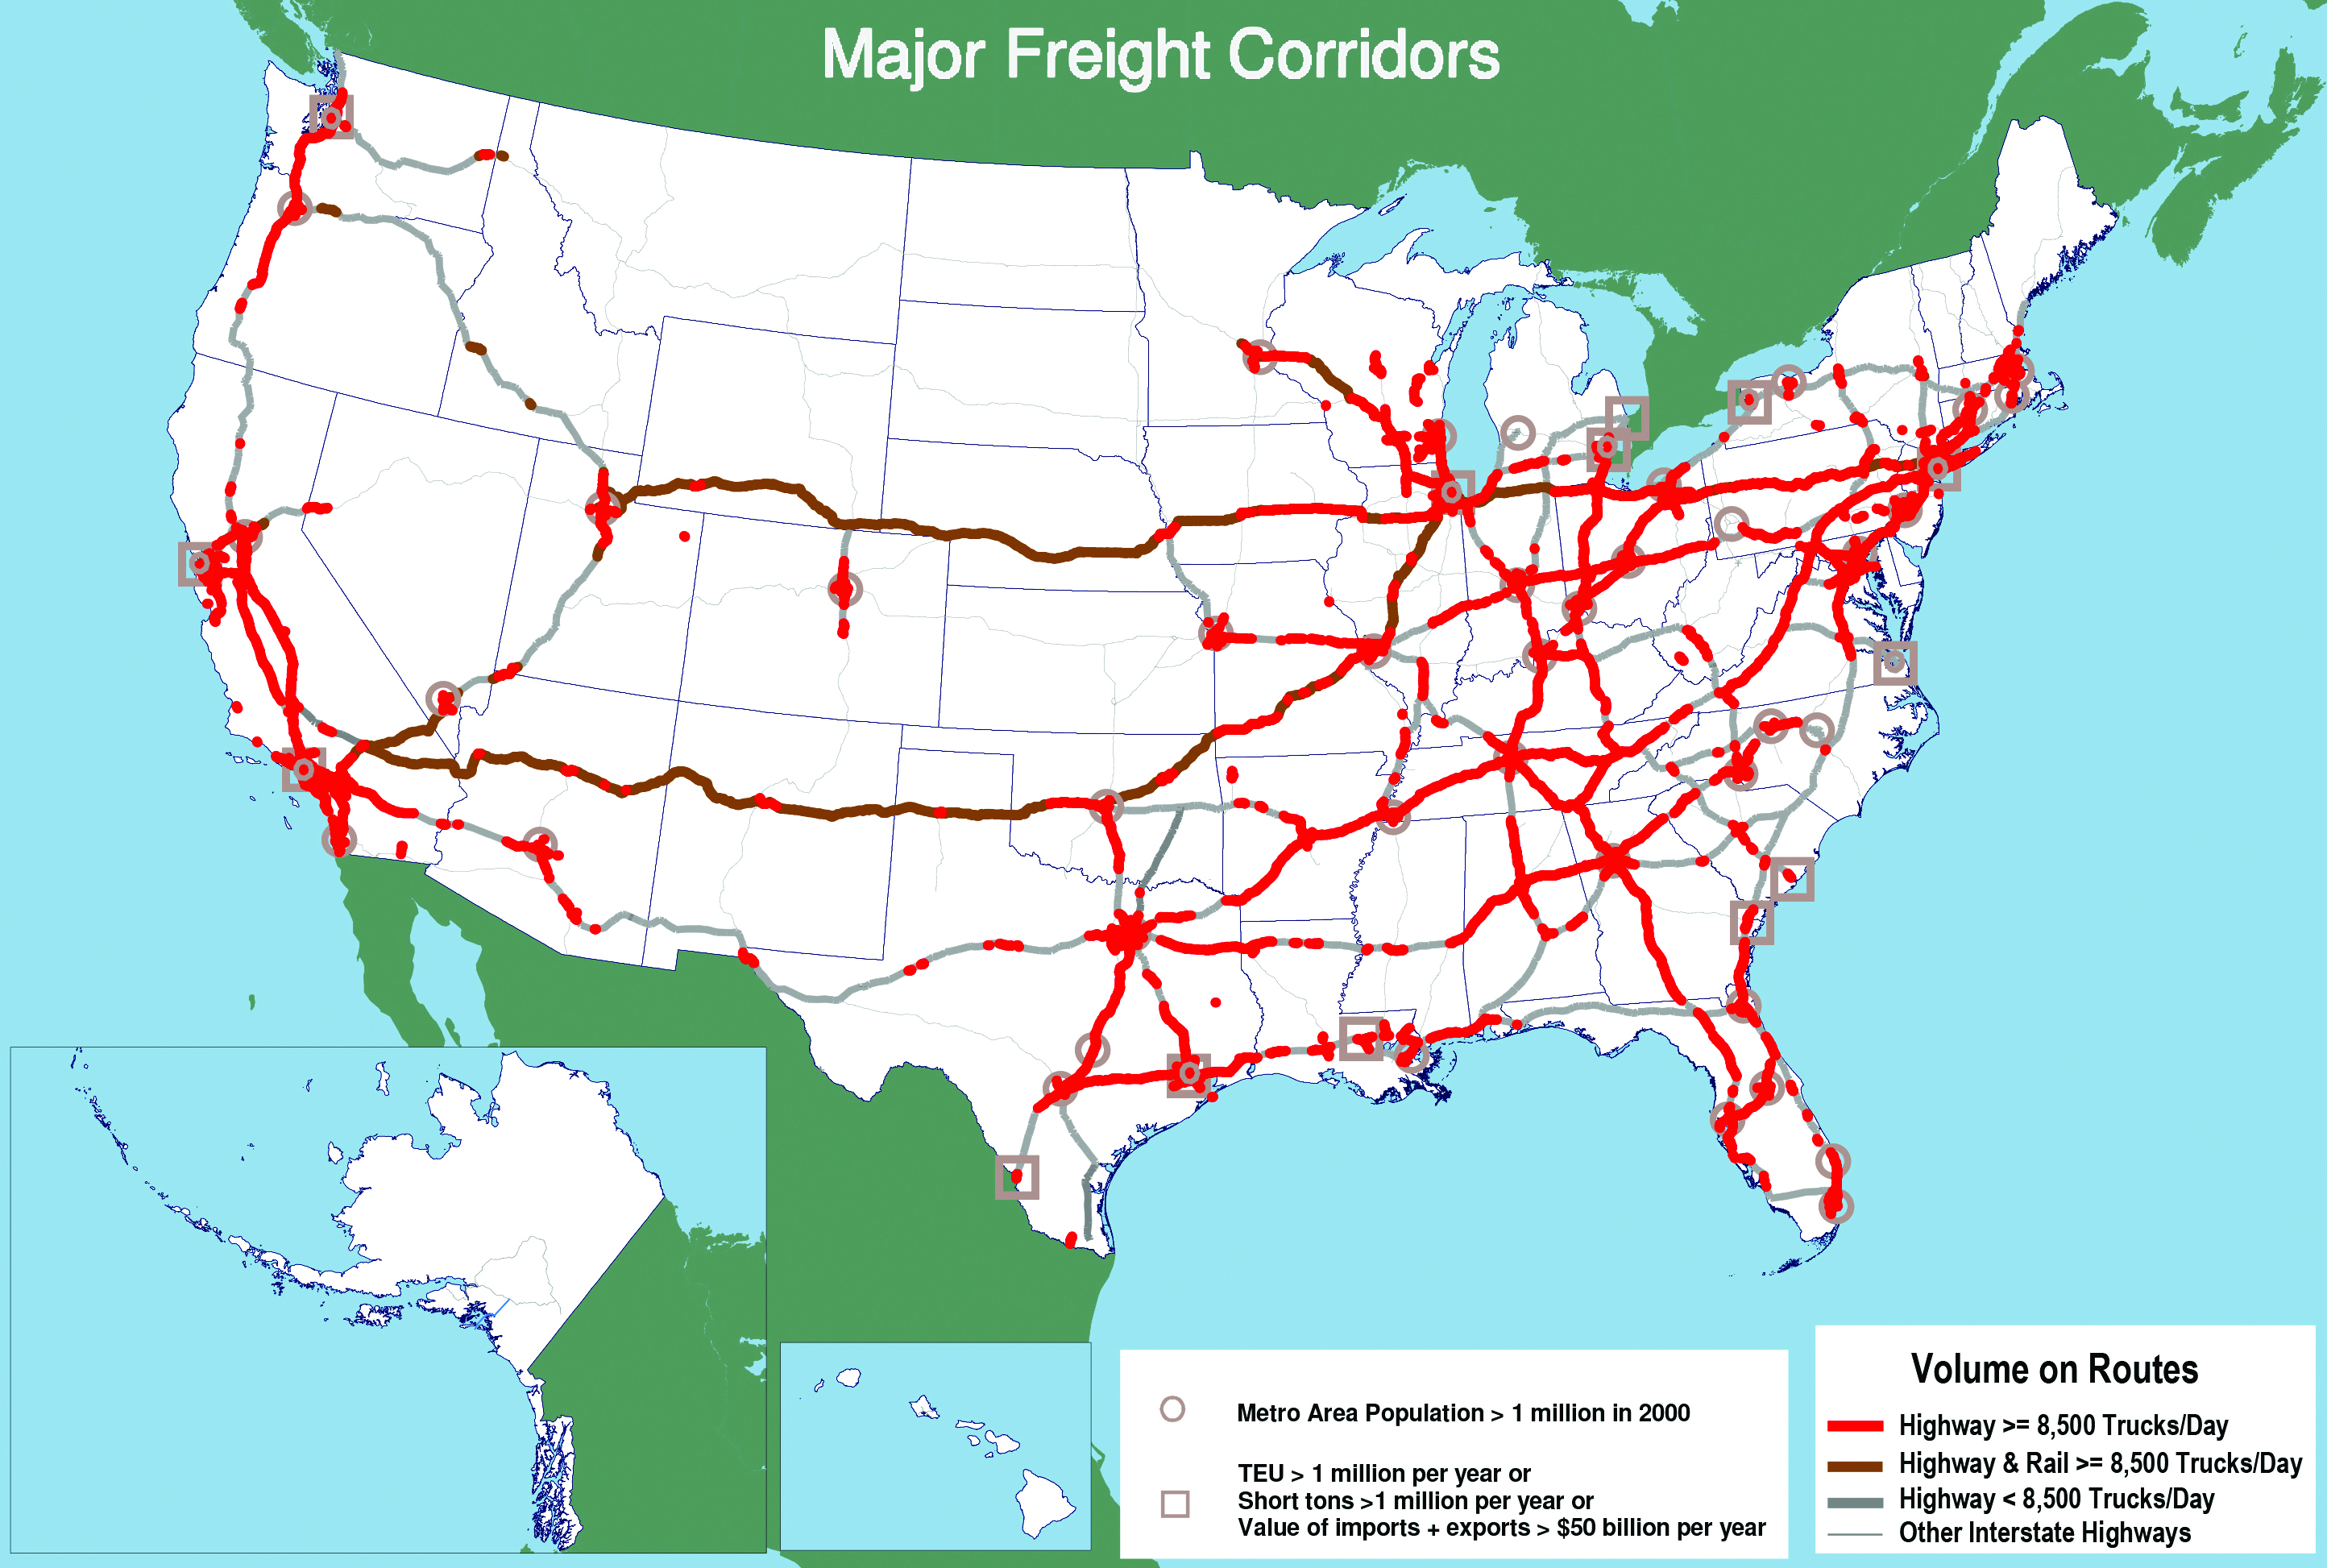 Source: Federal Highway Administration. Mega Regions and Freight CorridorsMega regions and freight corridors are large networks of metropolitan regions connected by economic, social, environmental, and transportation systems where freight activity is intense. Examples of mega regions would include the Great Lakes mega region, the Northern California mega region, and the Texas Triangle mega region. Freight corridors would include the I–95 Corridor, the I–10 Corridor, the I–5 Corridor, the I–81 Corridor, and the I–35 Corridor. In the case of mega regions and high–traffic freight corridors, multiple jurisdictions oversee the performance of the network. Figure 5. Photo. Congestion due to construction on I–81, Pennsylvania.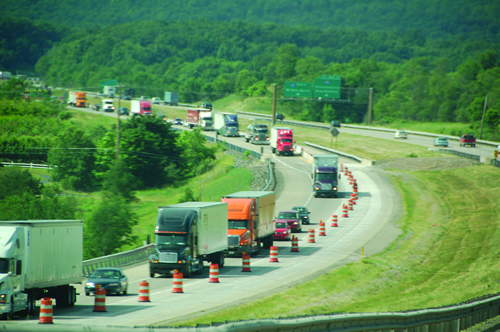 Source: E–Squared Engineering. Figure 5 shows congestion on I–81 in Pennsylvania due to the construction activities. Depending on the specific organization (DOTs, Freight Coalitions, or MPOs), tracking freight performance measures could be as complex as collecting data using shared funds and internal resources, or it could be a single jurisdiction's responsibility, or a combination of those two scenarios. Freight Coalitions often use their resources to develop tools that can support the member organizations as they collect data for their respective jurisdictions within the corridor or region. Freight performance measures examined by corridor coalitions include safety, environmental impacts, congestion, economic development, travel time reliability, incidents (such as truck crashes), and duration and impact of events (how much time to clear a non–recurring event and the impacts on freight flows). Some respondents noted there could be a completely different set of freight performance measures that could be used for long haul trucking compared to those that would be used for urban freight delivery. As is the case with other segments (State, region, MPO, city, and county), there is no uniformity in data collection methods, data sources, or definitions of the various performance measures. Depending on the organization, the analysis of the freight performance measurement can be used for the following purposes: producing reports for informing member jurisdictions, educating the public, developing aggregate reporting tools for freight stakeholders in the region, or prioritizing funding for deploying strategic plan projects. Some organizations do not create any reporting tools; instead they serve as a collection and dissemination point for their members' data collection efforts. The Philly Freight Finder is an example of a resource used to explore and track the Philadelphia–Camden–Trenton region freight network. Figure 6 provides a screenshot of the Philly Freight Finder online tool that contains an assortment of information, including truck travel time index information. The frequency of performance data collection depends largely upon the source of the data. In some cases, the data are collected annually by public agencies (such as State DOTs and city or county agencies) for reports, such as traffic counts and classifications. In other cases, the data may be collected for periods of time every three to ten years (or more). These data collection intervals are often irregular because freight data collection is added to an existing project. Figure 6. Map. Philly Freight Finder screenshot showing travel time index and average speeds for selected time period.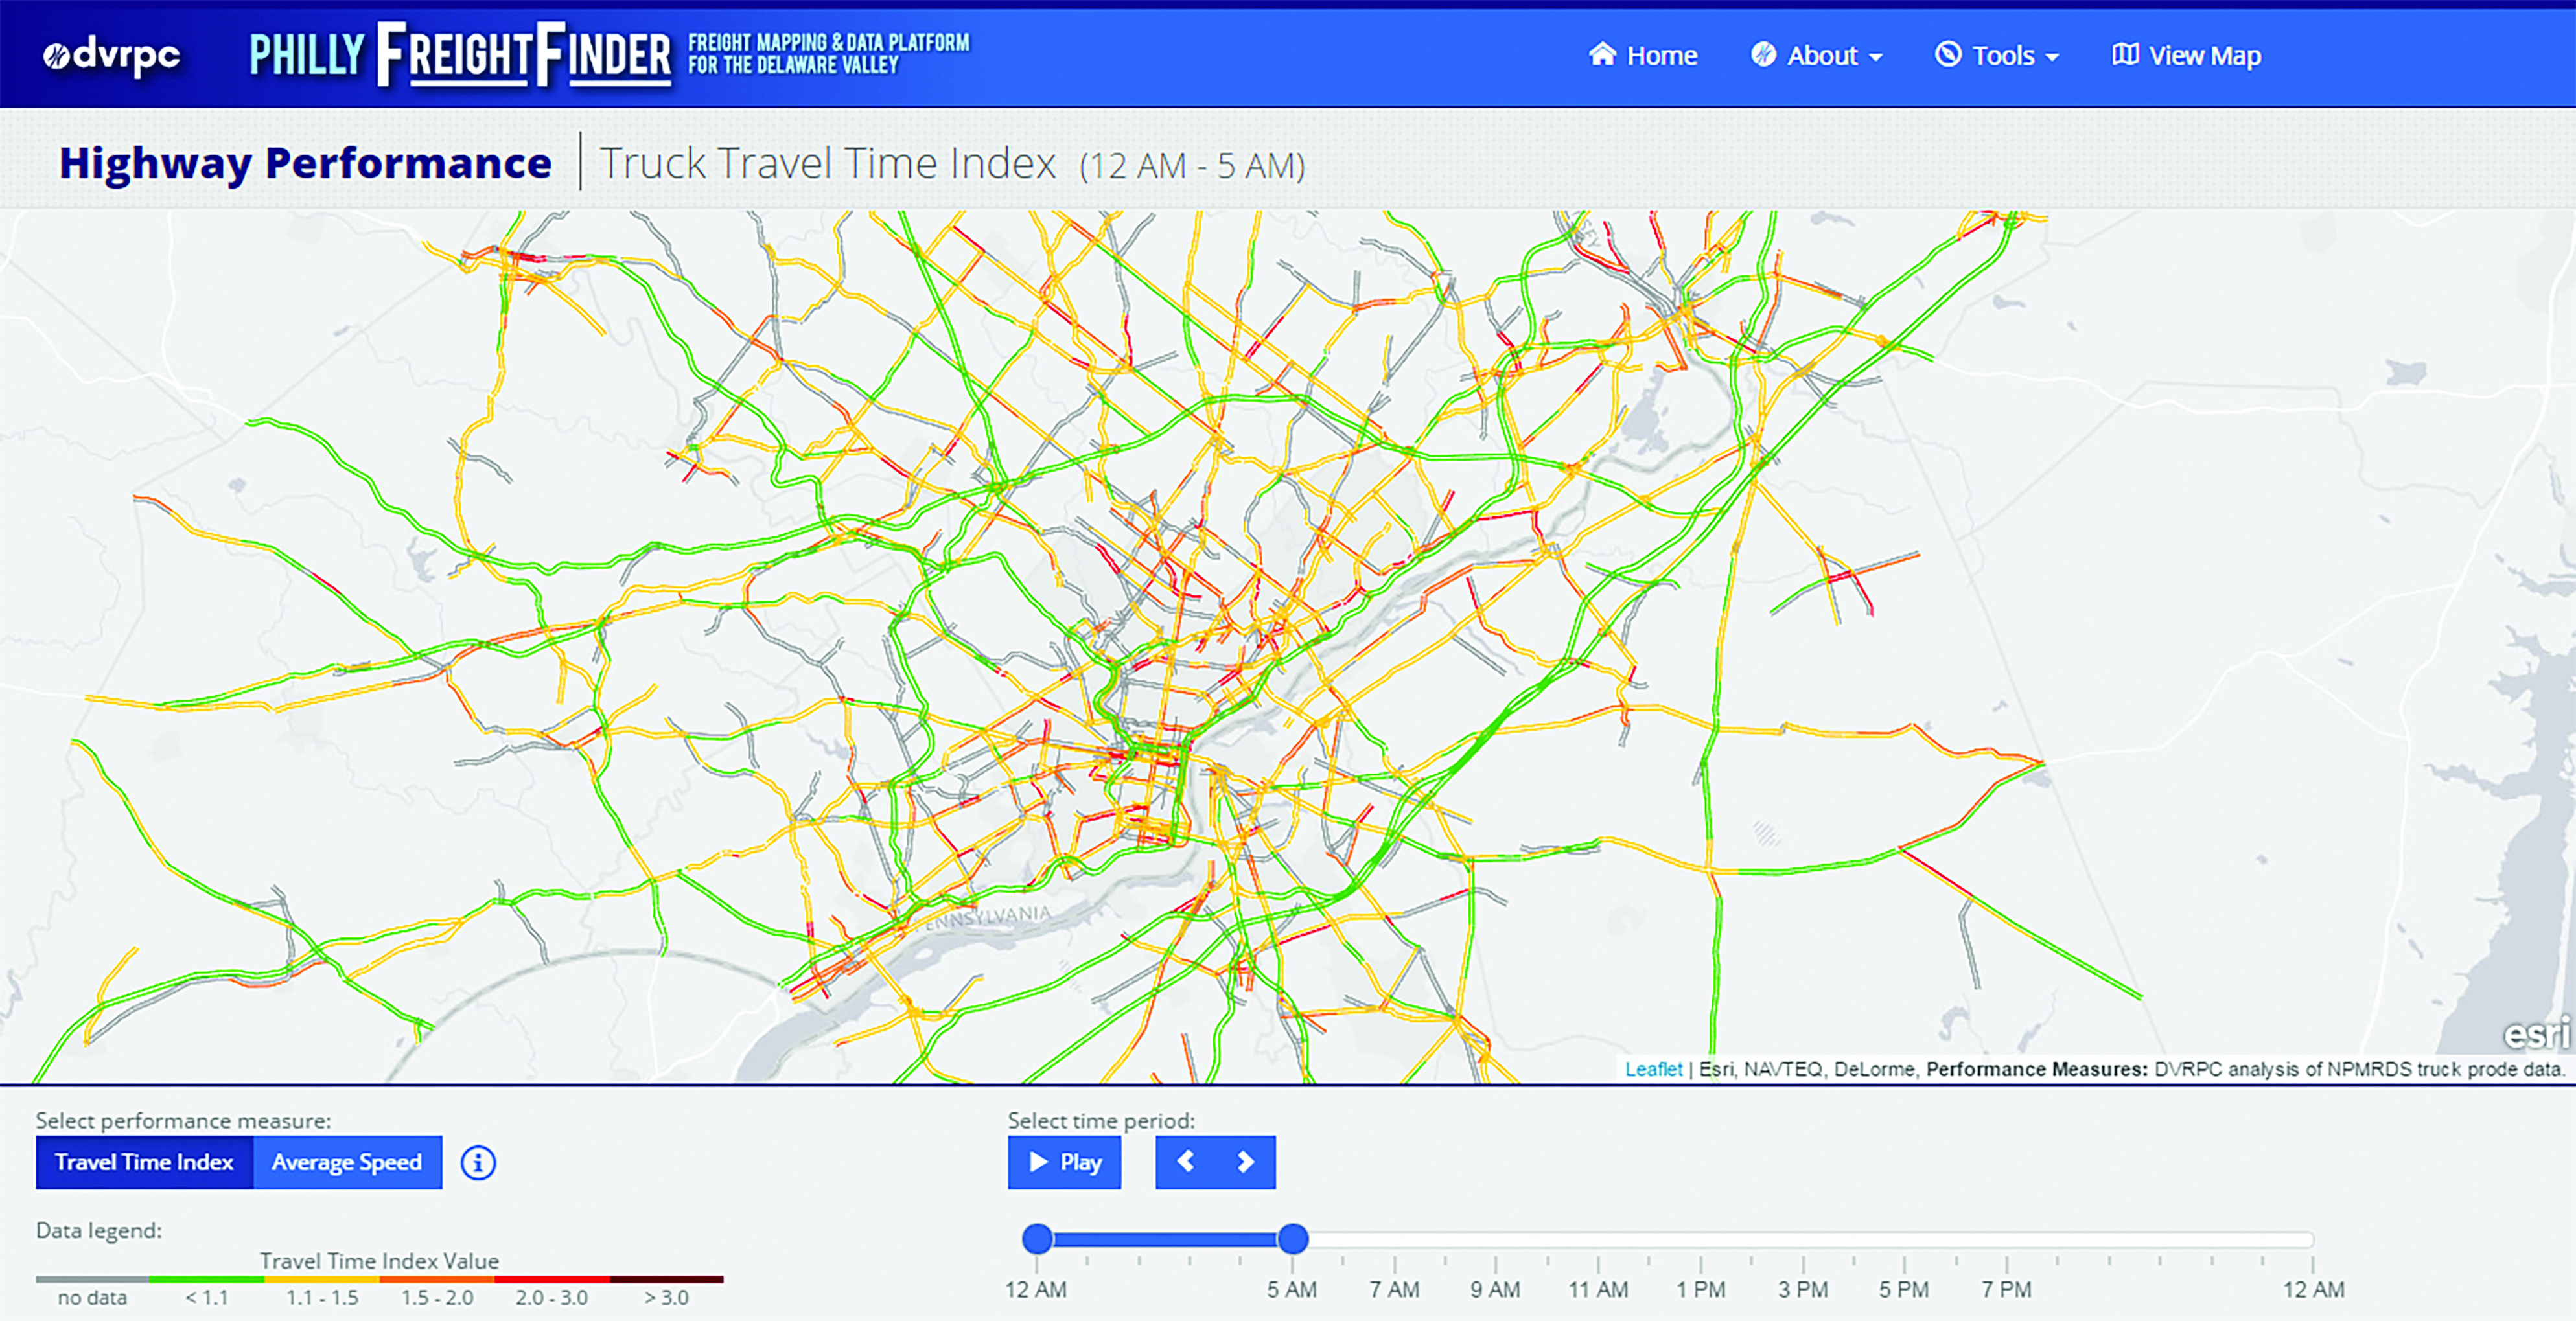 Source: Delaware Valley Regional Planning Commission. InternationalResults of discussions with international representatives were consistent with those within the United States. The freight performance measures examined internationally include waiting times, loading times, shipment times, emissions, utilization rates (efficiency of trucks measured in weight), and congestion. The truck efficiency performance measures and emissions are collected and reported annually. The data is collected by public agencies, navigation system providers, and motor carriers themselves. Figure 7 shows major roadways of Europe. Most of the freight performance measures collected are for roadways. There is little demand for collecting performance measures on other modes even though there is consensus among some freight industry stakeholders that there is a strong need. There is less interest in other modes because of minimal government investment in non–roadway modes. Border crossing data is abundantly available, primarily for trucks. There is limited data availability for rail and water freight transportation. 1 Greater production does not automatically translate into greater productivity, but that economies of scale may become possible and attainable. Economies of scale can occur as the cost per unit of output decreases with increasing scale. This happens when fixed costs are spread out over more units of output. Economies of scale do have many limits, including exhausting nearby supplies of raw materials or saturating local consumption markets, requiring finished goods to be shipped further to generate new sales. Transportation costs thus play an important role in allowing scale economies. [Return to Note 1] 2 Improving vehicle speeds could improve access to the freight network by reducing the time and cost required to access an intermodal rail facility, making intermodal shipments more economically viable. [Return to Note 2] | ||||||||||||||||||
|
United States Department of Transportation - Federal Highway Administration |
||