Active Transportation and Demand Management (ATDM) Analytical Methods for Urban Streets
CHAPTER 5. RESEARCH METHODOLOGY
As the research team began to work on Task 6 – Original Research in March 2016, the project scope had already been narrowed to three specific active transportation demand management (ATDM) strategies: adaptive signal control, reversible center lanes, and dynamic lane grouping. These fall into the category of active traffic management (ATM) strategies, which aim to move traffic more efficiently but without demand management. The key objective of Task 6 – Original Research was to conduct simulation-based studies of all three relevant ATM strategies, to determine their impacts under a wide variety of real-world conditions. Ideally it would then be possible to apply this data towards developing Highway Capacity Manual (HCM)-compatible analytical models, for predicting ATM strategy impacts under a wide variety of conditions.
A preliminary step in the simulation-based studies was to define a set of key experimental parameters, to be customized for each individual ATM strategy. Proper choice of experimental parameters would facilitate development of robust and reliable models. Improper choice of experimental parameters would interfere with the team's ability to meet project objectives. Therefore throughout the month of March, the team held discussions about what might be the optimal choice of experimental parameters. The experimental parameters fell into three categories: input parameters, output parameters, and experimental scope.
INPUT PARAMETERS
With regard to the input parameters, it was important to identify those that would have maximum impacts on ATM strategy benefits. For example, it is generally known that adaptive signals produce minimal benefits when traffic congestion is either too heavy or too light. Instead, adaptive signals produce maximum benefits under "medium" levels of congestion. Although many literature sources would likely concur, the Virginia Department of Transportation (VDOT) study (Fontaine, Ma, & Hu, 2015) cited in Chapter 1 is one source that mentions this concept. Because adaptive signal benefits are closely associated with traffic congestion levels, it stands to reason that "Degree of Saturation" (also known as volume-to-capacity ratio), which could be varied by adjusting traffic volume demands, would be a key input parameter in these experiments. In fact, Degree of Saturation was considered by the team to be a key input parameter for all three ATM strategy experiments. However, it would be important to further differentiate between Degree of Saturation on the major street, on the minor street, and on specific turn movements.
Table 3 presents the list of chosen experimental input parameters at the end of the Task 6 planning phase (end of March 2016). For adaptive signals and reversible lanes, benefits were expected to depend heavily on the level of major- and minor-street congestion. For dynamic lane grouping, benefits were expected to depend heavily on through and adjacent turn movement congestion. Most adaptive signal input parameters were consistent with those recommended by the VDOT study. Reversible lane input parameters were consistent with the macroscopic, corridor-wide benefits of changing the number of through lanes on the major street. Dynamic lane grouping input parameters were consistent with detailed elements of signal operations. The team used judgment in deciding that Driver Compliance would not be a significant factor in predicting dynamic or reversible lane benefits, based on past observations of full reversible lane utilization in Chicago and Washington, DC.
Table 3. Experimental input parameters.
 |
Adaptive Signals |
Reversible Lanes |
Dynamic Grouping |
| Deg. of saturation (major street) |
✓ |
✓ |
|
| Deg. of saturation (major street) |
✓ |
✓ |
|
| Deg. of saturation (turn mvt.) |
|
|
✓ |
| Arterial progression quality |
✓ |
✓ |
✓ |
| Percentage of heavy vehicles |
✓ |
|
|
| Signal spacing |
✓ |
✓ |
|
| Number of lanes (major street) |
|
✓ |
✓ |
| Length of corridor |
✓ |
✓ |
|
| Demand variability |
✓ |
|
|
| Driver compliance |
|
|
|
| Green ratio (major street) |
|
|
✓ |
| Left-turn protection |
|
|
✓ |
| Shared turn lanes |
|
|
✓ |
OUTPUT PARAMETERS
With regard to the output parameters, it was important to identify those that would best reflect ATM strategy benefits. A comprehensive set of such output measures was provided earlier in Chapter 3, based on the findings from Task 5 – Performance Measurement. For example, it is generally known that adaptive signals produce maximum benefits when progression quality is mediocre, but has the potential to improve significantly with better signal timings. Although many literature sources would likely concur, the VDOT study (Fontaine, Ma, & Hu, 2015) cited in Chapter 1 is a source that mentions this. Because adaptive signal benefits are correlated with platoon progression, performance measures related to travel time would be key output parameters in these experiments. Travel time measures would also be an excellent indicator of reversible center lane benefits. By contrast, it was believed that dynamic lane grouping benefits would be more easily observed at the intersection level.
Towards the end of the Task 6 planning phase (end of March 2016), a new decision was made. It was decided that capacity adjustment models should be developed for each ATM strategy. This would be consistent with some of the assumptions made during the freeway ATDM project, and with many of the capacity adjustment factors that already exist in the HCM. Capacity adjustment models would offer tremendous flexibility in terms of output parameters: they would facilitate the analysis of any performance measure within the HCM urban streets procedure. Without capacity adjustment models, it was believed that only a small fraction of output parameters could be analyzed. The plans towards developing capacity adjustment models are illustrated in Figure 16 and Figure 17. The goal was to adjust the capacity aspect of volume-to-capacity ratios, which are intermediate outputs in the urban streets procedure. These would then ripple through the procedure to produce accurate final performance measures (e.g., delay, travel time index).
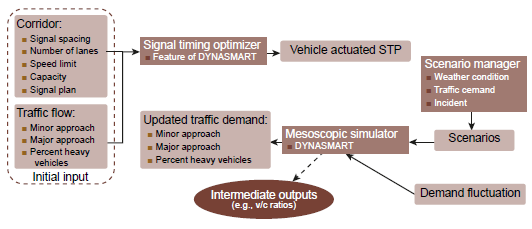 Note: STP = signal timing plan. v/c = volume to capacity ratio.
Figure 16. Flowchart. Proposed method for development of Highway Capacity Manual adaptive signal model.
Source: Federal Highway Administration
Note: STP = signal timing plan. v/c = volume to capacity ratio.
Figure 16. Flowchart. Proposed method for development of Highway Capacity Manual adaptive signal model.
Source: Federal Highway Administration
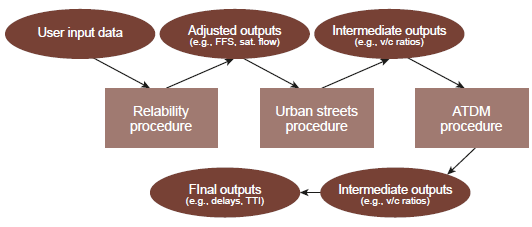 Note: ATDM = active transportation and demand management. FFS = free �ow speed. TTI = travel time index. v/c = volume to capacity ratio.
Figure 17. Flowchart. Proposed method for modeling dynamic lane groups in the Highway Capacity Manual.
Source: Federal Highway Administration
Note: ATDM = active transportation and demand management. FFS = free �ow speed. TTI = travel time index. v/c = volume to capacity ratio.
Figure 17. Flowchart. Proposed method for modeling dynamic lane groups in the Highway Capacity Manual.
Source: Federal Highway Administration
SCOPE
Given the time constraints of the project, it was desirable to define a narrow scope in which the HCM models for adaptive signal control, reversible center lanes, and dynamic lane grouping would be developed. For example, although the benefits of these three ATM strategies would be very different for coordinated and uncoordinated traffic signals, the experimental scope was limited to coordinated signals. This was largely due to the scope of the urban streets procedure, but also because data collection for both coordinated and uncoordinated signals might not fit within the project's time frame. Similarly, the team would focus on actuated coordination as opposed to pre-timed signals, for the reversible and dynamic lane strategies.
Regarding the temporal scope of these experiments, it was desirable to treat the three chosen strategies differently. For example, adaptive signals are known to produce some of their most significant benefits during the "shoulders" of the peak traffic periods. This ties back to the concept of adaptive signals producing maximum benefits under "medium" levels of congestion, as discussed earlier in this chapter. Therefore, an ideal adaptive signal experiment would capture the shoulder periods and/or medium congestion periods. Conversely, the reversible and dynamic lane treatments would tend to produce maximum benefits during the "second highest" peak period. In other words, these two strategies tend to work well when the default lane configuration works best during the most congested peak period (e.g., PM Peak), but is much less efficient during the next most congested peak period (e.g., AM Peak). Therefore, ideal experiments for reversible lanes and dynamic lane grouping would examine their benefits during the second highest peak period.
Regarding the spatial scope of these experiments, it was desirable to examine benefits across an entire corridor. However for dynamic lane grouping, whose impacts are highly dependent on the performance of physically adjacent movements, it was decided that extensive experiments should be performed at the single-intersection level, while still retaining the coordinated-actuated operations. The team also briefly discussed scenarios in which the number of major-street through lanes would be dynamically increased. Ultimately these scenarios were not considered during the Task 6 experiments, because the necessary number of downstream lanes would typically not exist. By contrast, it is much more common to have the necessary number of downstream lanes for a left-turn movement, or a right-turn movement, if a second turn lane could be dynamically added. Naturally, at intersections where the necessary number of downstream lanes for a left- or right- turn movement would not exist, the dynamic lane grouping strategy could not be implemented or considered. Indeed, "safe turning geometry" was defined as a pre-requisite to dynamic lane grouping implementation in (Su, Jiang, Jagannathan, & Hale, 2015).
Regarding signal timing optimization, this would be an important consideration for all three chosen ATM strategies, albeit in slightly different ways. For adaptive signal before-and-after studies, the "before" scenario would ideally have optimized, coordinated-actuated timing plans. For the reversible and dynamic lane treatments, both the "before" and "after" scenarios should have optimized timing plans. In other words, when the lane configuration of an intersection or arterial is changed, any prior signal timing plan would no longer be suitable for the new geometry. This implies that any realistic before-and-after study of reversible or dynamic lanes should involve at least two signal timing optimization efforts (i.e., one for "before", one for "after") for each data point, observation, or comparison.
Regarding integration of field data, it was desired at the outset of the project to develop robust models based on existing field data, while using simulated data to fill in the gaps. However due to the scarcity of field data located during Task 4 – Existing Data Sources, it became clear that any models developed during this project would need to be based on simulated data, with field data used for validity checks at best.
Finally, it was decided that the dynamic lane grouping experiments need not account for permissive left-turn movements. This is because the dynamic increase from one to two exclusive left-turn lanes would tend to make permissive left-turn movements unsafe, and would tend to be needed at traffic congestion levels not compatible with permissive left-turn movements. This does not mean that no permissive left-turn could ever safely benefit from dynamic lane grouping. It simply means that permissive left-turn movements were a relatively low priority in the context of this project, and were thus excluded from the experimental scope. Regarding permissive right-turn movements, also known as right-turns-on-red (RTOR), these were included in the experimental scope of dynamic lane grouping. This is because it is not uncommon for the inside right-turn lane of a dual right-turn lane group to have RTOR allowed.
TESTBEDS
After establishing the fundamental research parameters, it was time to develop virtual testbeds for the simulation experiments. The goal was to devise urban street intersection and/or corridor conditions that would clearly reveal ATM strategy impacts. For adaptive signals and reversible lanes, the need to measure corridor-level impacts led to simulation of three representative corridors in Chicago. For dynamic lane grouping, the need to measure intersection-level impacts led to a simple intersection design. This simplified intersection and experimental design treated the dynamic lane grouping approach as one entity, and combined all other intersection approaches into a second entity, to simplify the analysis of interdependent traffic movements. The Chicago testbeds are described first, followed by the simplified intersection testbed.
Chicago Corridors
The team selected West Peterson Avenue, West Chicago Avenue, and McCormick Boulevard as appropriate environments for ATM impact analysis. Analysis of multiple locations would add robustness to the final conclusions. The fundamental characteristics of these corridors are summarized in Table 4. These corridors had been previously modeled in virtual software platforms (i.e., DYNASMART™ and Synchro™). Thus, they were ideal choices for a project whose objective was to exploit existing data sources. Additionally, the corridor lengths, number of intersections, and signal spacings were considered excellent conditions for analyzing typical urban street operations. Figure 18 illustrates all three corridors, as depicted within the DYNASMART™ simulation platform.
Table 4. Characteristics of the Chicago Testbed corridors.
|
W Peterson Ave |
W Chicago Ave |
McCormick Blvd |
| Length (miles) |
4 |
4 |
4 |
| Number of Signalized Intersections |
8 |
11 |
9 |
| Intersection Spacing Range (miles) |
0.17 - 1.0 |
0.13 - 0.62 |
0.24 - 0.52 |
| Average Intersection Spacing (miles) |
0.56 |
0.35 |
0.45 |
| Other Comments |
Connects to I-94 |
Connects to I-90 |
None |
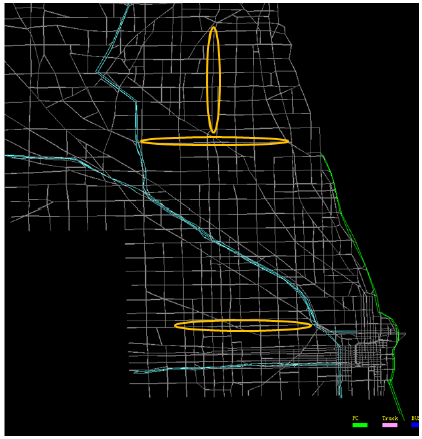 Figure 18. Screenshot. Testbed corridors for simulation of active traffic management strategy impacts.
Source: Federal Highway Administration
Figure 18. Screenshot. Testbed corridors for simulation of active traffic management strategy impacts.
Source: Federal Highway Administration
Simplified Intersection
For dynamic lane grouping, the need to measure intersection-level impacts led to a simple intersection design. This simplified intersection and experimental design treated the dynamic lane grouping (DLG) approach as one entity, and combined all other intersection approaches into a second entity, to simplify the analysis of interdependent traffic movements.
The experimental design called for analyzing DLG benefits under various combinations of through movement degree of saturation (v/c), through movement green ratio (g/C), adjacent turn movement v/c, and adjacent turn movement g/C. All other movements were served by the side-street signal phase. This helped to simplify the analysis of relative congestion levels in the following manner: to decrease congestion levels on the DLG approach relative to the rest of the intersection, it was only necessary to increase traffic volume demand on one side-street movement. This helped to isolate and analyze DLG impacts with minimal experimental noise. It also increased the number of combinations of v/c and g/C for both left- and right-turn scenarios, and major-street scenarios with two or three exclusive through lanes, that could be analyzed. Figure 19, Figure 20, and Figure 21 illustrate the lane geometry, signal phasing, and signal timing of one sample scenario. To conserve project resources, no data were collected for major streets having four exclusive through lanes, which was considered a low-priority scenario.
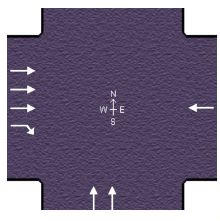 Figure 19. Screenshot. Sample testbed geometry for dynamic lane grouping.
Source: McTrans Center, University of Florida
Figure 19. Screenshot. Sample testbed geometry for dynamic lane grouping.
Source: McTrans Center, University of Florida
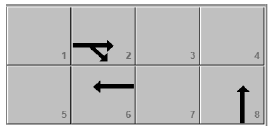 Figure 20. Screenshot. Sample testbed signal phasing for dynamic lane grouping.
Source: McTrans Center, University of Florida
Figure 20. Screenshot. Sample testbed signal phasing for dynamic lane grouping.
Source: McTrans Center, University of Florida
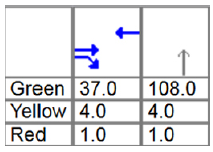 Figure 21. Screenshot. Sample testbed signal timing for dynamic lane grouping.
Source: McTrans Center, University of Florida
Figure 21. Screenshot. Sample testbed signal timing for dynamic lane grouping.
Source: McTrans Center, University of Florida
The experimental design called for analyzing hundreds of intersection scenarios, and required signal timing optimization both before and after DLG. For example, after optimizing signal timings for the "before" scenario in Figure 18, it would then be necessary to add a second exclusive right- turn lane, subtract an exclusive through lane, and re-optimize the timings.
Moreover, optimized timings in the "before" scenario had to match certain levels of v/c and g/C on the DLG approach, sometimes requiring numerous trial-and-error optimizations. Note that the need for matching certain levels of v/c and g/C on the DLG approach will become clearer when experimental results are presented in the next chapter. To efficiently meet these experimental requirements, the Highway Capacity Software™ (HCS 2010™) was chosen as the analysis platform. This choice of traffic analysis tool would allow hundreds of signal timing optimizations to be performed within a reasonable time frame, because the HCS intersection evaluations offer much smaller computer run times than comparable simulation-based evaluations.
CONCLUSIONS AND NEXT STEPS
The team's planned methodology for Task 6 – Original Research was essentially finalized by the beginning of April 2016. This methodology consisted of a set of key experimental parameters and testbeds, to be customized for each individual ATM strategy. Proper choice of experimental parameters would help towards developing robust and reliable models. Improper choice of experimental parameters would interfere with the team's ability to meet project objectives. Therefore throughout the month of March, the team held discussions about what might be the optimal choice of experimental parameters. The experimental parameters fell into three categories: input parameters, output parameters, and experimental scope. While determining the output parameters, it was decided that capacity adjustment models should be developed for each ATM strategy. If successful, this would facilitate the analysis of any performance measure within the HCM urban streets procedure. Thus in April 2016, following much planning and discussion over what experimental parameters would be best for the project, the simulation-based experiments would finally begin. These experiments are described next in Chapter 6.