Collaboration Across the Road Weather Enterprise: The Pathfinder Project
APPENDIX B. MAKING THE CASE FOR AN INVESTMENT DECISION
OPERATIONAL POLICIES AND CONSTRAINTS
Operational policies for road weather management activities vary from State to State, both in terms of their detail and their formality. Many State transportation agencies have documented policies and procedures that describe strategies for conducting winter and non-winter maintenance activities under various adverse weather conditions. Similar guidelines for the management of traffic operations under adverse weather conditions appear to be less widespread but are gaining ground because of the efforts of the Federal Highway Administration (FHWA) Weather- Responsive Traffic Management initiative, among other efforts. In many instances, the documented policies and procedures appear to be derived from personnel experience and informal rules of practice. It also appears that documented operational policies are supplemented with undocumented practices.
According to the American Association of State Highway and Transportation Officials (AASHTO), State transportation agencies are increasingly adopting the use of performance- based management approaches. All State Departments of Transportation track asset condition and safety data. The majority of States provide comprehensive performance data to decision makers to increase accountability and achieve the best possible transportation system performance under current levels of investment. The definition of the performance measures and
the formality of reporting again vary from State to State, but weather-related metrics, particularly relating to snow removal during winter storms, are not uncommon. Overall, no operational policies related to road weather management are common across the United States.
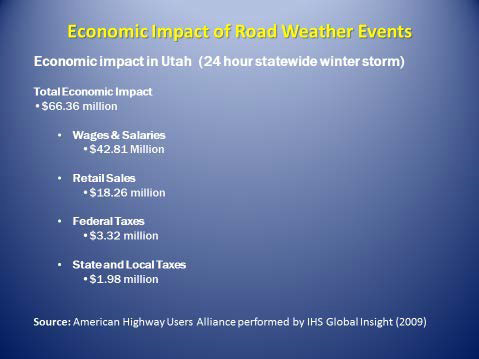
Figure 12. Photo. Economic Impact of Road Weather Events.
(Source: American Highways Users Alliance performed by IHS Global Insight)
Table 4. Weather-Related Crash Statistics.
|
Road Weather
|
Weather-Related Crash Statistics
|
|
573,784
|
crashes
|
10%
|
of vehicle crashes
|
46%
|
of weather-related crashes
|
|
228,196
|
persons injured
|
10%
|
of crash injuries
|
52%
|
of weather-related injuries
|
|
2,732
|
persons killed
|
8%
|
of crash fatalities
|
47%
|
of weather-related fatalities
|
|
151,944
|
crashes
|
3%
|
of vehicle crashes
|
13%
|
of weather-related crashes
|
|
38,770
|
persons injured
|
2%
|
of crash injuries
|
9%
|
of weather-related injuries
|
|
559
|
persons killed
|
2%
|
of crash fatalities
|
10%
|
of weather-related fatalities
|
|
28,533
|
crashes
|
1%
|
of vehicle crashes
|
3%
|
of weather-related crashes
|
|
10,448
|
persons injured
|
1%
|
of crash injuries
|
3%
|
of weather-related injuries
|
|
495
|
persons killed
|
2%
|
of crash fatalities
|
9%
|
of weather-related fatalities
|
(Source: Ten-year averages from 2004 to 2013 analyzed by Booz Allen Hamilton, based on
National Highway Traffic Safety Administration data)