Applying Archived Operations Data in Transportation Planning: A Primer
2. MEETING A RANGE OF PLANNING NEEDS WITH ARCHIVED OPERATIONS DATA
Archived operations data can be used to support existing planning methods, as well as enable new ones. This chapter introduces the planning activities that can be improved through the use of archived operations data. Many of these planning applications will be revisited using detailed case studies in Chapter 5, Planning Opportunities for Archived Operations Data – Basic to Innovative.
Performance-Based Planning and Programming
Performance-based planning has received a lot of attention from transportation agencies in the past 5 years and is a basic underpinning of the Fixing America's Surface Transportation (FAST) Act requirements for State departments of transportation (DOTs) and metropolitan planning organizations (MPOs). Figure 2 shows the basic process of performance based planning and programming.3 Conceptually, performance-based planning is similar to the congestion management process (CMP) in that agencies identify specific objectives and needs, take actions, and continuously monitor conditions with performance measures.
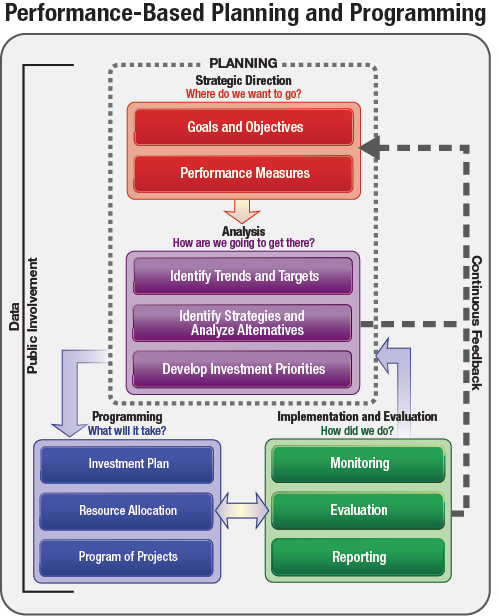
Figure 2. Diagram. Flow chart of performance-based planning and programming.
Source: Federal Highway Administration.
For the most part, undertaking performance-based planning would be impossible without archived operations data. Below are examples of how archived operations data enables key elements of performance-based planning:
- Monitoring and evaluating system performance to identify performance issues, prioritize projects, and develop reports. Archived travel time data forms the basis for computing a wide variety of congestion, reliability, and freight performance measures. The data is usually available at high spatial and temporal resolution (e.g., 1 minute measurements by individual link of roadway location—where segments can be as small as just a few hundred meters) and can be aggregated to many other levels (e.g., peak period by route). For example, Texas Agricultural and Mechanical University's annual Urban Mobility Report now uses archived operations data to produce congestion and reliability metrics by urban area.4 Many agencies also produce mobility performance reports using this data.5
Travel time data is not the only useful type of archived data for performance-based planning. Analysis of travel times reveals trends and identifies problems, but it does not indicate what is causing them. Additional operations data on factors that may be causing congestion can be used to understand travel time trends. This data includes incident and work zone characteristics (especially duration by amount of blockage), weather patterns, and demand fluctuations. Figure 3 shows an example of how incident data can be used to "drill down" into the details of an event to explain outcomes—in this case, travel time reliability. Likewise, other contributors to congestion, such as work zones, can be broken down into smaller components to examine in more detail and compare against archived data. This not only helps to explain changes in the outcomes of an event, but also can lead to changes in response activities. In the case shown in Figure 3, by examining an incident timeline from an agency's advanced transportation management system (ATMS), it is possible to identify which incident response actions take excessive time to complete. Several incident data aggregation and visualization tools have been developed that help planners identify trends in operations, environmental conditions, geographies, and road usage, which can affect safety. As one example among many, see Indiana's Mobility Performance Report (available at: http://docs.lib.purdue.edu/imr/).
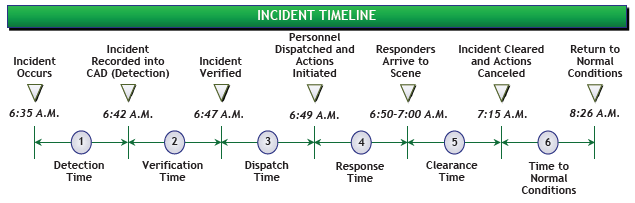 Figure 3. Graphic. Timeline displaying time taken for each activity during the incident.
- Setting performance targets. The FAST Act requires agencies to set performance targets and to monitor progress toward those targets. Archived data provides information on past trends that are useful in establishing targets (i.e., "it is good to know where one has been before deciding where to go."). When combined with forecasts, trend data provides a picture of what targets are attainable. Archived operations data also can be used to understand why targets were or were not achieved.
- Evaluation of completed projects. A key component of performance-based planning is the ability to conduct evaluations of completed projects and to use the results to make more informed investment decisions in the future. State DOTs and MPOs routinely invest a great effort in forecasting the impact of capital, operating, and regulatory improvements on general and truck traffic trips, but they seldom have the opportunity to evaluate the outcomes of their investments, except in isolated cases where special studies are conducted. The availability of archived data is changing this situation—special data-collection efforts no longer have to be undertaken. Archived data enables the establishment of an ongoing project and policy evaluation program.
There are multifold advantages to instituting a formal evaluation program. Successes can be highlighted and failures can be enlightening. When a project does not perform as planned, the evaluation may indicate remedial action that can be taken. In addition, by documenting the measured impacts of a project or strategy, that information can be used by analogy when estimating the potential benefits of similar projects in the future.
- Trip-based mobility monitoring and accessibility. Although archived origin-destination (O-D) travel time data is just becoming available, it is expected to become more prevalent as technology evolves. O-D data makes it possible to monitor the performance of trips taken by travelers. By contrast, the current state-of-the-practice is to monitor performance from the facility's perspective, because measurements are taken at the facility level. A comprehensive mobility measurement program will involve using both trip- and facility based measures because they each inform analysts about the nature of mobility in a region. Many transportation investments, as well as land use and development policies, are oriented to the entire trip-making process; therefore, understanding the full trip performance experienced by travelers is important. The use of emerging operations strategies, such as active transportation and demand management (ATDM) and integrated corridor management (ICM), also require information on the entire trip-making process. Additionally, measuring accessibility of employment, recreation, shopping, and other destinations is a logical extension of trip-based mobility performance.
Planning Model Development: Analyzing Alternatives and Identifying Future Performance Issues
Archived operations data enables planners to significantly improve the performance of their existing planning models and expand the range of models they can use. Long-range transportation plans (LRTPs), as well as most of the studies conducted by planners, utilize models to identify deficiencies and compare the impacts of alternative investments. The travel demand forecasting (TDF) and traffic simulation models used by planners for these purposes are growing increasingly sophisticated in both their formulation and data requirements. Archived operations data provides a convenient source of data for these planning models. A major advantage of archived operations data is its high degree of temporal and spatial coverage. Traditionally, data to operate, calibrate, and validate models was based on relatively small samples. Archived operations data provides much greater detail in terms of coverage. The following list describes opportunities for archived operations data to support planning models.
- Model inputs. Several inputs to TDF models and transportation system performance monitoring can be developed from archived data:
- Peak-hour volumes (PHV), annual average daily traffic (AADT), peak-hour factor (K-factor), and directional factor (D-factor) can be derived from continuously collected volume data. Link capacities can be empirically derived. Improved vehicle-miles of travel (VMT) data for TDF and air quality models, as well as for safety analysis, also can be developed with archived data.
- From continuously collected speed and travel time data, free flow and peak-hour speeds and travel time distributions can be established for individual facilities. For air quality models, hourly speeds by link for the base condition can be developed with archived data.
- Model calibration and validation. The major outputs from TDF models are volumes and average speeds. These can be checked against archived data. Also, interzonal travel times can be developed from archived data; this can be used to calibrate the trip distribution phase of TDF modeling.
- Emerging modeling frameworks. As TDF and traffic simulation models grow increasingly sophisticated, so do the data requirements to run the models. This is especially true for reliability analyses. Recently, traffic simulation models have been applied to reliability studies by making multiple runs, where each run (or scenario) represents various combinations of conditions that influence reliability. For example, demand levels may be set at low, medium, or high, and the presence of an incident may be defined by different blockage and duration levels. In the scenario approach, the probability of each occurrence for each combination must be known so that the results can be properly combined via weighting. Archived data for the facilities being studied is analyzed to determine the probabilities.
The Strategic Highway Research Program 2 (SHRP 2) was a national research program managed by the Transportation Research Board from 2006 to 2015 to find solutions for critical national transportation challenges: highway safety, congestion, and road and bridge renewal. SHRP 2 research produced several analytical procedures for estimating reliability (Table 2). These procedures are beginning to be put into practice by transportation agencies across the United States. The products from all of these research efforts require inputs derived from archived operations data. As noted in Table 2, several SHRP 2 Reliability products require link capacity values as input. Modelers tend to use calculated rather than empirical link capacities; however, during the pilot testing of the SHRP 2 Reliability products, it was found that using empirical capacities is critical to obtaining reasonable results.
While the use of archived operations data for planning is uncharted territory to some agencies, more and more agencies are using archived operations data to enhance and expand their planning capabilities. The next chapter will help agencies that have a range of experience to overcome the institutional and technical challenges commonly encountered.
Table 2. Granularity of Strategic Highway Research Program 2 reliability-oriented analysis tools.6
| Strategic Highway Research Program 2 Project |
Analysis Scale (in order of increasing complexity) |
Input Requirements from Archived Data |
| Sketch planning; system or project level. |
Incident duration and frequency. |
| Detailed sketch planning; mainly project level. |
Incident and work zone lane-hours lost; hours of year with rainfall and snowfall above thresholds. |
| Performance monitoring and project evaluations using empirical data. |
Demand variability; presence of incidents, work zones, and weather tagged to individual facilities. |
| Project planning using HCM scale of analysis. |
Volumes on links and ramps, demand variability, incident duration by blockage type, and link capacities and free flow speeds. |
| Project planning using mesoscopic simulation scale of analysis. |
Volumes on links and ramps, demand variability, and link capacities and free flow speeds. |
| Regional planning using linked travel demand and mesoscopic simulation analysis. |
Incident duration and frequency. |
| Regional planning using linked travel demand and mesoscopic or microscopic simulation analysis. |
Volumes on links and ramps, demand variability, incident duration by blockage type, and link capacities and free flow speeds. |
|