Safety Implications of Managed Lane Cross Sectional ElementsCHAPTER 4: DATA COLLECTIONDefining SegmentsSegments were defined by the location of managed-lane access control change. A new segment would start when access was (or was not) permitted. Each segment was then defined as being managed lane weaving, ramp, or non-weaving segment. For this study only those segments that were non-weaving segments were included in the analysis. The objective of this project was on the effects of cross section dimensions on crashes. Because of limited number of sites with five, six, or seven general-purpose lanes within the preliminary datasets, those California sites were removed from the analysis resulting in the analysis considering crashes on freeways with three and four general-purpose lane freeways in California. For Texas, freeways with three to five general-purpose lanes were included. The minimum length of segment for California was 0.11 miles with the majority of sites between 0.8 and 1.7 miles. The minimum length of segment for Texas was 0.12 miles, with the majority of sites between 0.9 and 1.4 miles. After removing sites where weaving was expected, locations undergoing construction, and locations with no annual average daily traffic (AADT) data available, there were 128.0 miles in California (all 128.0 miles with flush buffers) and 60.4 miles in Texas (41.7 miles with pylon buffers and 18.7 miles with flush buffers). VariablesFor each segment identified, the research team collected geometric characteristics using Google Earth, a software package that allows browsing and measuring satellite imagery. Since this package allows the user to compare satellite images taken at different points in time, the research team annotated the date of the earliest satellite image containing the same managed lane characteristics. In other words, the research team noted the earliest date when the managed lane characteristics matched. In most cases, the change reflected when the managed lane was added to the freeway. This step was done with the purpose of excluding any time period earlier than the date when the managed lane geometric characteristics changed. Table 4 provides descriptions of the specific geometric variables considered for the analyses along with the average daily traffic variables. The research team gathered the information for the geometric variables by using the measurement tool available in Google Earth. These variables were selected because they have been shown in the literature to be potentially influential on freeway safety. The research team acquired the posted speed limit information by using the StreetView feature available in the Google Earth suite of tools.
Source: Texas A&M Transportation Institute Dataset Characteristics – GeometricsTable 5 provides geometric details for the segments being used in the evaluation. All of the buffers for the California segments were flush (i.e., no pylons) with widths that varied between 1 ft and 12 ft. The buffers generally consisted of white and yellow lane line markings. The larger widths (9 or 12 ft) were associated with preserving space for a downstream managed lane ramp on I-405 as illustrated in Figure 6. I-405 also has narrow buffer widths. Several freeways have buffers with a 4-ft to 5-ft width as shown in Figure 7. Figure 8 shows another example of a wide buffer where a motorcycle is using the available space. The buffers in Texas include flush buffers and flush buffers with pylons. The Texas sites with flush buffers ranged between 1.5 and 5.0 ft, while the buffers with pylons were between 4.0 and 6.0 ft. The buffer pavement markings in Texas use white lines. Figure 9 shows an example of pylons on a Texas freeway.
Source: Texas A&M Transportation Institute 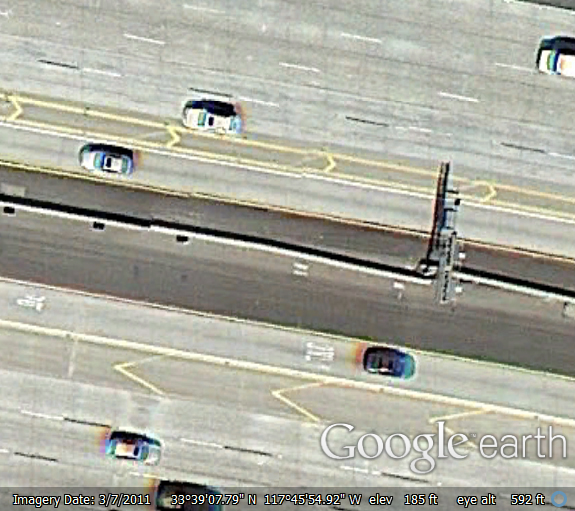
Figure 6. Graphic. Example of wide buffers on California I-405. 
Figure 7. Graphic. Example of wide buffer in California. 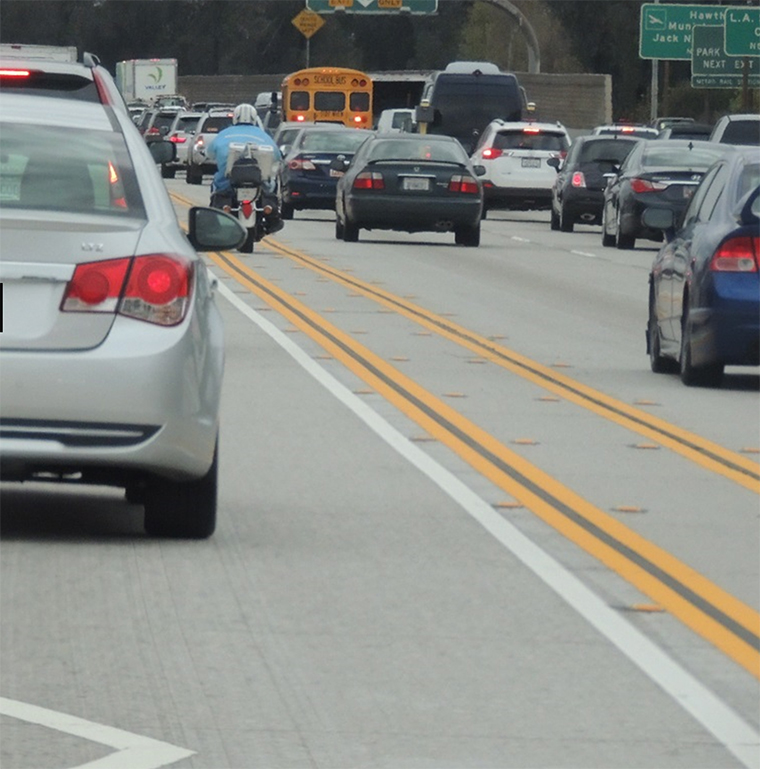
Figure 8. Graphic. Another example of wide buffer, note motorcycle using the buffer area. 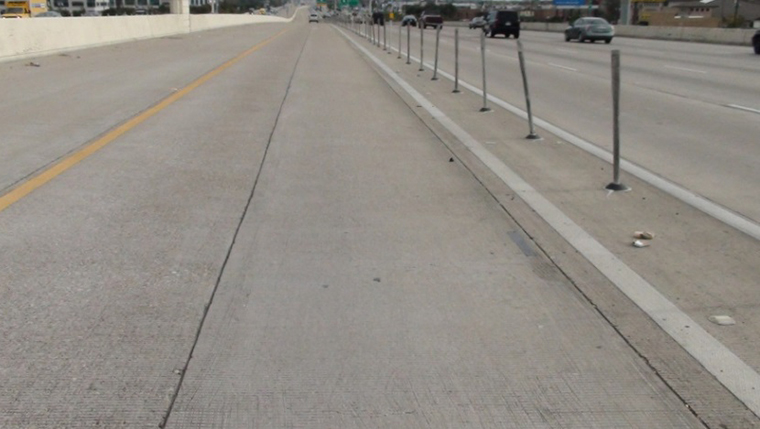
Figure 9. Graphic. Example of pylons in buffer on Texas freeway. Dataset Characteristics – CrashesTexas Crash DataTable 6 shows the number of crashes identified for each corridor in Texas, including all levels of severity. The number of crashes per year seems consistently increasing at each site, except for sites TX-DA-075[P] and TX-DA-635[P] where year 2009 shows atypically high and low counts, respectively. In the case of TX-DA-075[P], it appears to have been a rare year; in the case of TX-DA-635[P], however, the research team verified that during 2009, geometric characteristics of the managed lanes could not be verified for 11 out of the 20 segments within this site and therefore crashes for those segments are not represented in Table 6. Cells denoting "NA" indicate that no data was available for that corresponding site and year due to construction or a different cross section.
Notes on columns:
Source: Texas A&M Transportation Institute From this pool of crashes, the research team identified those that had an annotation of "HOV" or "MANAGED" lane resulting in identifying only 47 crashes. The distribution of these crashes is shown in Table 6. The research team suspects that this table may not include every HOV (or managed lane) crash, since these crashes were identified using annotation fields, instead of coded fields (as is the case in the California data). Since this is a very limited subset, the research team only conducted formal evaluations on total crashes. California Crash DataThe research team matched the crash records obtained from HSIS to the mile post limits of the segments identified from satellite imagery. Crashes and traffic characteristics for the four routes selected for analysis were also obtained. The HSIS has AADT data that reflects number of vehicles for both directions on the freeway. The data were matched utilizing the route and county number along with beginning and ending milepost identified for each segment. AADT counts are also available from the California Department of Transportation Performance Measurement System. This database is available online and provides information regarding the performance of California highways. Through a query on the website, a performance analysis report for each highway was generated. A report was made for the length of the highway in each direction from the years 2007 through 2011. The report includes information regarding the day, hour of the day, mile post where sensor is located, freeway number and direction, and several different methods to calculate AADT to account for missing data from the sensor. The data for HV (abbreviation used for HOV or managed lanes) were used in the analysis with managed-lane crashes. Table 7 shows the number of managed-lane crashes (i.e., those crashes with a location type code of V (HOV lane) or W (HOV buffer) identified for each corridor in California, including all levels of severity. The top half of Table 7 lists the number of total freeway crashes by highway corridor. The length shown in the table corresponds to the sum of the non-weaving segment lengths included in the dataset. The yearly number of crashes per year seems consistent within each corridor with a general upward trend over time. The year of 2007 frequently has fewer crashes because it does not always reflect a full 12-month of data due to changes in managed-lane cross sections.
Source: Texas A&M Transportation Institute | |||||||||||||||||||||||||||||||||||||||||||||||||||||||||||||||||||||||||||||||||||||||||||||||||||||||||||||||||||||||||||||||||||||||||||||||||||||||||||||||||||||||||||||||||||||||||||||||||||||||||||||||||||||||||||||||||||||||||||||||||||||||||||||||||||||||||||||||||||||||||||||||||||||||||||||||||||||||||||||||||||||||||||||||||||||||||||||||||||||||||||||||||||||||||||||||||||||||||||||||||||||||||||||||||||||||||||||||||||||||||||||||||||||||||||||||||||||||||||||||||||||||||||||||||||||||||||||||||||||||||||||||||||||||||||||||||||||||||||||||||||||||||||||||||||||||||||||||||||||||||||||||||||||||||||||||||||||||||||||||||||||||||||||||||||||||||||||||||||||||||||||||||||||||||||||||||||||||||||||||||||||||||||
|
United States Department of Transportation - Federal Highway Administration |
||