Office of Operations
21st Century Operations Using 21st Century Technologies

Planning for Transportation Systems Management and Operations within Subareas – A Desk Reference

CHAPTER 3. APPROACH TO SUBAREA PLANNING FOR TRANSPORTATION SYSTEMS MANAGEMENT AND OPERATIONS

This chapter provides information on fundamental activities that should typically occur when planning for transportation systems management and operations (TSMO) at a local or subarea scale. Recognizing that subarea planning typically focuses on issues such as land use and zoning, development densities and urban design, the environment and recreational facilities, and transportation together, rather than on TSMO specifically, this chapter puts TSMO planning into the context of a more comprehensive planning study process. Figure 3 provides an overview of a comprehensive approach to planning for TSMO within subareas and is used throughout the next two chapters to highlight the major activities. This approach to TSMO planning in subareas builds upon the framework of an objectives-driven, performance-based approach to planning for operations that has been developed for advancing TSMO at the metropolitan or regional scale.

Key steps in this approach include:

  • Getting started - scoping the effort and building a team.
  • Gathering information on current and future context and conditions.
  • Developing an outcome-oriented operational concept, including operations objectives.
  • Identifying operations performance needs, gaps, and opportunities.
  • Developing an integrated TSMO approach:
    • Identifying TSMO strategies based on operations objectives and performance needs.
    • Evaluating TSMO strategies.
    • Selecting TSMO strategies.

GETTING STARTED - SCOPING THE EFFORT AND BUILDING A TEAM

Successfully advancing TSMO in a local or subarea plan requires a foundation of effectively scoping the effort and building a team of partners and stakeholders to bring into the planning process (Figure 4).

Flow diagram: planning for transportation systems management and operations
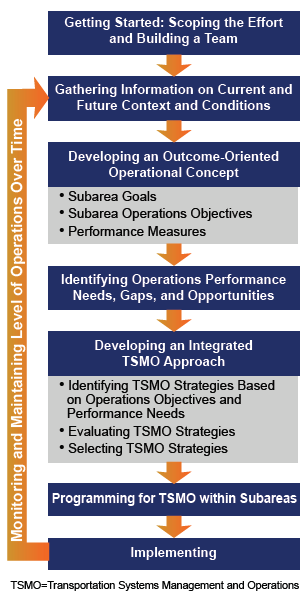
Figure 3. Diagram. Approach to planning for transportation systems management and operations within subareas.

Subarea planning typically includes significant public engagement (involvement of community groups and residents), given the local scale of planning. Because these plans typically include a significant focus on land use and development, they often engage discussions about density and design of development; street network and street scape improvements; and issues related to affordable housing, schools, and recreational facilities. While transportation is an important component, subarea plans traditionally have not engaged discussions about transit management, parking management, traffic incident management (TIM), and other operational considerations. Therefore, key questions to consider in scoping the effort include:

  • What do we want to accomplish/address from a transportation system operations perspective?
  • What are the pressing issues in terms of mobility, reliability, and transportation safety in the area of study?
  • What agencies, organizations, and stakeholders are involved in aspects of TSMO? Who beyond the traditional participants should be involved in this planning process, why, and how?

Tools that can be leveraged to scope the effort and build a team include:35

  • Statewide or regional intelligent transportation system (ITS) architecture - Most States and large metropolitan areas already have an ITS architecture in place. This framework for planning, defining, and integrating ITS can provide insights into the management and operations services, stakeholders, and performance measure data that may play a role in a subarea plan.
  • Regional concept for transportation operations (RCTO) - An RCTO is an objectives driven, performance-based approach to planning for one or more specific operations areas (e.g., traveler information or traffic incident management (TIM)). The RCTO, which typically includes roles, responsibilities, and resources needed to achieve specific operations objectives, can be used as a tool to develop and implement TSMO strategies at the subarea level.
  • Statewide or regional corridor planning guide - Some State departments of transportation (DOTs) and metropolitan planning organizations (MPOs) have developed TSMO strategic plans or program plans to guide their efforts. For instance, Metro, the MPO for the Portland, Oregon, region, developed a Regional TSMO Plan.36 This plan identified four investment focus areas (multi-modal traffic management, traveler information, TIM, and transportation demand management (TDM)) and identified investment priorities, which could be used to support local area planning efforts. A number of State DOTs also have developed TSMO programs and associated plans to help provide direction on priorities. For instance, Florida DOT developed a TSMO Strategic Plan and a TSMO Business Plan and has been working across its Districts to prioritize TSMO strategies.37 A regional or statewide TSMO plan can provide direction on objectives and strategies to consider at a subarea level.

The team that focuses on TSMO within a subarea planning study should interact with and be integrated into the broader study team for the subarea to ensure that TSMO strategies and operational issues are explored in the context of a full array of planning goals and issues. For instance, goals and priorities driving a subarea study may include topics such as increasing accessibility for pedestrians and bicyclists, increasing transit ridership, and supporting economic vitality. TSMO strategies should be considered together with investments in infrastructure and programs that support these goals, such as investments in bicycle lanes and improved pedestrian crossings.

Chapter 1 includes a preliminary list of transportation-related stakeholders that should be considered to support TSMO in a subarea study. Effectively engaging the team involves developing a shared understanding of roles, responsibilities, and the needs of key constituencies (e.g., partnering agencies, authorities, network owners and operators, stakeholders, and the users of the subarea transportation system). The team will then work together to define needs in the study area, agree upon goals and objectives, develop preliminary consensus on pragmatic concepts for strategies or combinations of strategies that realistically address specified goals and objectives, and develop viable operating scenarios under which the concepts and strategies can be analyzed.

Although there is no universal approach to team building, the following approaches have worked for some regions:38

  • Build on an existing collaborative group - Draw from an existing operations group or a committee that has already been used to develop a regional ITS architecture or RCTO as a starting point for identifying stakeholders. An existing operations group may be able to incorporate the subarea project into its meeting agendas.
  • Ensure at least one committed champion for TSMO - Ideally, the champion has a clear vision of desired outcomes, brings the stakeholders together, ensures they are engaged, and works to get the support needed to achieve the desired outcomes.
  • Gather support from elected or appointed officials and agency leadership - Identifying an advocate for TSMO who is an elected or appointed official or is at the executive leadership level within a transportation agency can help enhance the success of bringing in TSMO strategies.
  • Engage participants - It is important to identify and engage the array of operating agencies and stakeholders that will play a role in, and ultimately be critical to, operations within the study area. Typically, this will include local transportation agencies, a State DOT, transit agencies, and representatives of local governments and community groups. Law enforcement, emergency responders, and major employers also may be important participants. If some participants, such as emergency management agencies, are unable to attend project committee meetings, better success may be realized by taking the project to other established forums held by those stakeholders.39
  • Form a tiered collaborative structure with a strong mandate - The use of a steering committee with agency leaders can provide project guidance and make high-level decisions, while a working group comprised of technical staff can help shape the technical approaches needed to deliver on the leaders' vision.

Benefits of Collaboration

This image is based on Figure 3 and calls out Step 1, of the approach for planning for transportation systems management and operations within subareas, which is Getting Started: Scoping the Effort and Building a Team
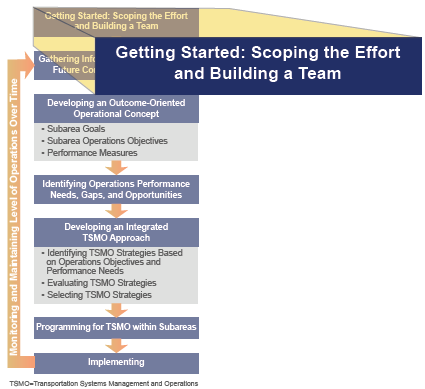
Figure 4. Diagram. The "Getting Started" activity of the approach for planning for transportation systems management and operations within subareas.

Enhancing collaboration and coordination among agencies involved in TSMO within a subarea is vital to developing solutions for optimizing performance across the transportation network; this is particularly true in complex urban areas with many different operators and choices of modes and routes. Collaboration produces tangible benefits both to participating agencies and jurisdictions as well as to system users and other stakeholders who depend on effective multi modal transportation system operations in moving people and goods. These benefits fall into three general groups:

  • Access to and use of existing resources.
  • Improvements in current operations.
  • Better outcomes for system users and other stakeholders.40

Expanded Access to Resources and More Efficient Use of Existing Resources

The visible and immediate benefits of collaboration among operating agencies and stakeholders in a subarea may be realized through strategies such as:

  • Pooling funds to avoid duplicate investments or purchases.
  • Participating in joint training activities.
  • Taking advantage of special expertise or experience that may reside in some, but not all, agencies.
  • Adopting common standards for technology that can simplify interagency and multijurisdictional interactions and mutual support.
  • Acquiring and maintaining more current and more effective hardware and software systems.

Each of these approaches, or several in combination, can improve the use of available resources.

Improved Agency Operations

Beyond more efficient access to and use of resources, collaboration enables cooperating entities to perform their missions more effectively. These improvements can result in:

  • Sharing information among system operators and owners so that they have greater awareness of current and anticipated events affecting other agencies (i.e., traffic management specialists know when there is a transit disruption, and vice versa).
  • Developing standard protocols and procedures among agencies that operate within the subarea.
  • Improving responsiveness to events and incidents by sharing information, assets, and responsibilities.
  • Working cooperatively to leverage all available assets, skills, and personnel to improve efficiency.

Each of these and other strategies can enhance working relationships during routine operations and offer the added benefit of providing the foundation for preparing for and responding to emergency situations, crashes, intentional attacks on transportation assets or other infrastructure, planned special events, or major weather events.

Better Outcomes or Results for Travelers, Suppliers or Shippers, and Other Stakeholders

Ultimately, system users and communities benefit through effects such as:

  • Safer transportation facilities (e.g., transit stations and bicycle/pedestrian paths and lanes).
  • Lower fuel consumption through more efficient traffic operations combined with more and better alternatives to private-vehicle use.
  • Shorter travel times achieved through congestion mitigation strategies and more effective system management and operation.
  • More accurate, timely, and relevant information about past, current, and anticipated travel conditions, modes, schedules, travel times, and travel options so that travelers, shippers, and others can make more informed travel decisions.

Over time, these benefits will prove to be the most important because they are the outcomes that are valued by travelers, shippers, environmental organizations, neighborhood associations, bicycle/pedestrian advocates, residents, and others who have a stake in the subarea.

A Framework for Collaboration and Coordination in a Subarea

Five key, or foundational, elements characterize the collaboration and coordination necessary for effective TSMO within a subarea. As shown in Figure 5, these five elements are connected, interactive, iterative, and build upon foundational elements that can be applied at multiple scales.41

Circular diagram contains the elements of a framework for collaboration and coordination in a subarea: process, products, resources, and performance.
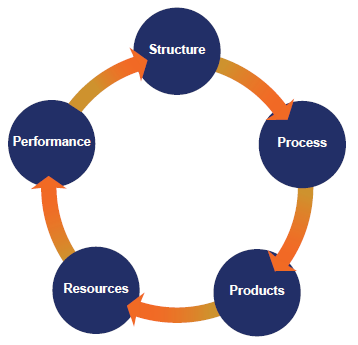
Figure 5. Diagram. The framework for collaboration and coordination in a subarea.
Source: Federal Highway Administration. Regional Transportation Operations Collaboration and Coordination: A Primer for Working Together to Improve Transportation Safety, Reliability, and Security.

The starting point for collaboration and coordination is the structure, or the means through which individuals and agencies come together to identify needs, establish priorities, make commitments, allocate resources, and evaluate performance. In a subarea, which may be a city or county jurisdiction, business district, unincorporated area, or other area, a structure might be formalized in a working group that brings together agencies that play a role in transportation system operations. This group could be convened as part of a local government transportation or planning agency, a transportation management association, or other organization.

The process is the course of action taken through which options are created and decisions are made. The process could involve formal activities like a structured set of meetings as part of a subarea planning process or informal activities.

The products are the agreements, arrangements, and commitments to move forward with agreed upon strategies. The product may include identified priorities in a subarea plan, a concept of operations, operating plans and procedures, or other documents.

Resources reflect the commitments made in terms of funding, people, equipment, facilities, support, and other assets needed to implement the strategies identified for the subarea. Finally, performance measurement provides the feedback to determine how well the agreed upon strategies have been implemented and executed, and the effect these strategies have had on outcomes of interest relative to the agreed-upon goals and objectives.

Finally, performance measurement provides the feedback to determine how well the agreed upon strategies have been implemented and executed, and the effect these strategies have had on outcomes of interest relative to the agreed-upon goals and objectives.

Connections to Broader Planning and Operations Efforts

Planning efforts to enhance transportation operations within a subarea should build off of broader planning efforts for TSMO as well as existing operations programs and strategies at a local, regional, and State level. Regardless of the size of the area, planning for enhanced transportation system operations in a subarea should recognize and build upon existing programs, including:

  • ITS infrastructure (e.g., fiber-optic networks, variable message signs, and traffic cameras).
  • State and/or regional traveler information systems, which can be utilized to help provide real-time information on incidents, speeds, and other aspects of operating conditions for highways, arterials, and transit in the subarea.
  • Regional incident management and response programs, which can be expanded or targeted to address subarea-specific issues.
  • Work zone management strategies used in transportation management plans for significant projects.
  • Regional TDM programs, which often include ridematching services, employer outreach, and public outreach and incentives to encourage use of alternatives to driving alone, as well as local TDM programs, which may be administered by a local government or transportation management association.
  • Existing parking management programs, including policies associated with municipal parking lots, garages, and meters as well as parking permit programs and real-time parking availability information.
  • Transit operations, including scheduling, transfer policies, and real-time transit information.
  • Existing traffic signal programs.

National Capital Region Subarea Transportation Demand Management Programs

Transportation demand management (TDM) program services and incentives can be targeted to specific subareas. For instance, in the Washington, DC, metro area, individual counties and the District of Columbia operate TDM programs that are targeted to employers, employees, and residents in their jurisdictions. For instance, the Arlington County Commuter Services operates programs such as Arlington Transportation Partners, which provides TDM outreach to businesses, multi-family residential communities, developers, and hoteliers; BikeArlington and WalkArlington programs, which promote active transportation; and Capital Bikeshare Arlington and other programs to encourage alternatives to driving. Several jurisdictions also have local transportation management associations that provide TDM services to smaller areas, particularly suburban activity centers, such as Tysons Corner in Northern Virginia and Bethesda in suburban Maryland. These programs utilize regional ridematching, a guaranteed ride home program, and regional marketing through the regional Commuter Connections program, operated by the Metropolitan Washington Council of Governments.

For more information, see: http://www.commuterconnections.org/about-us/.

In developing goals, operations objectives, and performance measures and identifying and selecting appropriate strategies for application, the approach to planning for TSMO in a subarea should build upon existing planning efforts that relate to system operations, including:

  • Priorities identified in State and regional transportation plans - Statewide and metropolitan transportation plans identify policies and priorities that can be used to inform identification of potential TSMO strategies for a subarea. For instance, some plans emphasize demand management or include a policy to prioritize strategies that increase transit, ridesharing, and non-motorized travel over single-occupancy vehicle travel.
  • State or metropolitan area TSMO program plans - As noted earlier, some State DOTs have developed TSMO program plans that identify key priorities and strategies, and these may help to inform strategies that are applicable within the subarea. For instance, Wisconsin DOT's Traffic Operations Infrastructure Plan provides traffic operations infrastructure deployment recommendations for priority and emerging priority corridors in the State. It and also provides Metro node summaries, which might be consulted in developing a subarea plan.42 A number of MPOs also have developed regional TSMO plans. For instance, the Baltimore Metropolitan Council developed a Regional Management and Operations Strategic Deployment Plan, which includes goals, objectives, and strategies as well as screening factors to suggest an implementation order for projects. Similarly, the Southeastern Wisconsin Regional Planning Commission completed a Regional Transportation Operations Plan in 2012, which identifies short-range actions recommended for implementation over a 5-year period. While these plans are often high-level, where available, they will serve as a very strong basis for more detailed subarea-focused efforts.
  • Regional ITS architectures - A regional ITS architecture provides a common framework for planning, defining, and integrating ITS across a State or region. A regional ITS architecture can be used by State and local planning agencies and organizations to identify integration opportunities and support incorporation of operational needs in transportation planning. For instance, the North Jersey Transportation Planning Authority, in coordination with New Jersey DOT, is developing an ITS Strategic Deployment Plan and TSMO Strategic Plan known as "The Connected Corridor" to serve as a shared vision by transportation agencies to more effectively plan, program, and operate the region's transportation system with operational strategies.43 The plan recommends a set of strategies to be applied at the Statewide, corridor, and local levels. For instance, strategies in the plan that could be explored within a subarea study include real-time monitoring of park-and-ride lots (i.e., number of available spaces), implementation of transit signal priority (TSP), updating signal timing parameters on State and local arterials on a more frequent basis, and expanding adaptive signal control operations.
  • Regional TDM plans - Some metropolitan areas have developed TDM plans, which can provide a basis for developing subarea-specific demand management efforts. For instance, the Atlanta Regional Planning Commission developed a Regional TDM Plan that defines a framework for developing and integrating TDM strategies into planning, project development, and system operations investment decision-making.44 The plan identifies key goals and strategies that are intended to be addressed with partners from Georgia DOT, the Georgia Regional Transportation Authority, local governments, and others.

Effectively planning for TSMO in subareas will build upon existing plans and programs and will ensure that subarea plans are compatible with, and take advantage of, these broader efforts. It is important to recognize that transportation activities within a jurisdiction or local area are part of a larger transportation network, and the policies and strategies being identified at the regional and State levels should help to inform the more geographically focused effort. At the same time, the plans, strategies, and operational relationships that will be effective within a subarea will reflect the specific travel needs, place type, constraints, and opportunities of the subarea.

GATHERING INFORMATION ON CURRENT AND FUTURE CONTEXT AND CONDITIONS

Gathering information about current transportation system performance and the future context is a key early step in the development of a subarea plan or strategy for TSMO (Figure 6). Data, both qualitative and quantitative, play a vital role in a performance-based approach to planning for TSMO.

This image is based on Figure 3 and calls out Step 2, of the approach for planning for transportation systems management and operations within subareas, which is Gathering Information on Current and Future Context and Conditions.
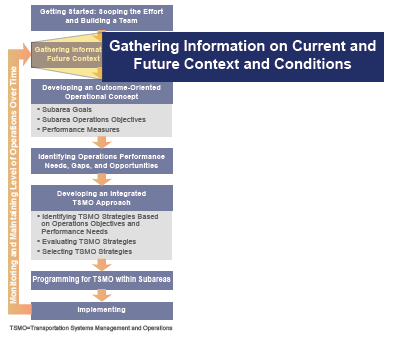
TSMO=Transportation Systems Management and Operations
Figure 6. Diagram. The "Gathering Information on Current and Future Context and Conditions" activity of the approach for planning for transportation systems management and operations within subareas.

Baseline information helps define the existing conditions in the subarea, including identification of challenges and problem areas. Data on expected changes in population, land use, and travel conditions also will help to inform understanding of potential future challenges that should be addressed during subarea planning. Data gathered during this phase also are a starting point for identifying opportunities for potential operations strategies that may be applied within the subarea and are used in analysis tools and evaluation to assess the effectiveness of these strategies. Given the critical role of data in a performance-based approach, gathering quality data and accurate information is imperative.

Often, a technical advisory committee or some other type of stakeholder partner group will play a key role in defining subarea objectives and in providing guidance on data and information gathering. Members with operations data expertise will play an important role in bringing forth operations data to inform the planning process as well as to explain data limitations.

Common sources of information include previous plans and studies; data sets on current and past system performance, including archived operations data; and forecasts of future conditions.

A review of existing studies, reports, and plans provides information about the broader planning context and may include recent multi modal transportation plans, pedestrian and bicycle plans, land- use and development plans, and infrastructure condition reports. These documents offer insight into the long-term, big-picture vision for the study area and transportation policies or practices. Policies or practices with implications for TSMO include the use of complete street design principles or road diets. Complete streets and road diets often involve the reduction or repurposing of traffic lanes and a greater focus on all road users (e.g., transit passengers, bicyclists, pedestrians). Existing studies, reports, and plans also can provide data on anticipated future conditions, such as changes in land use, population, jobs, transit services, and vehicle or passenger trips.

Additionally, information should be gathered on existing operational strategies being used in the subarea and the available ITS infrastructure. The organizational capabilities of operating organizations for TSMO is also an important component of understanding the existing context.

Information on current TSMO strategies and the capabilities of agencies in the subregion for advancing operations will provide key input when composing an integrated approach for TSMO in the region. In support of gathering information on current organizational capabilities, agencies can use the FHWA capability maturity frameworks (CMFs) to assess their current strengths and weaknesses in one of six TSMO areas:45

  • Road weather management.
  • Planned special events.
  • Traffic incident management.
  • Traffic management.
  • Traffic signal management.
  • Work zone management.

The CMFs are also designed to lead agencies in developing a targeted action plan for the program area.

Neighborhood Traffic Management Program: Centennial, Colorado

Centennial, Colorado, is a city in the Denver metropolitan region with a population of about 107,000. Over the years, the local government saw an increase in requests for neighborhood traffic mitigation, and developed the Neighborhood Traffic Management Program (NTMP) to help communities develop context-sensitive solutions for traffic calming improvements. The program's objectives are to: improve traffic safety on neighborhood streets by reducing speeding and cut-through traffic; foster pedestrian safety; efficiently allocate the use of public resources; and encourage citizen involvement in solutions to neighborhood traffic problems.

NTMP works closely with residents to develop neighborhood traffic mitigation plans. The program has identified a suite of mitigation tools appropriate for the neighborhood context. These tools include physical improvement and TSMO strategies, such as speed monitoring displays and upgrading traffic signage (restricted moving signs, truck restriction, etc.)

Neighborhood involvement is a critical component of the planning process. Projects are first identified when a citizen submits an application for consideration (this person serves as the neighborhood liaison for the project), and residents are engaged throughout the plan development process. The project liaison is responsible for demonstrating neighborhood support for the project through either an online survey, petition, or email/phone responses. Additionally, the NTMP holds a series of meetings with residents and other stakeholders to solicit input about the existing traffic issues and the range of strategies that are appropriate for the neighborhood context; and then later to solicit comments on the draft plan. These other stakeholders include resident organizations or districts, emergency service providers, nearby schools, parks and recreation facilities, nearby businesses, and other individuals or organizations that may be directly affected by the plan.

Source: City of Centennial, Neighborhood Traffic Management Program Manual, May 20, 2013. Available at: http://www.centennialco.gov/uploads/files/NTMP%20Manual%20052013_Revised_web.pdf.

Current Transportation System Components and Features

A range of information may be available on the current transportation system components and features within the study area. For instance, the data on the multi-modal transportation network in a subarea may include information on existing and planned infrastructure and services (e.g., highways, arterials and local streets, intersections and crosswalks, transit services, parking facilities, bicycle lanes and paths, and sidewalks). Moreover, beyond infrastructure and services, baseline information should document existing operational assets, partnerships, relationships, and programs that affect system operations. Examples include ITS components, ramp metering, traveler information systems, incident management programs, TSP, and TDM programs, among others. Documenting the current and planned application of these system components or strategies will be important as a baseline for understanding the context in the subarea.

Understanding Travelers

Understanding travel markets is important in defining both needs and possible strategies that will be effective. In a subarea, particularly an urban activity center, there are many different trip types and purposes, which may include commuting by employees coming from within and outside the area, recreational and shopping trips of residents and visitors, and freight deliveries. The mixture of vehicle types (e.g., buses, trucks, and automobiles) on the road and of different modes (e.g., walking, bicycling, transit, and driving) within the area often means that consideration needs to be given to the balance, tradeoffs, and identified priorities across different components of the multi- modal transportation system.

Understanding the unique characteristics of travelers in a subarea (i.e., recognizing how they access information and make travel decisions) will be useful in assessing potential strategies that may be targeted to specific types of travelers. Possible markets may include daily commuters traveling regularly to and from work or school, leisure travelers going to local destinations (running errands, entertainment, etc.), long-distance commuters or tourist travelers passing through, and freight or commerce vehicles transporting goods (see Table 2).

Table 2. Characteristics of travelers in subareas
  Local Commuter Liesure Traveler Long Distance/Interstate Traveler Freight/Commerce
Description Reside locally, travel regularly between work or school. Reside locally, traveling to local destinations (running errands, entertainment, recreation, etc.). Non-local travelers traveling to or through the subarea; less familiar with local conditions or alternative routes. Transportation of goods to local stores and businesses or to regional distribution centers.
Key Concerns Reliability of route and avoidance of traffic delays; information about transportation options. Avoiding traffic congestion; parking availability; information about transportation options. Notification of travel delays due to construction or incidents; access to stopover points (rest stop, gas stations, restaurants, etc.). Reliability of travel time for on-time delivery; availability of preferred routes (particularly those that can accommodate freight vehicles).
Possible Strategies Dynamic ridesharing; predictive traveler information; real-time transit and parking information; dynamic shoulder lane use. Dynamic parking reservation; real-time travel information; off-peak parking discounts. Real-time travel information; advance information to take alternative route well in advance to avoid congested area. Variable speed limits; queue warning; adaptive signal control.

Information on Current System Performance

In addition to information about the physical assets, subarea conditions, and traveler characteristics, data on current system performance are needed. Data on traffic volumes, peak hour volume, commute mode split, transit ridership, on-time transit performance, bicycle counts, and other data on travel patterns convey important information to assess needs. Level-of-service (LOS), which is a function of traffic volumes, traffic composition, roadway geometry, and the traffic control at the intersection, is widely used in traffic studies and reports. However, LOS does not capture the source or extent of congestion, especially non-recurring congestion (due to traffic incidents, work zone, bad weather, special events, etc.). Better data on actual travel speeds and delay in a subarea can be critical to understanding existing conditions. To incorporate operations strategies into the subarea plan, a more detailed account of the causes and impacts of congestion, as well as performance data across all modes, is helpful.

Archived operations data from ITS programs can be used to assess important operational conditions, including system reliability, on-time transit performance, and the role of specific factors, such as weather conditions, on traffic congestion or traveler delay.

Archived travel time data forms the basis for understanding a wide variety of performance metrics (e.g., congestion, reliability, and freight mobility). Chapter 5, Toolbox for Effective TSMO Planning, contains additional information on archived operations data.

Safety data are useful for identifying challenges and problem areas that may be addressed by operations strategies. Types of safety data include incident data such as fatalities, injuries, and property damage; crash data by type including rear-end, left-turn, etc.; weather conditions; light conditions; and the spatial distribution of crashes.

Questions to Gather Stakeholder Input

Below are sample questions to facilitate a dialogue with stakeholders and the public to capture input about incorporating operations in subarea planning:

  • How do you travel in the subarea? Where do you go? What problems do you encounter?
  • What is important to you, to your neighborhood, to the local area, and to the region (e.g., transportation, community, environment) in the subarea?
  • Do you have any comment on the problems and opportunities that have already been identified for the subarea?
  • How would improving the subarea through working with a private developer and considering options, such as parking pricing impact your support of the solutions?

Source: Linking Planning and Operations Application, PlanWorks, Federal Highway Administration. Available at: https://fhwaapps.fhwa.dot.gov/planworks/.

Information about Future Conditions and Contexts

Information about anticipated conditions and contexts is important as well. This includes forecasted data about socio-economic factors (e.g., population, demographics, etc.) as well as the planned land uses and level of development for the subarea. Because many subarea plans focus on land use, zoning, and urban design, understanding these future plans and contexts is critical to developing compatible and effective operations strategies. For instance, if an urban activity center or transit station area plan is designed to foster increased transit-oriented development and multimodal choices —through land-use and infrastructure strategies including higher density, mixed-use development; implementation of a street grid system where one currently does not exist; and improved bicycle and pedestrian crossings—this future context needs to be the basis for planning effective TSMO strategies. In this case, TSMO strategies should support the future vision of the subarea by incorporating operational strategies that support safe bicycle and pedestrian movement, increase transit reliability, and encourage use of non-automobile modes rather than strategies simply to improve traffic flow. Travel demand modeling, including simulation modeling, will provide important information on anticipated traffic problems or potential multimodal conflicts. Off-model tools and analysis (e.g., analyses of mode shifts at employment sites due to TDM programs) also will help in assessing anticipated future system performance and the role of TSMO strategies.

Stakeholder and Public Engagement

In addition to previous studies and information on current and future conditions, input from stakeholders and the public is critical-specifically, their opinions about and preferences for the future of the subarea. The public and stakeholders should play a key role in defining a vision, goals, and objectives for the subarea as well as the performance measures that will be used to assess system performance. In urban areas, there often are tradeoffs to be made in terms of performance of the system in relation to passenger vehicles, public transit, bicycling , and walking, and the public and stakeholders should play a key role in defining and prioritizing objectives. The public, for instance, may be willing to accept lower average motor vehicle speeds to improve the safety and accessibility of pedestrian and bicycle activity. While optimizing system performance along urban and suburban highway subareas might involve diverting heavily congested freeway traffic to parallel arterials, there may be community concerns about the impacts on accessibility in neighborhoods, which need to be considered. Consequently, it is important to engage the public and stakeholders in clearly defining goals and operations objectives and in articulating priorities and values.

Methods for gathering information from stakeholders and the public include conducting qualitative research (e.g., interviews, focus groups, and workshops) or quantitative research (e.g., polls, surveys, etc.), as well as hosting citizens' panels and town hall meetings. Planning tools like scenario modeling and visualization techniques can be used in subarea studies. These public participation tools help communities and stakeholders better understand the interactions among different planning issues in an area (e.g., transportation, housing, energy use, and the environment) and the range of possible outcomes. A comprehensive approach should be used for stakeholder public engagement to capture input from all affected parties within the subarea, including those traditionally underserved by the existing transportation system (e.g., low-income communities, persons with disabilities, minorities, etc.). Engaging with stakeholders and the public early in the process is important, and it presents an opportunity to raise awareness about operations and the role that operational strategies can play. Educating stakeholders and the public about operational strategies will make them better-informed participants throughout the planning process.

Once the information-gathering process is complete, there is solid understanding of the needs, deficiencies, and opportunities to address in the next step: developing an operational concept.

DEVELOPING AN OUTCOME-ORIENTED OPERATIONAL CONCEPT

Effective TSMO involves not only providing highway and transit infrastructure for movement of people and freight but also identifying and applying efficient ways of operating these systems to support mobility, reliability, and safety. Consequently, while subarea planning may involve consideration of, or focus on, certain types of infrastructure improvements (e.g., streetscaping, bicycle and pedestrian infrastructure, etc.), the planning process should focus on desired outcomes for travelers and communities, including outcomes related to how the transportation performs both in typical peak periods and non- peak periods as well as in relation to non recurring issues such as adverse weather and emergencies (Figure 7).

This image is based on Figure 3 and calls out Step 3, of the approach for planning for transportation systems management and operations within subareas, which is Developing an Outcome-Oriented Operational Concept.
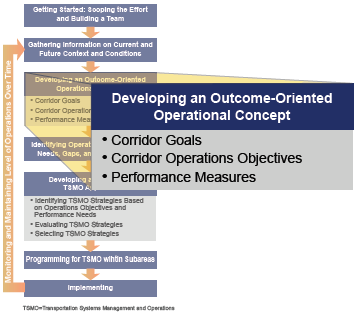
Figure 7. Diagram. The "Developing an Outcome-Oriented Operational Concept" activity of the approach for planning for transportation systems management and operations within subareas.

An outcome-oriented operational concept provides the framework for developing and evaluating options that reflect local and regional values, including mobility, air quality, sustainability, livability, safety, security, economic activity, accessibility, and others. The relative priority of these considerations may vary depending on the context and needs of travelers, residential communities, businesses, and other stakeholders in the subarea.

Examples of transportation outcomes commonly used in subarea studies include safety, mobility, and non- motorized accessibility. Other outcomes may include economic vitality, community livability, environmental quality, and other community goals.

Planning for TSMO involves considering a broad range of issues and outcomes associated with how transportation systems are managed and operated. For instance, a subarea plan with a greater focus on TSMO may include specific discussion of reliability as an outcome. In addition to general travel time, travelers and freight shippers are often concerned about the variability in travel time from day to day or hour to hour. If it typically takes 20 minutes to travel from one side of town to the other off-peak, and 30 minutes during peak congestion, travelers can plan for the extra travel time. However, if travel times are highly unpredictable—sometimes 30 minutes during rush hour but other times 60 minutes or more—this creates significant problems for making tightly scheduled appointments or delivery times. Studies show that travelers and freight shippers strongly value reliability in travel time; therefore, this is an important issue. High variability in travel times often is caused by traffic incidents, poor weather conditions, special events, and construction work zones, which can be considered in the context of subareas.

Substantial experience in TSMO planning at the regional level shows that rather than just defining goals and strategies, a key foundation for advancing TSMO in planning is to define an outcome- oriented operational concept that brings together goals; specific, measurable operations objectives; and performance measures that are focused on outcomes important to the transportation system users (Figure 8). In a regional context, use of operations objectives and performance measures support consideration of and selection of TSMO strategies for the long-range transportation plan (LRTP) and transportation improvement program (TIP).46 Similarly, areawide operations objectives and performance measures help to focus attention on system performance outcomes within a subarea or its key components (e.g., transit services, intersections, and roadways) and are a key element to support consideration of TSMO strategies. Developing an outcome-oriented operational concept is, by nature, an iterative process that involves developing an understanding of local community and traveler values that affect or influence priorities in the subarea, and translating those priorities into observable and measurable outcomes that guide development of outcome-oriented objectives.

The outcome-oriented operational concept describes, at a high level, how the subarea should operate to realize the desired outcome(s). The operational concept does not specify strategies to be implemented. It will likely draw upon a collection of individual and complementary strategies in response to the operations objectives for the subarea and an assessment of the costs and benefits of each. In some locations, active transportation and demand management (ATDM) concepts (e.g., active traffic management, active demand management, and active parking management)47 may prove to be attractive strategies; in others, other strategies that rely less on real-time data may prove effective (e.g., improvements in TIM, seamless integration of public transportation alternatives, and better integration of non-motorized alternatives). These and other concepts can be incorporated into an overall operational concept to be included within a subarea plan.

The operational concept can be formalized within the framework of goals, objectives, and performance measures. The goals and objectives translate the values and priorities into statements that describe what is to be achieved with respect to transportation in the subarea that support higher level regional goals. The goals for the subarea should link to high-level regional goals and then lead to objectives, expressed in measurable terms that can be used to help develop and evaluate strategies for achieving the objectives.

Note that, in developing an outcome-oriented operational concept, specific solutions (strategies and tactics) are not considered, except to the extent that they may inform planners and operators about what is possible within available or anticipated technology solutions, legal and institutional arrangements, and fiscal constraints. Otherwise, the goals and objectives that characterize the operational concept should be open to new ideas about how to achieve the objective until after a range of feasible strategies and tactics is identified and evaluated using performance measures that relate directly to the objectives.

Operations Goals

Operations goals are the high-level statements of what transportation in the subarea would look like if it reflects the needs, values, and priorities of the key stakeholders and transportation providers that use, depend upon, or operate transportation facilities and services.

The City of Salem, Oregon developed a transportation plan, which contains at least one operations goal. The focus of the Salem Transportation System Plan is to maximize mobility through investments in the city's multi-modal transportation system. The plan is comprised of individual elements that address various modes of travel or other aspects of the transportation system. One of these sections is the "Transportation System Management Element," which identifies ways to maximize the capacity of the street system and reduce demand on it, using TSMO strategies that are typically low cost and have a low impact to surrounding communities. The Transportation System Management Element provides an operations goal, objectives, and policies for utilizing system management techniques. The operations goal is:

"To maximize the efficiency of the existing surface transportation system through management techniques and facility improvements."48

Other examples of high-level goals that could be adapted to more specific aspects of planning for subarea management and operations are provided in FHWA's Advancing Metropolitan Planning for Operations: An Objectives-Driven, Performance-Based Approach - A Guidebook.49

Specific Outcome-based Operations Objectives

The high-level goals are the starting point for developing operations objectives, which are the basis for subarea TSMO planning. Operations objectives define desired outcomes for the subarea in relation to how the transportation system will perform. Operations objectives go beyond broad statements of goals, which often are loosely defined and difficult to assess. Operations objectives are specific, measurable statements developed in collaboration with a broad range of partners who have interests or who are affected by subarea transportation systems performance. They may be multi-jurisdictional in nature if the subarea of interest extends beyond or affects more than a single jurisdiction. Operations objectives generally lead directly to measures of performance that can be used to assess whether or not the objective has subsequently been achieved.

Operations objectives should be specific, measurable, agreed-upon, realistic, and time-bound (SMART):

  • Specific - The objective provides sufficient specificity to guide formulation of viable approaches to achieving the objective without dictating the approach.
  • Measurable - The objective facilitates quantitative evaluation, saying how many or how much should be accomplished. Tracking progress against the objective enables an assessment of effectiveness of actions.
  • Agreed - Planners, operators, and relevant planning participants come to a consensus on a common objective. This is most effective when the planning process involves a wide range of stakeholders to facilitate collaboration and coordination among all parties that use or manage the subarea of interest.
  • Realistic - The objective can reasonably be accomplished within the limitations of resources and other demands. The objective may require substantial coordination, collaboration, and investment to achieve. Factors, such as land use, also may have an impact on the feasibility of the objective and should be taken into account. Because how realistic the objective is cannot be fully evaluated until after strategies and approaches are defined, the objective may need to be adjusted to be achievable.
  • Time-Bound - The objective identifies a timeframe within which it will be achieved (e.g., "by 2017").
Screencapture of the cover of the Advancing Metropolitan Planning for Operations Desk Reference.
Figure 8. Image. Cover of Federal Highway Administration's Advancing Metropolitan Planning for Operations Desk Reference.

Specifically, an operations objective identifies targets regarding a particular aspect of subarea performance, such as traffic congestion, travel time reliability, emergency response time, or incident response. By developing SMART operations objectives, system performance can be examined and monitored over time.

Examples of operations objectives that may be applicable or could be adapted to subarea management and operations are provided in Federal Highway Administration's (FHWA) Advancing Metropolitan Planning for Operations: An Objectives-Driven, Performance-Based Approach - A Desk Reference (Figure 8).

By including operations objectives that address system performance issues (e.g., recurring and non-recurring congestion, emergency response times, connectivity among modes, safety, and access to traveler information) rather than focusing primarily on system capacity, the planning effort for a subarea will elevate operations to play a more important role in investment planning, addressing both short-range and long-range needs.

While outcome-oriented objectives are preferred because they are most closely related to the level of service (LOS) provided to systems users, in some cases, outcomes are difficult to measure or observe directly. Outcome-oriented objectives focused on outcomes to the user include travel times, travel time reliability, and access to traveler information. The public cares about these measures, and in many areas, data may be available to develop specific outcome-based operations objectives.

In cases where developing outcome-based objectives is difficult, a planning study may develop operations objectives that are activity-based and support desired system performance outcomes. For example, it may not be possible to develop a specific objective related to incident-based delay experienced by travelers in subarea if data are unavailable for this type of delay. However, it may be possible to develop an objective that relates to incident response times, which may be more easily established and measured.

Other examples of activity-based objectives include the percentage of traffic signals re-timed, the number of variable message signs deployed, and the share of bus stops with real-time transit information. Although these objectives are not as ideal as outcome-based objectives because they tend to focus on specific strategies or approaches, they may serve as interim objectives until more outcome-based objectives can be established and measured. Working together to develop the objectives themselves may help to elevate management and operations discussions among planners and operators and lead to initiatives to collect additional data.

One technique for organizing outcome-oriented and activity-based objectives is to develop an objectives tree that structures objectives in a hierarchical manner, with each top-level objective supported by lower level sub-objectives. The lower level objectives, taken together, identify what must be achieved to realize the high-level objectives; the high-level objectives give the purpose for achieving the lower level objectives. In many cases, the lower level objectives will be activity based objectives that relate to functions that must be performed to achieve high-level outcome-oriented objectives. Figure 9 illustrates how lower level activity-based objectives support higher level outcome-oriented objectives, all acting in support of goals for the subarea.

Complex flow diagram illustrates how management and operations strategies can be used to support both outcomes-oriented and activity-based objectives to reach subarea goals.
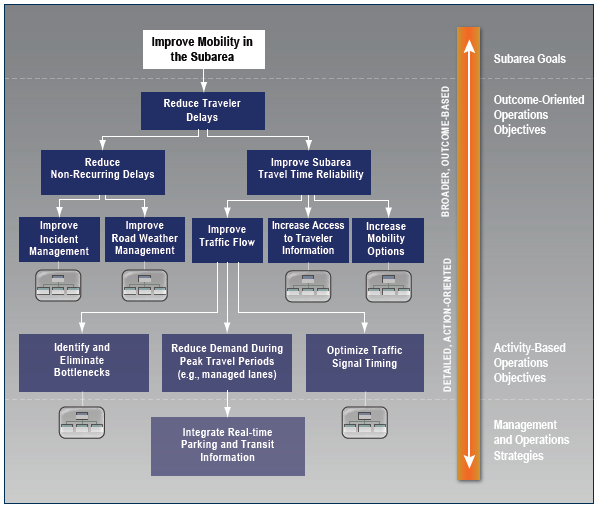
Figure 9. Diagram. Illustrative objectives tree for subarea-based transportation systems management and operations.

Performance Measures

One of the key attributes of SMART objectives is that they are measurable. Performance measures are associated with operations objectives and provide a measurable basis for:

  • Understanding existing performance, including performance gaps.
  • Assessing future projected gaps in performance.
  • Supporting assessment of, and comparisons of, potential strategies to meet objectives.

The idea that "what gets measured gets managed," recognizes that performance measurement focuses the attention of decisionmakers, planners, stakeholders, and the public on important characteristics of the transportation system. Developing performance measures involves considering:

  • How do we want to define and measure progress toward a certain operations objective? For instance, is transit ridership a key metric that is important for assessing livability and access? Or would bicycle/pedestrian activity be a better measure? Or do both provide value?
  • What are the implications of selecting a specific measure? For instance, if travel speeds are a key measure of performance in a subarea, this would imply different strategies and results than focusing on improving reliability of travel times. Using a measure focused on person- travel rather than vehicle-travel might lead toward strategies that give more priority to high-occupancy modes (e.g., like public transit or high-occupancy vehicle (HOV) lanes) than to those driving alone.

It is important to recognize that there are tradeoffs among different goals and objectives (e.g., traffic throughput, increasing transit ridership, and enhancing pedestrian and bicycle access); therefore, defining an appropriate and balanced set of performance measures for a subarea is important.

Performance measures are indicators of how well the transportation system is performing and are inextricably tied to operations objectives. A range of performance measures may come from developing operations objectives. The performance measures selected should provide adequate information to planners, operators, and decision makers on progress toward achieving their operations objectives. However, this is an iterative process as operations objectives may be refined once performance measures are developed and baseline data have been collected.

Performance measures should be developed based on the individual needs and resources of each agency that provides services within the subarea. For example, transit agencies typically use a number of measures that are of interest to their customers, such as on-time performance, average passenger load, and total ridership. Local DOTs typically use measures of mobility such as facility LOS, travel time, and travel delay. These performance measures help planners focus on the day-to-day experience for their users. This provides important balance in settings where planners have focused on long-term development in the subarea. With greater focus on the day-to-day operations, planners appreciate the issues faced by system operators and travelers. The result is that mid- and long-term planning now reflect greater consideration of operations and the associated investment needs within the subarea.

Some examples of performance measures likely to be associated with subarea operations objectives are shown in Table 3. These performance measures are primarily drawn from the FHWA document, Advancing Metropolitan Planning for Operations: The Building Blocks of a Model Transportation Plan Incorporating Operations - A Desk Reference.50

Table 3. Illustrative performance measures to guide subarea transportation systems management and operations planning.
Performance Area Illustrative Performance Measures
Travel Time: Travel time measures focus on the time needed to travel along a selected portion of the subarea, and can be applied for specific roadways, subareas, transit lines, or at a regional level. At the subarea level, travel time may be a function of mode choice. Also, "travel time" may need to take into account both travel time on major roadways and travel time on local surface streets and in neighborhoods.
  • Average travel time, which can be measured based on travel time surveys.
  • Average travel speeds, which can be calculated based on travel time divided by segment length or measured based on real-time information collection. (Note that traffic calming measures may be implemented to avoid excessive travel speeds in some subareas).
  • Travel time index: the ratio of peak to non-peak travel time, which provides a measure of congestion.
Congestion Extent: Congestion measures can address both the spatial and temporal extent (duration). Depending on how these measures are defined and data are collected, these measures may focus on recurring congestion or address both recurring and non-recurring congestion. In a subarea, congestion may be a sign of economic activity; thus measures of congestion should take this into account (e.g., reduced congestion may signal less economic activity rather than more effective system performance).
  • Lane miles of congested conditions (defined based on volume to capacity (V/C) ratio, level of service (LOS) measures, or travel time index).
  • Number of intersections experiencing congestion (based on LOS).
  • Percent of roadways congested by type or roadway (e.g., freeway, arterial, collector).
  • Average hours of congestion per day.
  • Share of peak period transit services experiencing overcrowding.
Delay: Delay measures take into account the amount of time that it takes to travel in excess of travel under unconstrained (ideal or free-flow) operating conditions, and the number of vehicles affected. These measures provide an indication of how problematic traffic congestion is, and can address both recurring and non- recurring congestion- related delay.
  • Vehicle-hours of recurring delay associated with population and employment growth.
  • Vehicle-hours of nonrecurring delay associated with incidents, work zones, weather conditions, special events, etc.
Incident Occurrence/Duration: Incident duration is a measure of the time elapsed from the notification of an incident until the incident has been removed or response vehicles have left the incident scene. This measure can be used to assess the performance of service patrols and incident management systems. Incident occurrence also can be used to assess the performance and reliability of transit services.
  • Median minutes from time of incident until incident has been removed from scene.
  • Number of transit bus breakdowns.
  • Average number of transit rail system delays in excess of X minutes.
Travel Time Reliability: Travel time reliability measures take into account the variation in travel times that occur on roadways and across the system.
  • Buffer time, which describes the additional time that must be added to a trip to ensure that travelers will arrive at their destination at, or before, the intended time 95 percent of the time.
  • Buffer time index, which represents the percent of time that should be budgeted on top of average travel time to arrive on time 95 percent of the time (e.g., a buffer index of 40 percent means that for a trip that usually takes 20 minutes, a traveler should budget an additional 8 minutes to ensure on-time arrival most of the time).
  • Percentage of travel when travel time is X percent (e.g., 20 percent) greater than average travel time.
  • Planning time index, defined as the 95th percentile travel time index.
  • 90th or 95th percentile travel times for specific travel routes or trips, which indicates how bad delay will be on the heaviest travel days.
  • Percentage of weekdays each month that average travel speed of designated facilities fall more than X MPH below posted speed limit during peak periods.
Transportation Demand Management (TDM): Examines travel demand as well as the impact of strategies to manage that demand.
  • Awareness - Portion of potential program participants aware of a TDM program.
  • Utilization - Number or percentage of individuals using a TDM service or alternate mode.
  • Mode split - Proportion of total person trips that uses each mode of transportation.
  • Vehicle Trips or Peak Period Vehicle Trips - The total number of private vehicles arriving at a destination.
Person Throughput: Examines the number of people that are moved on a roadway or transit system. Efforts to improve this measure are reflected in efforts to improve the flow of traffic, increase high occupancy vehicle movement, or increase transit seat occupancy on transit.
  • Peak hour persons moved per lane.
  • Peak hour persons moved on transit services.
  • Number of bicycle trips completed for other than recreational purposes.
Customer Satisfaction: Examines public perceptions about the quality of the travel experience, including the efficiency of system management and operations.
  • Percent of the population reporting being satisfied or highly satisfied with mobility and accessibility options and conditions, including non-motorized options
  • Percent of the population reporting being satisfied or highly satisfied with access to traveler information, including the media though which information is disseminated (e.g., smartphone apps, message boards).
  • Percent of the population reporting being satisfied or highly satisfied with the reliability of transit services.
Availability of or Awareness of Information: These measures focus on public knowledge of travel alternatives or traveler information.
  • Percent of surveyed population aware of travel alternatives and related traveler information, including non-traditional modes (e,g., bicycle, car or ride-sharing options).
Availability of and Accommodations for Travel Options: These measure focus on the extent to which travel choices are available and accommodated in the way the transportation system is implemented and operated.
  • Accessibility of public transportation services within the subarea (e.g., among major centers of commerce or employment within the subarea).
  • Access to and accommodations for car or ride- sharing services (e.g, Zipcar™ or Uber™) that minimize conflicts with other vehicles.
LOS = level of service. TDM = transportation demand management. MPH=miles per hour.

In summary, the performance measures tie directly to the operations objectives, provide the criteria for evaluating strategies and tactics for improving subarea performance, and direct the gathering of data necessary to identify and prioritize needs and gaps. In summary, the performance measures (1) tie directly to the operations objectives, (2) provide the criteria for evaluating strategies and tactics for improving subarea performance, and (3) direct the gathering of data necessary to identify and prioritize needs and gaps.

IDENTIFYING OPERATIONS PERFORMANCE NEEDS, GAPS, AND OPPORTUNITIES

Gathering and analyzing data for performance measures is critical to identifying gaps between desired outcomes (objectives) and current conditions, and in initial identification of potential opportunities for improvements (Figure 10).

This image is based on Figure 3 and calls out Step 4, of the approach for planning for transportation systems management and operations within subareas, which is Identifying Operations Performance Needs, Gaps, and Opportunities.
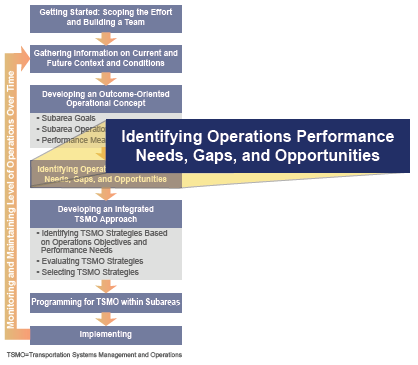
Figure 10. Diagram. The "Identifying Operations Performance Needs, Gaps, and Opportunities" activity of the approach for planning for transportation systems management and operations within subareas.

Often a key step following the definition of performance measures is to define scenarios, or to conduct a scenario planning exercise as a basis for understanding current performance gaps and potential opportunities. Operational scenarios should be defined by stakeholders in the subarea and may include (but are not limited to):

  • Normal or daily scenario - to explore recurring - to explore recurring travel patterns for private vehicles, transit, bicycle, pedestrian, goods delivery, service vehicles, school buses, parking, etc., taking into account both mobility-related activities and other community (or subarea) factors that are affected by mobility patterns (e.g., effects on access to businesses, parks, schools, hospitals, neighborhoods).
  • Incident scenario - to address major or minor incidents within the subarea that will affect multimodal mobility, in order to develop operational plans for how agencies work together and respond to these incidents. Note that these may be transportation-related incidents or other incidents that affect mobility (e.g., building fires, law enforcement actions, hazardous material release).
  • Planned event scenario - to address a major sporting event, festival, entertainment venue, major convention, or activity that attracts large crowds to a major venue within the subarea and creates an atypical level activity and resulting congestion for pedestrians, vehicles, transit riders, etc.
  • Weather-related, emergency, or evacuation scenario - to consider unplanned events that may require more dynamic decision making and coordination among stakeholders within the immediate subarea and with agencies and jurisdictions in surrounding areas.
  • Major work zone scenario - to address major construction or reconstruction projects in roadways, utilities, or building sites that limit or significantly delay transportation services and related operations in the subarea and require coordination with project planning and construction to minimize impacts on travelers, businesses, and the local community.

By defining scenarios, the participants in the subarea often can identify existing gaps, performance needs, as well as potential opportunities for improvements. Moreover, discussions to identify gaps aid planners and operators in clarifying and documenting problems within the subarea and highlight opportunities for improving mobility and related functions in the subarea. In many cases, performance data are available that clearly demonstrate where problems exist and need attention, investment, and priority in the planning process and may be tied to specific types of situations or scenarios where performance improvements would be most important.

Planners and operators must be cautious in depending on performance measures alone to identify gaps and opportunities, especially activity-based performance measures, since the performance measures may be specific to existing systems and may focus attention on improving existing operations strategies rather than considering alternatives that take advantage of new operational concepts, new technology, new institutional arrangements, and new or emerging user expectations.

For example, if the performance measures suggest the need to reduce delay on surface streets in the subarea by increasing average speeds, planners and operators may be tempted to focus on strategies such as adaptive signal controls that improve the flow of vehicles by reducing the delays at traffic signals. While this may appear to be attractive, other stakeholders may see this as a deterrent to business located in the area or to access and egress for neighborhoods in the subarea. As a result, other measures should also be considered (e.g., traffic circles or other approaches for managing flow that control speed, provide access, and avoid unnecessary delay). This does not mean that adaptive signal controls are inappropriate, only that performance measures, if they do not take context into account, can result in focusing on the "efficiency" of current approaches rather than in how outcome-oriented objectives are achieved.

In the end, the performance measures point toward deficiencies in achieving goals and objectives for the subarea and can also be helpful in identifying opportunities for improving subarea performance taking into account both mobility and other important considerations.

DEVELOPING AN INTEGRATED TRANSPORTATION SYSTEMS MANAGEMENT AND OPERATIONS APPROACH

Once the TSMO planning team has agreed upon operations objectives for what the subarea should look like with respect to mobility and identified the performance gaps, it can begin to identify a system of TSMO strategies that will be implemented in the subarea to reach to the operations objectives (Figure 11).

This system of TSMO strategies forms an integrated TSMO approach to improving performance in the subarea. Taking into account mobility and related functions the selected TSMO strategies should work together in the context of the subarea; strategies should not be selected and implemented in isolation from each other and related subarea needs. Planning for an integrated set of strategies allows planners and operators to leverage synergies among strategies. For example, the needs of first responders to access traffic incidents or other life-threatening incidents in the area should be considered when setting up work zones, including utility work zones that affect local streets; and, likewise, traffic incident management plans may need to consider pre- designation and communication of alternate routes to manage vehicles in areas of reduced capacity due to work zones.

This image is based on Figure 3 and calls out Step 5, of the approach for planning for transportation systems management and operations within subareas, which is Developing an Integrated TSMO Approach.
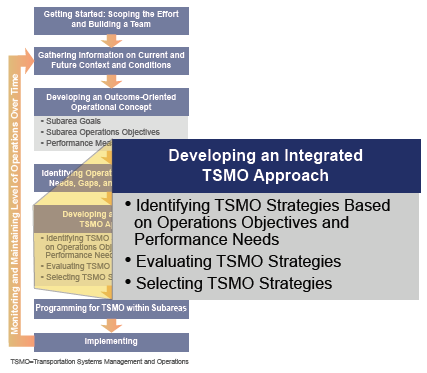
Figure 11. Diagram. The "Developing an Integrated TSMO Approach" activity of the approach for planning for transportation systems management and operations within subareas.

Key Considerations in Developing an Integrated Transportation Systems Management and Operations Approach

Ensuring a System Solution Rather than "Stand Alone" Activities

The traditional approach to transportation operations has traditionally involved individual agencies (State DOTs, local transportation agencies, toll authorities, transit service providers, etc.) managing their own assets and services, such as freeways, arterials, toll roads and bridges, and transit services. Yet, increasingly, a more effective and efficient approach is being used that involves a more holistic approach to managing operations by viewing the transportation facilities as a system instead of a group of stand-alone assets. Under this approach, operators work together to make investments and real-time operations decisions to effectively shift travel demand across modes and routes to manage congestion, improve safety, and enhance system reliability (i.e., identifying operations strategies that enhance walkability and bikeability by minimizing multi- modal conflicts in areas with high concentrations of pedestrians or bicyclists).

Moving Toward Active and Dynamic Transportation Systems Management

The use of operations strategies supports proactive and dynamic management of the transportation system, in which system performance is continuously assessed and the system is managed through real-time implementation of adjustments (via traveler information, adjustments to signal timing, ramp metering, or other freeway operations) to achieve performance objectives (e.g., travel time reliability, person throughput, incident management, etc.). This approach requires collaboration, engaging partners to help influence travel choice and behavior within the subarea. Travel choice and behavior are influenced through active demand management, active traffic management, and, in urban areas, through active parking management. Technology and innovation are critical to active and dynamic transportation system management, supporting this data-driven approach implemented through information technology systems.

Focusing on the Traveler, Rather than Just Vehicles

A customer-focused and place-based perspective serves as the underpinning of an integrated approach to subarea management; rather than looking at enhancing vehicle throughput, this approach begins by examining traveler mobility needs and explores the most effective ways to meet those needs in a manner that is appropriate for the characteristics of the subarea (land-use, community aesthetics, etc.). This approach sets the context for developing a more efficient system for the end user that is well-integrated into the subarea. The TSMO approach is based on a fundamental understanding of how travelers decide which mode to use, what time to travel, which route to take, and at what time. Selecting operations strategies also requires segmentation of the travel market that differentiates among the various types of travelers (including commuters, non-commuter travelers, and freight movement), and understanding their travel behaviors, needs, and challenges to accurately inform the selection and implementation of operations strategies.

Considering Community Values and Neighborhoods

Transportation plays a key role in mobility, but is more than just about moving people and goods. The transportation network contains lifelines for communities, often linking neighborhoods, businesses, and jobs, and can serve as vibrant public spaces. A subarea's transportation system should reflect the character and values of the surrounding community. Integrating operational strategies into subarea planning is not a uniform approach; the set of strategies selected for a subarea should be customized and tailored to respond to the unique issues, challenges, and opportunities present. Therefore, successful TSMO integration into the planning process requires engaging the partners (the various agencies that operate within the subarea), as well as community stakeholders and the general public.

Recognizing Resource Constraints

Although TSMO strategies are typically low cost, especially in comparison to expansion projects, a successful approach to implementing operational strategies is including them as part of an integrated approach within a broader project or plan. In many cases, lower-cost solutions can be implemented, or TSMO strategies can be implemented over time, in phases, to advance operations improvements in stages over time. When prioritizing TSMO strategies for deployment, benefit- cost analysis, stakeholder and public input, and exploring the logical phasing of strategies are all useful analysis methods.

Developing an Incremental Approach to Transportation Systems Management and Operations

Transportation agencies engage in TSMO activities at varying degrees of complexity. For some agencies, a basic traffic signal system meets the management needs of its transportation network, while other agencies rely on a set of advanced and integrated TSMO strategies to meet the mobility needs of the community. In either case, planning for TSMO allows agencies to advance operational strategies in a measured, organized fashion, whether in a section of the subarea or throughout it.

A key distinction in implementing TSMO strategies is that installation is just the starting point. Agencies must be prepared to expend the necessary resources to operate and maintain a collection of TSMO investments. The most effective TSMO activities are differentiated not by budgets or technical skills alone, but by the existence of critical processes and institutional arrangements tailored to the unique features of TSMO applications. Applying an incremental approach to TSMO strategies in a subarea is a clearer path to successful implementation by allowing time to gain experience with the strategy and institute operational processes.

One of the current areas of research is in analytical tools that support consideration of multiple TSMO strategies, and it is expected to provide more support in the future to developing an integrated TSMO approach. Currently, there are limited options for quantitatively examining the impacts of one TSMO strategy on another. The sections below describe the main activities necessary for developing an integrated approach to TSMO in a subarea.

Identifying Transportation Systems Management and Operations Strategies Based on Operations Objectives and Performance Needs

TSMO strategies that could be implemented to address causes of the shortfalls in performance or gaps can be identified in several ways. This section provides example approaches for identifying TSMO strategies based on operations objectives and performance needs in a subarea. FHWA has developed some basic mappings between goals or objectives and TSMO-related strategies, but this has occurred primarily at the State and regional levels are where practitioners look to match strategies to needs within a specific context.

FHWA guidance on livability and sustainability recommends a "balanced approach" to identifying TSMO strategies. This is consistent with planning for operations in a subarea, where mobility objectives and other subarea objectives should be considered together. More specifically:

  • Maximizing the livability and sustainability benefits of M&O [management and operations] strategies requires a balanced approach to M&O. Not all M&O strategies support livability and sustainability outcomes equally. For example, traffic signals that prioritize vehicle traffic flow but do not consider the mobility and access needs of pedestrians, bicycles, and transit can actually work against livability and sustainability principles. In contrast, signal timing plans and roundabouts that support livability and sustainability objectives will provide improved mobility in a way that balances vehicular and bus traffic, pedestrians, and bicycle access, in order to support community vitality, safety, and the environment.
  • A balanced approach to M&O provides a framework that helps practitioners consider tradeoffs, better understand potential impacts on livability and sustainability, and avoid unintended results. Most importantly, this framework encourages practitioners to evaluate transportation system operations from a variety of perspectives and consider how the system can be optimized in multiple ways to achieve different performance measures and goals.51

The identification of TSMO strategies in a subarea results from a consideration of multiple contextual factors such as land use, network patterns, and available transportation modes. Figure 12 provides a sample of contextual factors for subareas and the relevant operating organizations that are important to consider when selecting TSMO strategies.

Sample contextual factors to consider when selecting transportation system management and operations strategies for subareas include: geographic extent, development density, land uses, subarea transportation facilities, network pattern, modes, and institutional capability.
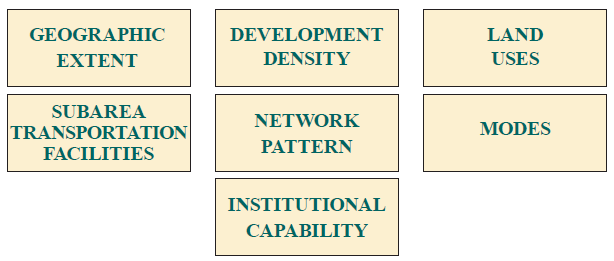
Figure 12. Diagram. Sample of contextual factors to consider when selecting transportation system management and operations strategies for subareas.

As mentioned previously, the City of Salem, Oregon developed the Salem Transportation System Plan, which included specific goals and objectives that helped identify transportation system management and transportation demand management strategies that will achieve those objectives. For example, the transportation system management strategies fall into one of the following categories, which are aligned with the city's objectives:52

  • Traffic management and channelization.
  • Intersection modification and widening.
  • Access management.
  • Improved traffic control devices.
  • On-street parking management.

One of Salem's goals is "To maximize the efficiency of the existing surface transportation system through management techniques and, facility improvements."53 The associated objectives and related operations strategies (or policies) for this goal are:

  • Objective Number 1 - A system of traffic control devices maintained and operated at an optimal LOS and efficiency consistent with existing funding levels.
    • Policy 1.1 Improve the Efficiency of the Signal System.
    • Policy 1.2 Maintain Signal System Operations.
    • Policy 1.3 Maintain Clear and Effective Signs and Pavement Markings.
  • Objective Number 2 - To maximize the effective capacity of the street system through improvements in physical design and management of on-street parking.
    • Policy 2.1 Giving Intersection Improvements Priority.
    • Policy 2.2 On-street Parking Management.
    • Policy 2.3 Bus Bays on Arterial Streets.
  • Objective Number 3 - To increase street system safety and capacity through the adoption and implementation of access management standards.
    • Policy 3.1 Development and Adoption of Access Management Standards.
    • Policy 3.2 Incorporate Access Management into Arterial Street Design.
    • Policy 3.3 Access Management Projects.
  • Objective Number 4 - To actively manage the operation of the surface transportation system during peak travel periods.
    • Policy 4.1 Real-time System Management.

The objectives and policies are linked to specific transportation system management strategies within each of the categories listed above, including, for example:

  • Traffic management and channelization.
    • One-way streets.
    • Reversible traffic lanes.
    • High occupancy lanes on arterials.
    • Bus bays ("pull outs").
    • Improved signs and markings.
  • Intersection widening and modification.
    • Roadway alignment at intersections.
    • Intersection widening.
    • Turn controls.
    • Grade separation at major intersections.
  • Access management.
    • Arterial access management.
  • Improved traffic control devices.
    • Traffic signal improvements.
    • Improved signs and markings.
    • Arterial surveillance and management.
  • On-street parking management.
    • Removal of parking.

Each of the projects and strategies in the plan is linked to a particular location, priority, cost estimate, and lead agency within the Salem city government.

A similar approach was taken for transportation demand management projects and strategies, linking strategies to a goal and related objectives. The overarching goal is to "reduce the demands placed on the current and future transportation system by the single-occupant vehicle."54 The objectives and related policies (or strategies) related to this goal are:

  • Objective Number 1 - The City shall work towards reducing per capita vehicle-miles- traveled in the Salem Urban Area by assisting individuals in choosing alternative travel modes.
    • Policy 1.1 Support the Regional TDM Program.
    • Policy 1.2 Support Adequate and Consistent Funding for the Regional TDM Program.
    • Policy 1.3 Reduce Per Capita Vehicle-miles-traveled.
  • Objective Number 2 - Reduce automobile travel demand generated by employment sites, colleges, and schools.
    • Policy 2.1 Target Marketing Efforts.
    • Policy 2.2 Increase Marketing to Employers.
    • Policy 2.3 Assist in the Formation of Vanpools.
    • Policy 2.4 Encourage State Agencies to Reduce Peak Hour Travel Demand.
  • Objective Number 3 - Increase public awareness of alternative transportation modes.
    • Policy 3.1 Provide Information Through Public Events.
    • Policy 3.2 Outreach to Schools and Community Groups.
  • Objective Number 4 - Coordinate regional TDM efforts.
    • Policy 4.1 Work with Other Agencies and Organizations.
    • Policy 4.2 Monitor TDM Programs Nationwide.
  • Objective Number 5 - The City of Salem shall encourage the use of alternative travel modes by serving as an institutional model for other agencies and businesses in the community.
    • Policy 5.1 Employee Incentive Programs.
    • Policy 5.2 Reduce Peak Hour Travel Demand.

The City of Salem's transportation plan provides additional detail for each of these policies, describing exactly how each policy will be implemented, including marketing and outreach efforts, financial incentives and disincentives, and other mechanisms for reducing dependence on single occupancy vehicles and related trips.

Note, in particular, that the TSMO strategies and projects within the subarea are linked to the agreed to goals and objectives developed through a collaborative process with key stakeholders and responsible agencies within the subarea, in this case a city within a larger region.

In a similar manner, Chapters 5 and 7 of the Dakota County, Minnesota transportation plan55 are built around two of this subarea's primary goals. Chapter 5 addresses their Goal 2, which "directs Dakota County in the development and integration of a comprehensive transit system, bicycle and pedestrian network, and other non-automobile modes for people and freight to maximize the efficiency of the transportation system by providing safe, timely, and efficient connections between communities, activity generators, and employment centers." Chapter 7 addresses Goal 4, which is "Management to Increase Transportation System Efficiency, Improve Safety and Maximize Existing Highway Capacity." Within each of these chapters, the Dakota County plan presents policies and strategies designed to help them achieve their goals, with many of these drawing on relatively low cost TSMO strategies.

Evaluating Transportation Systems Management and Operations Strategies

While many operations strategies (e.g., variable speed limits, queue warning systems, and dynamic ramp metering) have benefits, because they differ from conventional capacity investments in terms of cost, service life, and requirements, it is not always clear how to assess strategies. After identifying potential TSMO strategies for a subarea, there are several methods that are available to evaluate the strategies to determine which ones are most suitable to the subarea context and work together to provide the most benefit. This often takes place in two phases: screening the strategies for feasibility, and then conducting a more detailed evaluation prior to selecting strategies to move forward with funding and implementation. The evaluation factors may include technical and institutional feasibility, return on investment, or others relevant to the subarea stakeholders.

Numerous methods and tools are currently available to evaluate TSMO strategies as part of subarea planning. They vary in purpose served, complexity, input and output data, and the strategies that they analyze. Four main categories of analysis tools could apply to the evaluation of TSMO strategies: (1) travel demand models; (2) sketch-planning tools; (3) analytical/deterministic tools; and (4) simulation models, as well as many hybrid approaches. Sketch-planning tools allow for the basic screening of strategies, while deterministic tools and simulation typically go beyond the results of travel demand models to enable more detailed analysis of TSMO strategies. When selecting a tool, it is important to not only match the tool's capabilities to the subarea team's objectives, but also to consider other factors (e.g., budget, schedule, and resource requirements). The team should avoid trying to apply a tool that is more complex and time-consuming than needed. Conversely, the team should not use a tool that lacks the sensitivity or detail to address its need.

Travel demand models are useful in screening and evaluating subarea-wide strategies, such as congestion pricing and ridesharing programs, because they support an assessing mode choice and travel pattern or volume impacts. Travel demand models supply data to simulation models, sketch-planning tools, and post-processors that can analyze TSMO strategies. They are useful for generating traffic origin-destination patterns or volumes for input into simulation models. They are limited in their ability to analyze TSMO strategies, however, as they miss the impacts of incidents, work zones, and special events.

Sketch-planning tools are intended to provide quick analysis using generally available information and data. They provide a quick order-of-magnitude estimate with minimal input data in support of preliminary screening assessments. Sketch-planning tools are appropriate early on when prioritizing large numbers of strategies or investments for more detailed evaluation. They are typically spreadsheets or simple databases that are based on built-in assumptions of impacts and benefits for various strategies.

FHWA developed TOPS-BC, a benefit-cost analysis sketch-planning tool that is available to help subarea teams screen multiple TSMO strategies. It provides order-of-magnitude benefit cost estimates using default parameters that can be customized using local data. TOPS BC is available for download from the FHWA Planning for Operations Website.56 FHWA is continuing to develop products to assist practitioners in applying benefit-cost analysis for TSMO strategies.

Analytical or deterministic tools typically implement the procedures of the Highway Capacity Manual.57 These tools quickly predict capacity, density, speed, delay, and queuing on a variety of transportation facilities and are validated with field data, laboratory test beds, or small-scale experiments. The primary example of a tool within this category is the Highway Capacity Software, which implements the procedures defined in the Highway Capacity Manual for analyzing capacity and determining LOS for signalized and unsignalized intersections, urban streets, freeways, weaving areas, ramp junctions, multi-lane highways, two-lane highways, and transit. These tools are applicable for evaluating TSMO strategies for a subarea since they are mainly for individual intersections or small-scale facilities and are widely accepted for examining different types of traffic control strategies (e.g., uncontrolled, stop controlled, and signalized).

Simulation tools cover a range of software that is available to model transportation system operations and can be applied specifically to subareas. Simulation models are typically classified according to the level of detail at which they represent the traffic stream. Macroscopic simulation models simulate traffic flow, taking into consideration aggregate traffic stream characteristics (i.e., speed, flow, and density) and their relationships. Microscopic simulation models simulate the characteristics and interactions of individual vehicles. Mesoscopic simulation models simulate individual vehicles, but describe their activities and interactions based on aggregate (macroscopic) relationships.

Agencies use simulation tools to analyze operations of both traffic and transit to conduct needs assessments, alternatives analysis, and environmental impact studies. A key advantage of these tools is their ability to simulate conditions, such as incidents, and analyze conditions under multiple scenarios. Some specific strategies that can be simulated include ramp metering, express lanes, and variable speeds limits. Most simulation models also produce graphical or animated displays of the results. These can be invaluable in presenting key findings and results to a broad range of audiences beyond transportation professionals. The primary challenges associated with simulation tools are related to the resources required to develop and apply such models. These include the level of expertise needed, data and computing requirements, and the amount of time required to adequately and accurately calibrate models to real-world conditions.

Activity-based models are increasingly being used as a region's travel demand model and may be useful in evaluating TSMO strategies within subareas. They typically function at the level of individual traveler and represent how the person travels across the entire day. They provide detailed performance metrics but take much longer to run and have greater development and maintenance costs. They can evaluate pricing strategies, travel demand management programs, and many other TSMO strategies.

Dynamic traffic assignment (DTA) also is emerging as a practical tool for numerous planning and operations applications. DTA is a type of modeling tool that combines network assignment models, which are used primarily in conjunction with travel demand forecasting procedures for planning applications, with traffic simulation models, which are used primarily for traffic operational studies. DTA involves the capability to assign or re-assign vehicle trip paths based on prevailing conditions. For example, a vehicle may be re-assigned to a different path in the middle of its trip due to the congestion on its original path. DTA enables evaluating operational strategies that are likely to induce a temporal or spatial pattern shift of traffic. It enables estimating travel behavior from various demand and supply changes and interactions. It is suitable for analyses involving incidents, construction zones, ATDM strategies, ICM strategies, ITS, managed lanes, congestion pricing, and other TSMO strategies. However, the application of DTA does generally require a significant investment of resources and expertise in both demand and simulation modeling.

Selecting Strategies to Best Achieve Objectives

Building on the assessment of potential strategies using analysis tools, the subarea plan will involve selecting a set of promising strategies to achieve the operations objectives for the subarea. Given the wide array of potential strategies to consider, including those that focus on highway/ traffic operations, transit operations, demand management, and capacity, selecting strategies for a subarea often will involve both quantitative analysis, as well as qualitative assessments of what would work best to fit within the specific context of the subarea.

It is important to recognize that effective subarea management will typically involve implementation of a number of complementary strategies rather than a single strategy, or even a set of strategies applied to different modes. One of the key values of exploring subarea operations is recognizing the interconnections among different roadway facilities, transit, and other modal options. Consequently, a number of individual strategies may be grouped together and considered as a package of improvements. For instance, improving arterial operations may involve a combination of traffic signal coordination, TSP, and parking management strategies. Typically, planners and operators will work together to identify and evaluate potential strategies, and then define a package or several possible packages of improvements. The alternative subarea strategies can then be evaluated as to their performance relative to defined operations objectives, within the context of community values, and with recognition of available resources for implementation.

Some strategies also may not require investments in infrastructure or technology deployment in the field, but could be fostered through improved data sharing and communications practices.

Prioritizing strategies or packages of strategies for selection often involves making tradeoffs in deciding what approach would be most effective to meet subarea objectives. For instance, use of a highway shoulder as a lane for buses could help improve transit reliability, but it should be considered in the context of road safety and the potential benefit for travelers in relation to the costs of upgrading the shoulder and lane markings, in comparison to other potential strategies. Similarly, on an urban arterial, traffic signal improvements, including retiming or TSP, need to consider an array of issues and potential impacts, including effects on road traffic, transit, and bicycles and pedestrians in terms of travel time and safety.

To the extent possible, using common evaluation methods for comparative assessments of strategy alternatives is valuable. For instance, if travel time reliability (i.e., consistent or predictable travel times and on-time transit performance) is a key objective for the subarea, then integrating reliability performance measures into the selection of strategies can help ensure that strategies are prioritized that best support the TSMO objectives for the subarea. TSMO strategies that improve reliability include a wide range of strategies: information systems, incident management, managed lanes, TSP, and transit and freight vehicle tracking. As a result, using reliability performance measures does not define a singular strategy but is helpful in comparing the estimating impacts of different strategies.

In addition to using the outputs of tools described above, approaches that can be used to compare strategies or packages of strategies include:

  • Analyzing cost-effectiveness: Using a cost-effectiveness approach involves calculating the overall cost effectiveness (cost per unit of benefit) for each strategy based on defined benefits. Tools available to calculate reliability benefits include sketch planning, model post-processing, simulation, and multi-resolution/multi-scenario modeling. Once the cost effectiveness of each strategy is determined, strategies can be ranked in order from highest to lowest.
  • Benefit-cost analysis: Benefit-cost analysis can be a useful tool for comparing different options, if sufficient data are available on key metrics, such as travel times and safety, to monetize these effects in relation to costs. Valuing travel time and delay is typically accomplished using surveys of travelers to determine their perceived benefit of travel time.58
  • Multi-criteria scoring: Another approach is to use performance measures along with scoring criteria to assess how different alternatives support subarea performance objectives. For instance, if several key objectives have been defined for a subarea related to system operations (e.g., safety, transit on-time performance, highway reliability, etc.), then strategies are given scores in relation to each objective to prioritize the most promising strategies.

Commonly, the process of analyzing and selecting potential strategies or combinations of strategies will yield some approaches that are most promising.

PUTTING IT ALL TOGETHER

As described above, operations objectives are essential elements of TSMO planning. The following section provides a set of easy-to-use reference sheets for operations objectives that are relevant to subareas. Each reference sheet provides an overview of the operations objective area, a menu of operations objective statements and associated performance measures, a description of data needs and potential providers, and possible TSMO strategies to achieve the operations objectives. They are intended as a resource for subarea planners and operators who are searching for ideas for potential operations objectives and performance measures. The sheets help to lead planners and operators through the some of the major considerations of planning for TSMO in subareas: gathering stakeholders, developing operations goals, developing operations objectives and performance measures, collecting data to support the measures, and identifying associated TSMO strategies. The quick reference sheets draw from FHWA's Advancing Metropolitan Planning for Operations: The Building Blocks of a Model Transportation Plan Incorporating Operations - A Desk Reference, and were adapted for application to subarea planning.59

System Efficiency: Subarea Travel Time

These objectives are focused on reducing the amount of time it takes to travel within a subarea. Travel time is a measure of the average time spent in travel, which is a function of both travel speed and distance. The objectives can be made multimodal to account for transit, truck and bicycle travel in the subarea, where appropriate.60

Stakeholders
  • State, county, or city agencies responsible for roadways.
  • Transit agencies.
  • Local businesses, freight distribution centers, event centers, and neighborhood associations.
  • Toll authorities.
  • MPOs, if there are any regional rideshare or travel demand programs.
  • Ports, if applicable.
  • Business improvement districts, if applicable.
  • Transportation network companies.
  • Traffic management center(s).
  • Media.
  • Parking authorities.
Goals
  • Reduce subarea travel time experienced by travelers.
Subarea Operations Objectives
  • Improve average travel time during peak periods by X percent by year Y.
  • Improve average commute trip travel time by X percent by year Y.
  • Annual rate of change in subarea average commute travel time will not exceed subarea rate of population growth through year Y.
Performance Measures
  • Average travel time during peak periods (minutes).
  • Average commute trip travel time (minutes).
Anticipated Data Needs
  • Peak period and free flow travel time and speeds.
  • Person travel along subarea routes (e.g., vehicle volume multiplied by vehicle occupancy).
  • Trip length.
  • Annual subarea population.
Data Resources and Partners State DOTs, counties, cities, traffic management centers, and private sector sources can provide travel time data including speeds and volumes. Transit agencies can provide transit travel time, speed data, and passenger counts. The U.S. Census Bureau can provide population data.
TSMO Strategies to Consider Strategies designed to reduce recurring peak period congestion, such as traffic signal coordination, and transportation demand strategies that encourage shifts in travel mode, time or route. If the objective includes transit or bicycles, strategies can include transit signal priority or bicycle traffic signals.

System Reliability: Non-Recurring Delay in Subareas

This set of objectives is focused on minimizing non-recurring delay within subareas. This type of travel-time delay is caused by transient events as opposed to delay caused by geometric limitations or a lack of capacity. These objectives focus on non-recurring delay due to scheduled disruptions and unscheduled disruptions to travel.61

Stakeholders
  • State, county, or city agency responsible for roadways, including maintenance crews.
  • Toll authorities.
  • MPOs, if there are any regional rideshare or travel demand programs.
  • Traffic management center(s).
  • Transit agencies.
  • Incident responders.
  • Contractors.
  • Utility agencies/companies.
  • Weather forecast services.
  • 911 center(s).
  • Law enforcement.
  • Fire and rescue agencies.
  • Emergency medical agencies.
  • Tow industry.
  • Hazardous materials industry.
  • Local businesses, freight distribution centers, event centers, and neighborhood associations.
  • Ports, if applicable.
  • Media.
Goals Minimize non-recurring delay (scheduled and non-scheduled disruptions) within subareas.
Subarea Operations Objectives
  • Reduce total person hours of delay in subarea by time period (peak, off-peak) caused by:
    • Scheduled events (i.e. work zones, system maintenance, special events) by X hours in Y years.
    • Unscheduled disruptions to travel (i.e. crashes, weather, debris) by X hours in Y years.
    • All transient scheduled and non-scheduled events by X hours in Y years.
Performance Measures
  • Travel time delay during scheduled and/or unscheduled disruptions to travel within the subarea.
  • Total person hours of delay during scheduled and/or unscheduled disruptions to travel within the subarea.
Anticipated Data Needs
  • Average travel time by person or vehicle during non-recurring events such as traffic incidents, special events, and work zones.
  • Average travel time by person or vehicle during free flow travel conditions within the subarea.
Data Resources and Partners Travel time data during non-recurring events may be difficult to collect using traditional methods, particularly during unscheduled events such as incidents and severe weather. Instead, collection and synthesis of data from connected vehicles/ devices and smart cities applications may be viable methods of collecting travel time data. Traffic management centers and/or public safety organizations are likely needed to assist in identifying the locations and times of traffic incidents. Road and track maintenance staff will be needed to identify upcoming work. Data on travel times during unscheduled events may need to be extracted after collection from ongoing travel-time data based on the time and location of events. The National Weather Service may also need to be involved in identifying times and locations of severe weather that may have impacted travel.
TSMO Strategies to Consider Strategies to reduce non-recurring delay include those that focus on reducing the delay caused by incidents, work zones, special events, weather, and other non-recurring events that affect traffic flow.

System Options: Mode Shares

This set of objectives focus on increasing the use of travel modes other than the single occupancy vehicle to improve the overall efficiency of the transportation system.62

Stakeholders
  • State, county, or city agency responsible for roadways.
  • MPOs, if there are any regional rideshare or travel demand programs.
  • Transportation network companies.
  • Traffic management center(s).
  • Transit agencies.
  • University research centers.
  • Ports, if applicable, local businesses, freight distribution centers, event centers, and neighborhood associations.
  • Pedestrian and bicycle advocacy groups.
Goals
  • Reduce single occupancy vehicle trips by promoting other mode choices.
Subarea Operations Objectives
  • Reduce per capita single occupancy vehicle (SOV) commute trip rate within subarea by X percent in Y years.
  • Increase non-SOV mode share for all trips within subarea by X percent within the next Y years.
  • Increase active transportation (bicycle/pedestrian) mode share within subarea by X percent by year Y.
  • Reduce SOV trips by X percent within subarea through travel demand strategies (e.g. employer or residential rideshare) by year Y.
  • Achieve X percent non-SOV mode share in subarea transit station communities by year Y.
Performance Measures
  • SOV commute trips per capita within subarea.
  • Share of employees within subarea walking, bicycling, telecommuting, carpooling/vanpooling, riding transit, driving alone.
  • Share of trips by each mode of travel within subarea.
  • Percent of all trips made using alternative modes in subarea transit station communities.
Anticipated Data Needs
  • Survey data, such as the U.S. Census Journey to Work Survey or other mode share surveys within subarea.
  • Subarea employer surveys of employee commuting patterns.
  • Subarea household surveys of travel behaviors including mode choice, frequency of trip making, and vehicle occupancy.
Data Resources and Partners Employers, transportation management associations, travel demand management programs, transit agencies, state and local DOTs, commuters, non-auto advocacy groups, and research firms may be resources for data. Connected vehicles/devices and smart city applications may also provide real-time data that can be synthesized for analysis.
TSMO Strategies to Consider Strategies to increase non-SOV mode share by encouraging the use of other modes include travel demand management strategies, parking management, and congestion pricing strategies. Many of these strategies are described in more detail later in this section.

System Options: Bicycle and Pedestrian Accessibility and Efficiency

This set of objectives focus on improving the accessibility and efficiency and safety of bicycle and pedestrian modes to offer travelers feasible and attractive travel options within a subarea.63

Stakeholders
  • State, county, or city agency responsible for roadways.
  • Local businesses, freight distribution centers, event centers, and neighborhood associations.
  • Traffic management center(s).
  • Transit agencies.
  • Pedestrian and bicycle advocacy groups.
  • University research centers.
  • Ports, if applicable.
Goals
  • Improve bicycle and pedestrian accessibility and efficiency.
  • Provide attractive bicycle and pedestrian travel options within a subarea.
Subarea Operations Objectives
  • Decrease average delay for pedestrians and bicyclists on primary pedestrian and/or bicycle routes by X percent in Y years.
  • Increase system completeness within subarea for pedestrians and/or bicyclists by X percent within Y years.
  • Increase the number of intersections with pedestrian and/or bicycle safety features (countdown pedestrian signal heads, bicycle signals, painted crosswalks/bike boxes, etc.) to X percent by year Y.
  • Increase average pedestrian (or bicyclist) comfort level by X points in Y years.
Performance Measures
  • Average delay for pedestrians and bicyclists on primary pedestrian and/or bicycle routes within the subarea.
  • Percent of subarea transportation network with pedestrian and/or bicycle facilities.
  • The percentage of intersections with pedestrian and/or bicycle safety features.
  • Number of pedestrian/bicyclist injuries/fatalities.
  • Average pedestrian and/or bicyclist comfort level as measured by survey.
Anticipated Data Needs
  • Average wait time for pedestrians and bicyclists at intersections or path impediments by time period.
  • An inventory of bicycle and pedestrian infrastructure.
  • Survey information on pedestrian and/or bicyclist comfort level.
  • Pedestrian and bicycle injuries and deaths.
Data Resources and Partners State and local DOTs, MPOs, counties, cities, highway districts and universities are sources for pedestrian and bicycle travel data. Private sector crowdsourcing data can also be utilized to inventory conditions and comfort level. Pedestrian and bicycle advocacy groups can be a source of data.
TSMO Strategies to Consider Pedestrian countdown signals, bicycle lanes, wayfinding signage, crossing signals where bicycles and pedestrians cross major roadways.

Arterial Management: Traffic Signal Management

These objectives improve the management of traffic signal operations on arterial roadways within a subarea through advanced technology, increased reviews, and planning.64

Stakeholders
  • State, county, or city agency responsible for roadways.
  • Traffic management center(s).
  • Traffic signal technicians.
  • Incident responders.
  • Contractors.
  • Transit agencies.
  • Local businesses, freight distribution centers, event centers, and neighborhood associations.
  • Ports, if applicable.
Goals
  • Improve arterial traffic signal operations for day-to-day operations during peak and off-peak periods.
  • Improve arterial traffic signal operations during scheduled or non-scheduled events.
Subarea Operations Objectives
  • Evaluate arterial signal timing within subarea every Y years.
  • Increase the number of subarea arterial intersections running in a coordinated, closed-loop, or adaptive system by X percent in Y years.
  • Prepare and implement special subarea arterial timing plans for use during freeway incidents, roadway construction activities, or other special events by year Y.
  • Crash data for subarea arterial roadways is reviewed every X years to determine if signal adjustments can be made to address a safety issue.
Performance Measures
  • Number of years between traffic signal timing evaluation on arterial.
  • Number of intersections running in a coordinated, closed-loop, or adaptive system.
  • Completion of at least one special timing plan for incidents, construction, or events within subarea.
  • Number of times per year a special timing plan is used within subarea.
  • Number of years between reviews of crash data on all subarea arterials for possible signal timing impacts.
Anticipated Data Needs Reports from operating agencies on frequency of signal retiming evaluation, current traffic signal capabilities, special timing plans, and crash data reviews. Number of freeway corridor ramp meters and year of installation.
Data Resources and Partners Partner agencies that operate arterials and agencies that maintain traffic crash records. as State DOTs, cities, counties, and transportation management centers.
TSMO Strategies to Consider Regular evaluation of traffic signal timing, enhanced traffic signal systems, special subarea timing plans for events, incidents, and work zones, and regular review of subarea crash data.

Freeway Management: Transportation Management Center (TMCs)

The objectives in this section focus on monitoring the operation of the subarea transportation system and initiating control strategies that effect changes in the operation of the network.65

Stakeholders
  • State, county, or city agency responsible for roadways.
  • Traffic management center(s).
  • Transit agencies.
  • 911 center(s).
  • Law enforcement.
  • Fire and rescue agencies.
  • Emergency medical agencies.
  • Local businesses, freight distribution centers, event centers, and neighborhood associations.
  • Ports, if applicable.
  • Media.
Goals
  • Improve overall subarea transportation system operations during peak periods, scheduled and unscheduled events.
Subarea Operations Objectives
  • Increase the level of transportation management center (TMC) subarea field hardware (e.g. cameras, dynamic message signs, ITS applications) by X percent by year Y.
  • Increase the hours of TMC operation and level of staffing for the subarea by X percent by year Y.
  • Increase the percent of the subarea transportation system monitored by the TMC for real-time performance.
Performance Measures
  • Total amount of subarea TMC equipment.
  • Number of hours of TMC operation and number of staff serving the subarea.
  • Percent of subarea transportation system monitored by the TMC for real-time performance.
Anticipated Data Needs
  • Subarea TMC equipment deployed.
  • Changes in TMC hours of operation and staffing levels.
  • TMC operational data, such as level of subarea performance monitoring, number of subarea events managed, level of services provided to aid travelers within subarea.
Data Resources and Partners Operators of transportation management centers and partners, such as State DOTs, cities, counties, transit agencies, and emergency management agencies.
TSMO Strategies to Consider Strategies include managing the operation of the subarea transportation system by communicating travel condition information, making necessary modifications to traffic and transit control systems, and directing response activities.

Transit Operations and Management: Transit Signal Priority

The objectives in this section focus on implementation of transit signal priority systems to improve transit performance and reliability within a subarea.66

Stakeholders
  • State, county, or city agencies responsible for roadways.
  • Transportation management center(s). Traffic signal technicians.
  • Transit agencies.
  • Local businesses, freight distribution centers, event centers, and neighborhood associations.
  • Ports, if applicable.
Goals
  • Improve transit service performance and reliability on subarea roadways with traffic signals.
Subarea Operations Objectives
  • Increase implementation of transit signal priority at X number of intersections over the next Y years.
  • Decrease traffic signal delay on transit routes within subarea by X percent per year.
  • Decrease transit vehicle delay within subarea by X percent per year by increasing the use of queue jumping and automated vehicle location (AVL).
Performance Measures
  • Number of transit routes/intersections equipped with transit signal priority capability in subarea.
  • System-wide signalized stop delay on transit routes.
  • Travel time delay on routes with queue jumping and automated vehicle location in use.
Anticipated Data Needs
  • Number of transit routes/intersections with transit signal priority capabilities.
  • AVL data with location and travel time delay.
  • Signal operations/green time reports.
Data Resources and Partners Transit agencies and traffic signal operating agencies in the region can provide information about implementation and performance of transit signal priority. AVL data can provide transit vehicle travel time.
TSMO Strategies to Consider TSMO strategies to increase transit signal priority implementation could involve identification and prioritization of transit routes and signalized intersections that are candidates for implementing transit signal priority systems or queue jumping. Another strategy may include collaboration with the traffic management agency to leverage transit signal priority implementation with traffic signal system upgrades.

Traffic Incident Management

This objective set focuses on improving system efficiency, system reliability, traveler information, and agency efforts for managing traffic incidents on freeways and arterials within a subarea.67

Stakeholders
  • State, county, or city agency responsible for roadways.
  • MPOs, if there are any regional rideshare or travel demand programs.
  • Traffic management center(s).
  • Transit agencies.
  • 911 center(s).
  • Law enforcement.
  • Fire and rescue agencies.
  • Emergency medical agencies.
  • Tow industry.
  • Hazardous materials industry.
  • Local businesses, freight distribution centers, event centers, and neighborhood associations.
  • Ports, if applicable.
  • Media.
Goals
  • Reduce traffic incident duration and person hours of delay within a subarea.
  • Provide travelers with accurate, timely, and actionable information and improve customer satisfaction.
  • Increase coordination and communication among agencies.
  • Train incident management staff how to mitigate the traffic impacts related to incidents and how to coordinate with partners.
Subarea Operations Objectives
  • Increase implementation of transit signal priority at X number of intersections over the next Y years.
  • Decrease traffic signal delay on transit routes within subarea by X percent per year.
  • Decrease transit vehicle delay within subarea by X percent per year by increasing the use of queue jumping and automated vehicle location (AVL).
Performance Measures
  • Reduce subarea mean incident notification time by X percent over Y years.
  • Reduce mean time for needed subarea responders to arrive on-scene after notification by X percent over Y years.
  • Reduce subarea mean incident clearance time and mean roadway clearance time per incident by X percent over Y years.
  • Reduce mean time of incident duration on transit services and subarea facilities by X percent in Y years.
  • Reduce the person hours of total delay associated with subarea traffic incidents by X percent over Y years.
  • Reduce time between incident verification and posting a traveler alert to traveler information outlets by X minutes in Y years.
  • Reduce the time between recovery from incident and removal of traveler alerts for that incident.
  • Increase number of repeat visitors to subarea traveler information outlet by X percent in Y years.
  • Increase customer satisfaction with subarea incident management efforts by X percent over Y years.
  • Increase the percentage of incident management agencies that participate in a coordinated subarea incident response team by X percent in Y years.
  • Hold at least X multi-agency after-action review meetings each year with attendance from at least Y percent of the agencies involved in the response.
  • Conduct X joint training exercises among incident/emergency operators and responders for the subarea by year Y.
  • Average incident notification time of necessary response agencies.
  • Mean time for needed responders to arrive on-scene after notification.
  • Mean incident clearance time and mean roadway clearance time per incident.
  • Mean time of incident duration.
  • Person hours of delay associated with subarea traffic incidents.
  • Time to alert travelers of a subarea incident.
  • Time between recovery from incident and removal of traveler alerts.
  • Number of repeat visitors to traveler information outlet.
  • Percentage of customers satisfied with subarea incident management practices.
  • Number of participating agencies in a subarea coordinated incident response team.
  • Number of multi-agency after-action reviews per year.
  • Percentage of responding agencies participating in after-action review.
  • Number of joint training exercises conducted among incident/emergency operators and responders.
Anticipated Data Needs
  • For each incident of interest within the subarea, incident notification time and on-scene arrival time; specifically, the time of the awareness of an incident and one or more of the following pieces of data: the time the last responder left the scene, the time when all lanes were re-opened, and the time when traffic returned to full operational status.
  • Total travel time in person hours of travel: a) during free flow conditions, and b) impacted by incidents.
  • Time of incident verification, time of traveler information outlet activation (e.g. dynamic message sign posting, 511 entry, website log), time of subarea system recovery, and time of travel alert removal.
  • Customer satisfaction surveys.
  • Number of agencies participating in a subarea incident management program.
  • Number of after-action reviews held.
  • Number of joint training exercises conducted among incident/emergency operators and responders.
Data Resources and Partners Data (including video feed if applicable) can typically be provided by incident responders, law enforcement/fire and rescue/medical responders or operators at a traffic management center or emergency operations center. Due to the unpredictable nature of traffic incidents, travel time data may need to be collected, stored, and analyzed after incident times and locations are obtained. Customer satisfaction information would need to be gathered from transportation system users that were using the system during the time of the incident.
TSMO Strategies to Consider Many of the incident management strategies are complementary and work together to achieve the objectives. For example, providing accurate and timely traveler information can help reduce travel time delay by encouraging travelers to avoid the incident area and can also help improve customer satisfaction. Increasing agency participation within the subarea, holding after-action review meetings, and holding joint training can help improve incident detection and verification and help shorten incident clearance time. Other strategies to consider include enhancing inter-agency voice and data communications systems, using or expanding the use of roving subarea patrols, expanding surveillance camera coverage, and training on dissemination of subarea traveler information.

Special Event Management

This objective set focuses on improving system efficiency, system reliability, traveler information, and agency efforts for managing special events within a subarea.68

Stakeholders
  • State, county, or city agency responsible for roadways.
  • MPOs, if there are any regional rideshare or travel demand programs.
  • Transportation network companies.
  • Traffic management center(s).
  • Transit agencies.
  • 911 center(s).
  • Law enforcement.
  • Fire and rescue agencies.
  • Emergency medical agencies.
  • Special event promoters.
  • Special event venues.
  • Parking providers.
  • Local businesses, freight distribution centers, event centers, and neighborhood associations.
  • Ports, if applicable.
  • Media.
Goals
  • Reduce travel time for entering and exiting a special event.
  • Minimize the use of single-occupancy vehicles by special event attendees and encourage the use of other modes.
  • Encourage a more efficient use of parking facilities.
Subarea Operations Objectives
  • Reduce average travel time into and out of the event by X percent in Y years.
  • Reduce average time to clear event's exiting queue by X percent in Y years.
  • Reduce non-special event VMT in the event area during events by X percent in Y years.
  • Decrease the percent of subarea special event attendees traveling to the event in single-occupancy vehicles by X percent in Y years.
  • Increase the percent of special event attendees using park and ride lots by X percent in Y years.
  • Increase the percent of special events with dedicated transit or shuttle service by X percent in Y years.
  • Increase the methods of effectively disseminating subarea special event information to travelers by X percent in Y years.
  • Increase the percentage of planned special events (with attendance above Z) with information on anticipated and actual travel conditions being disseminated to the traveling public at least X hours prior to the event.
  • Increase the number of subarea special events that use shared parking facilities (e.g. parking lots of nearby businesses or organizations) by X percent in Y years.
  • Increase the use of flexible pricing mechanisms near subarea special event locations on X percent of parking spaces in Y years.
  • Increase on-street parking restrictions on X percent of widely used subarea routes during special events in Y years.
  • Increase the percentage of special event stakeholders participating in a subarea event management team to X percent in Y years.
  • Increase the percentage of subarea special events that include training exercises, pre-event meetings, and post-event briefing by X percent in Y years.
  • Increase the percent of major subarea special events using ITS-related assets (e.g. cameras, dynamic message signs, vehicle and bicycle detection) to detect and manage special event entry/exit bottlenecks and incidents by X percent in Y years.
  • Implement special event traffic signal timing plans at X percent of major subarea special events each year beginning in year Y.
Performance Measures
  • Average travel time to selected special events from a set of locations in the subarea over a year.
  • Average travel time away from selected special events to a set of locations in the subarea over a year.
  • Average time to clear event's exiting queue by year per event.
  • Non-special event vehicle miles traveled (VMT) in the event area during events over a year.
  • Percent of special event attendees: using single occupancy vehicles and using park and ride lots each year for selected subarea events.
  • Percent of special events with dedicated transit or shuttle service for selected subarea events during a one-year period.
  • Number of effective methods to disseminate subarea special event information to travelers.
  • Percent of subarea special events with attendance over Z that traveler information is disseminated at least X hours prior to the event.
  • Number of subarea special events that use shared parking facilities.
  • Percent of subarea parking spaces near special event locations that use flexible parking mechanisms.
  • Percent of subarea routes widely used during planned special events with on-street parking restrictions.
  • Number of stakeholders participating in subarea special event management team.
  • Number of events that include training exercises, pre-event meetings, and post-event briefings.
  • Percent of subarea special events using ITS assets to detect and manage incidents/bottlenecks at entry/exit routes of the events.
  • Percent of major subarea special events each year in which a special event traffic signal timing plan was implemented.
Anticipated Data Needs
  • Travel time to and from a set of subarea special events.
  • Time to clear an event's exiting queue in terms of vehicles, transit, walking, and bicycling.
  • Vehicle miles traveled for vehicles not associated with special event.
  • Number of special event attendees, including associated number of single occupancy vehicles and number using park and ride lots.
  • Number of subarea special events with dedicated transit or shuttle service.
  • Count of available traveler information dissemination channels.
  • Count of major subarea special events with and without the dissemination of traveler information ahead of the event.
  • Count of special events using shared use parking facilities.
  • Count of parking spaces near special event locations with and without flexible pricing mechanisms.
  • Determination of the most widely used subarea routes during special events and count of those routes with on-street parking restrictions.
  • Number of special event stakeholders and, of them, the number that participate each year in a subarea event management team.
  • Count of special events with training exercises, pre-event meetings, and post-event briefings.
  • Number of subarea special events and number of special events with ITS assets used for detecting/managing bottlenecks and incidents at exit/entry routes of events.
  • Number of major subarea special events where targeted signal timing plans were implemented.
Data Resources and Partners Agencies that may be involved in collecting data include highway, arterial, and transit facility operators, signal system operators, public safety officials, parking authorities, and special event management staff.
TSMO Strategies to Consider A wide variety of strategies, particularly travel demand management strategies, are available to help manage special events. Consider developing a subarea special event management plan to identify the most appropriate strategies and to address stakeholder coordination, training exercises, pre-event planning, and post-event debriefs. Consider strategies such as encouraging non-single occupancy vehicle mode choice (e.g. transit, ridesharing, bicycling, walking), transit/shuttle service, park and ride lots, shared parking with nearby facilities, parking pricing, subarea route management, special event traffic signalization, and traveler information.

Road Weather Management

The objectives for managing road weather within a subarea focus on improving system efficiency, system reliability, traveler information, and traffic signal management.69

Stakeholders
  • State, county, or city agency responsible for roadways, including maintenance crews.
  • Weather forecast services.
  • MPOs, if there are any regional rideshare or travel demand programs.
  • Traffic management center(s).
  • Transit agencies.
  • 911 center(s).
  • Law enforcement.
  • Fire and rescue agencies.
  • Emergency medical agencies.
  • Local businesses, freight distribution centers, event centers, and neighborhood associations.
  • Ports, if applicable.
  • Media.
Goals
  • Improve the clearance time of weather-related debris (e.g. fallen limbs and trees, snow and ice, power lines and poles) from the subarea transportation facilities.
  • Help travelers avoid segments within subarea that are dangerous and would cause them substantial delay.
  • Disseminate relevant information to travelers in a timely manner regarding the impact of weather on subarea travel.
  • Increase the coverage of the subarea (roadway, transit, or bicycle facilities) with weather sensors and communications.
  • Improve traffic signal management during inclement weather conditions.
Subarea Operations Objectives
  • Reduce average time to clear subarea of weather-related debris after weather impact by X percent in Y years.
  • Increase by X percent the number of significant subarea routes covered by weather-related diversion plans by year Y.
  • Increase the percent of agencies that have adopted multi-agency weather-related subarea transportation operations plans and are involved in operations during weather events to X percent by year Y.
  • Reduce time to alert travelers of travel weather impacts using traveler information outlets (e.g. dynamic message signs, 511, websites, media) by X (time period or percent) in Y years.
  • Increase the percent of the subarea covered by weather sensors or a road weather information system (RWIS) by X percent in Y years as defined by an RWIS station within Z miles.
  • Special timing plans are available for use during inclement weather conditions for X miles of the subarea roadways by year Y.
Performance Measures
  • Average time to clear selected subarea surface transportation facilities of weather-related debris after weather impact.
  • Percent of significant subarea routes covered by weather-related diversion plans.
  • Percent of agencies involved in transportation operations during weather events that have adopted multi-agency weather-related subarea transportation operations plans.
  • Time from beginning of weather event to posting of information to traveler information outlets.
  • Percent of subarea within Z miles of an RWIS station.
  • Number of miles of subarea roadways that have at least one special signal timing plan for inclement weather events.
Anticipated Data Needs
  • Time in which the subarea surface transportation facilities have been impacted by the debris and the time required to clear the subarea and restore it to full operation.
  • Number of weather-related diversion plans.
  • Total number of agencies involved in transportation operations during weather events that have adopted multi-agency weather-related subarea transportation operations plans.
  • Time of the start of a weather event and the time in which information is given to travelers by traveler information outlets.
  • Deployment locations of each RWIS station within or near the subarea and length of the subarea roadways.
  • Reports from operating agencies on subarea signal retiming, signal capabilities, and special timing plans.
Data Resources and Partners

Field data may come from road or rail weather sensors, observations from meteorologists, National Weather Service data, or transportation facility maintenance staff. Agency partners may include the operators (or public safety personnel) of the impacted transportation facilities.

TSMO Strategies to Consider Many TSMO strategies for road weather management are complementary and work towards achieving multiple objectives. TSMO strategies that support agency operations, and in turn help with system reliability and efficiency, include weather sensors/stations at key subarea locations, pre-positioned debris removal vehicles, preventative techniques such as spreading de-icing material prior to a storm, collaboration with weather forecasting services, and development of alternate route plans in preparation for events through collaboration among jurisdictions and modes. System efficiency can also be improved by developing and implementing special signal timing plans for typical travel demand during weather events. Traveler information strategies that help travelers make informed decisions include current subarea weather and facility information, weather forecasts, status information on operational activities (e.g. map of snow plow activities), and the use of dynamic message signs within the subarea or approaches to key subarea routes.

Work Zone Management

This objective set focuses on improving system efficiency, system reliability, traveler information, and agency coordination efforts for managing work zones within a subarea.70

Stakeholders
  • State, county, or city agency responsible for roadways, including maintenance crews.
  • Contractors.
  • Utility agencies/companies.
  • MPOs, if there are any regional rideshare or travel demand programs.
  • Traffic management center(s).
  • Transit agencies.
  • 911 center(s).
  • Law enforcement.
  • Fire and rescue agencies.
  • Emergency medical agencies.
  • Local businesses, freight distribution centers, event centers, and neighborhood associations.
  • Ports, if applicable.
  • Media.
Goals
  • Reduce travel time delay within subarea work zones.
  • Reduce the extent of congestion for travelers within work zones.
  • Reduce the variability in travel time within work zones.
  • Reduce the overlap in subarea construction projects to reduce the burden on transportation system users.
  • Inform travelers of ongoing subarea work zones to reduce travel time delays.
  • Improve customer satisfaction with work zone management.
Subarea Operations Objectives
  • Reduce the person hours of total delay associated with subarea work zones by X percent over Y years.
  • Increase the rate of on-time completion of subarea construction projects to X percent within Y years.
  • Increase the percentage of subarea construction projects that employ night/ off-peak work zones by X percent in Y years.
  • Reduce the percentage of vehicles traveling through subarea work zones that are queued by X percent in Y year.
  • Reduce the average and maximum length of queues, when present by X percent over Y years.
  • Reduce the average time duration (in minutes) of queue length greater than Z miles by X percent in Y years.
  • Reduce vehicle-hours of total delay in work zones caused by incidents (e.g. traffic crashes within or near the work zone).
  • Increase the number of capital projects reviewed for subarea construction coordination by X percent in Y years.
  • Decrease the number of work zones on parallel routes within subarea by X percent in Y years.
Performance Measures
  • Establish a work zone management system within X years to facilitate coordination of work zones within the subarea.
  • Provide work zone information and multimodal alternatives to traveler information outlets for at least X percent of subarea work zones over the next Y years.
  • Increase customer satisfaction with subarea work zone management efforts by X percent over Y years.
Anticipated Data Needs
  • Total travel time in person hours of travel: a) during free flow conditions, and b) impacted by work zones.
  • Work zone information for work and non-work time periods: traffic volumes, travel time, work zone length (average and maximum).
  • Number of construction projects completed on time.
  • Number of construction projects employing night/off-peak work zones.
  • Number of vehicles traveling through work zones.
  • Number of vehicles traveling through work zones experiencing queuing.
  • Duration of queue length greater than Z miles.
  • Hours of incident-related delay in work zones.
  • Subarea capital projects submitted for review.
  • Subarea capital project anticipated and actual schedules.
  • Map of work zones along area maps.
  • Availability of traveler information and multimodal alternatives for work zones.
  • Customer satisfaction surveys.
Data Resources and Partners Data would need to be collected by agencies responsible for maintenance and operation of the transportation facilities. Partners needed include departments of transportation, public safety, contractors, and utility companies.
TSMO Strategies to Consider Many of the TSMO strategies for work zone management work together in a complementary fashion to achieve the objectives. For example, providing ahead-of-time and real-time multimodal traveler information can help reduce travel time delay and extent of congestion by providing travelers with tools to help them avoid or minimize their exposure to the work zone. This strategy, along with shortening lane closure times particularly during high travel demand periods, also helps improve customer satisfaction. Multi-agency coordination, such as scheduling different work zones for different construction seasons, can help minimize the overall subarea travel impacts. Other strategies to consider include using temporary traffic control devices and practices that minimize the opportunity for crashes, which in turn shortens the incident-related delay in work zones, and using dynamic message signs or portable variable message signs to disseminate traveler information within the subarea or on key approaches to subarea routes.

Transportation Demand Management (TDM): Auto Commuter Trip Reduction

This objective set focuses on reducing the motor vehicle demand for transportation infrastructure by implementing commuter trip reduction programs for employers.71

Stakeholders
  • State, county, or city agency responsible for roadways.
  • MPOs, if there are any regional rideshare or travel demand programs.
  • Transportation network companies.
  • Traffic management center(s).
  • Transit agencies.
  • Local businesses, freight distribution centers, event centers, and neighborhood associations.
  • Ports, if applicable.
  • Media.
  • Travelers.
Goals
  • Implement commuter trip reduction programs with subarea employers
Subarea Operations Objectives
  • Increase the percentage of major subarea employers (employers with at least Z employees) actively participating in transportation demand management (TDM) programs by X percent within Y years.
  • Reduce commute single-occupancy vehicle miles traveled (VMT) per subarea employee by X percent in Y years.
Performance Measures
  • Percent of major subarea employers with active TDM programs.
  • Commuter VMT per subarea employee.
Anticipated Data Needs
  • Number of major subarea employers with and without active TDM programs.
  • Number of subarea employees and total commute VMT.
Data Resources and Partners Data resources may include employer surveys of employee commuting programs, household travel behavior surveys (for commute mode choice, frequency of trip making, and vehicle occupancy), and data from the US Census Bureau, Department of Labor, and business licensing bureaus. Partners include employers, transportation management associations, travel demand management programs, transit agencies, State and local DOTs, non-auto advocacy groups, research firms, and commuters.
TSMO Strategies to Consider TSMO strategies to consider include guaranteed ride home program; commuter financial incentives (parking cash out and transit allowances); alternative scheduling (flextime and compressed work weeks); telework; bicycle parking and changing facilities at major employer locations; worksite amenities such as on-site childcare, restaurants, and shops to reduce the need to drive for errands; company travel reimbursement policies for bicycle or transit mileage for business trips; company vehicles to eliminate the need for employees to drive to work to have their cars for business travel; proximate commuting, which allows employees to shift to worksites that are closest to their home (for employers who have multiple work locations, such as banks and other large organizations); worksite locations that reflect location-efficient development principles; and employer strategies to encourage bicycling and walking, including safe and secure storage for bicycles and shower and locker facilities.

Transportation Demand Management: Mobility on Demand (MoD)

This objective set focuses on increasing the availability and use of shared mobility options that provide on-demand transportation options.72, 73.

Stakeholders
  • State, county, or city agency responsible for roadways.
  • MPOs, if there are any regional rideshare or travel demand programs.
  • Urban Design Experts.
  • Transportation network companies (e.g., Uber, Lyft, Zipcar, car2go, Drive-Now).
  • Parking Authorities.
  • Bicycle share operators (e.g., Citi Bike, Divvy, Spinlister, B-cycle).
  • Co-working companies (e.g., WeWork, Regus, UberOffices, 1776).
  • Vehicle original equipment manufacturers (Mobility on Demand, or MoD, advances clean, compact, energy efficient vehicles).
  • Electric utilities and/or charging station providers.
  • On-demand economy companies (e.g., food, dry cleaning delivery, etc.).
  • Smartphone apps (e.g., RideScout).
  • Traffic management center(s).
  • Transit agencies.
  • Local businesses, freight distribution centers, event centers, business improvement districts, and neighborhood associations.
  • Ports, if applicable.
  • Media.
  • Travelers.
Goals
  • Promote mobility on demand options like ridesharing and bicycle sharing within subarea to increase transportation options and efficiency of the transportation system.
Subarea Operations Objectives
  • Develop and provide travel option services to X identified subarea communities and audiences within Y years.
  • Promote dynamic rideshare service between X major subarea activity centers and major destinations that are not already accommodated within one-quarter mile by other transit services.
  • Foster partnerships with transportation network companies (TNC) to extend transportation options to under-served communities.
  • Create a subarea transportation access guide, which provides concise directions to reach destinations by non-single-occupancy vehicle modes (transit, walking, bike, etc.) by year Y.
  • Increase real-time, fine-grained mobility demand sensing in X percent of subarea by year Y.
  • Deploy/enhance real-time management systems that balance vehicle (and parking space) supply and demand in X identified subarea communities within Y years.
  • Evaluate role of dynamic pricing in mobility demand management for X percent of subarea by year Y.
  • Reduce the walking distance between on-demand mobility locations by X percent within Y years.
Performance Measures
  • Share of subarea household trips by each mode of travel.
  • Percent of subarea residents receiving individualized marketing material on mobility service opportunities.
  • Availability of mobility on demand services.
  • Utilization rates of mobility on demand services.
  • Number of visitors to on-line subarea transportation access guide.
  • Wait times for on-demand mobility services.
  • Energy usage, emissions and other 'livability' metrics.
  • Walking distance between on-demand mobility locations (shared car parking spots, bikeshare lockers, etc).
Anticipated Data Needs
  • Number and type of ridesharing services within subarea.
  • Count of subarea residents receiving individualized marketing materials.
  • Utilization rates of on-demand services in subarea (finely grained so we know most popular specific nodes within the subarea network).
  • On-demand vehicle operating data (time of use, length of time of use, distance traveled, average speed, fuel/power consumption).
  • Mode share and total trips within subarea.
  • Count of subarea communities with travel option services.
  • The real-time location (visualized via smart-phone app) of the subarea's available on-demand services/vehicles.
  • Wait times for next available on-demand service/vehicle, and related to that, aggregated data on latencies in the system (pick-up latencies, travel latencies, drop-off latencies). This contributes to getting us to a median latency and in turn allows users to see 'wait-time' and plan their (presumed) walking trip to a node.
  • Walking distances between MoD services.
Data Resources and Partners Data resources may include employer surveys of employee commuting programs, household travel behavior surveys (for commute mode choice, frequency of trip making, and vehicle occupancy), and data from the US Census Bureau, Department of Labor, and business licensing bureaus. Partners include rideshare organizations, travel demand management programs, transit agencies, State and local DOTs, non-auto advocacy groups, research firms, and commuters. Resources include the data generated by on-demand vehicles and connected devices (e.g. people's smartphones).
TSMO Strategies to Consider Key strategies include promoting ridesharing, bicycle sharing, commuter shuttle service and using a targeted marketing strategy to make travelers aware of all the options.

Transportation Demand Management: Parking Management

This objective set focuses on active management of parking resources. Parking management includes parking facilities, street parking, associated parking regulations, motor vehicles, freight vehicles, shared vehicles and bicycles. Additional freight strategies are provided in the next section on goods movement.74

Stakeholders
  • State, county, or city agency responsible for roadways.
  • Parking providers (infrastructure).
  • Parking authorities (policy).
  • MPOs, if there are any regional rideshare or travel demand programs.
  • Urban designers.
  • Transportation network companies (e.g. Uber, Lyft, Zipcar, car2go).
  • Bicycle share operators (e.g. Citi Bike, Divvy, Spinlister, B-cycle).
  • Traffic management center(s).
  • Transit agencies.
  • Local businesses, freight distribution centers, business improvement districts, event centers, and neighborhood associations.
  • Ports, if applicable.
  • Media.
  • Travelers.
Goals
  • Manage parking resources more intelligently, equitably, and efficiently
Subarea Operations Objectives
  • Implement shared parking for X subarea communities every Y years.
  • Implement parking pricing for X subarea communities every Y years.
  • Install parking meters along X subarea corridors by year Y in the urban core/transit supportive areas.
  • Increase the number of subarea residents/commuters receiving information on parking pricing and availability within Y years.
  • Increase subarea park-and-ride lot capacity by X percent over Y years.
  • Biannually increased subarea preferred parking spaces for carpool/vanpool participants within downtown, at special events, and among major employers by X percent within Y years.
  • Implement parking policies to encourage the provision of mobility on demand services within Y years.
  • Implement complimentary data collection systems that inform land-use and other parking-related policies for X subarea communities within Y years.
Performance Measures
  • Number of shared-use parking stalls within subarea.
  • Number of shared-use bicycle parking spaces at defined transportation notes within subarea.
  • Number of priced parking stalls within subarea.
  • Number of corridors within subarea urban core/transit supportive areas with parking meters.
  • Number of residents/commuters receiving information on parking pricing and availability within subarea.
  • Capacity of park and ride lots within subarea.
  • Number of preferred parking spaces for carpool/vanpool participants within subarea.
  • Wait time for available parking spaces within subarea.
Anticipated Data Needs
  • Count of shared-use parking (vehicles and bicycles) and priced parking stalls within subarea.
  • Count of corridors with parking meters within subarea.
  • Count of residents/commuters exposed to parking information within subarea.
  • Park and ride lot capacity data within subarea.
  • Count of preferred parking spaces within subarea.
  • Parking wait time within subarea.
Data Resources and Partners Data will most likely come from employers, county and city transportation agencies, transit agencies, parking facility operators, and special event managers. Data resources include connected vehicles (CV) and devices. CV potentially allows collection of data on time vehicles are driven in search for parking, and where they search. Smart cities allow collection of parking spot utilization rates (and times), which speaks to supply/demand information that informs land-use & zoning decisions related to parking capacity.
TSMO Strategies to Consider TSMO strategies to consider include shared parking facilities, parking pricing, increased park and ride lot capacity, preferred parking spaces for carpool/ vanpool participants, and traveler information dissemination related to parking availability and pricing. CV data collection and integration strategy.

Transit Operations and Management: Transit Signal Priority

This objective set focuses on improving the efficiency and reliability for urban goods movement and delivery.75, 76

Stakeholders
  • State, county, or city agency responsible for roadways.
  • MPOs, if there are any regional travel demand programs.
  • Traffic management center(s).
  • Freight industry (can include shippers, carriers, importers, drayage, package delivery companies such as UPS and FedEx).
  • State trucking association.
  • Transportation network companies (e.g. Uber, B-Line).
  • Ports.
  • Local businesses, freight distribution centers, event centers, and neighborhood associations.
  • Media.
Goals
  • Manage subarea transportation system resources to optimize the efficiency and reliability of goods movement within subareas.
Subarea Operations Objectives
  • Minimize travel time delay on key goods movement routes.
  • Reduce variability in travel time on key goods movement routes.
  • Minimize the impact of non-recurring delay on key goods movement routes.
  • Increase efficiency of on-street parking and loading activity.
Performance Measures
  • Average travel time on key goods movement routes during peak and off peak periods (minutes).
  • Buffer time index on key goods movement routes during peak and off-peak travel periods.
  • Total truck hours of delay within subarea by time period (peak, off-peak) caused by:
    • Scheduled events (i.e. work zones, system maintenance, special events) by X hours in Y years.
    • Unscheduled disruptions to travel (i.e. crashes, weather, debris) by X hours in Y years.
  • Availability of parking and loading zones located at optimal node locations in a subarea.
Anticipated Data Needs
  • Vehicle classification counts on key routes in sub-area.
  • Time of day travel time and speeds.
  • On and off-street loading zone locations.
  • Node utilization rates (an understanding of the most in-demand nodes within a subarea: those places that generate the most demand for goods movement trips (delivery/pickup).
Data Resources and Partners State DOTs, counties, cities, traffic management centers, and private sector sources can provide travel time data including speeds and volumes. Agencies can also provide vehicle classification count data and on-street loading zone information. Non-recurring data from incidents, planned events, and weather can be provided by both agency and private sources. American Trucking Research Institute (ATRI) and Federal Highway Administration (FHWA) Freight Analysis Framework are sources of origin-destination and commodity flow data.
TSMO Strategies to Consider Strategies designed to improve travel flow for trucks including traffic signal coordination, truck priority signals, weight-in-motion stations. Travel information, road weather management, and traffic incident management that address non-recurring travel delay. Transportation demand strategies that encourage shifts in person travel mode, time or route can open capacity for goods movement travel in a subarea.

Active Transportation and Demand Management

This objective set focuses on actively influencing traveler choices to better manage travel supply and demand. Active management includes proactive, predictive, and reactive elements.77, 78

Stakeholders
  • State, county, or city agency responsible for roadways.
  • Toll authorities.
  • Parking providers.
  • MPOs, if there are any regional rideshare or travel demand programs.
  • Transportation network companies.
  • Traffic management center(s).
  • Transit agencies.
  • Law enforcement.
  • Local businesses, freight distribution centers, event centers, and neighborhood associations.
  • Ports, if applicable.
  • Media.
  • Travelers.
Goals
  • Actively manage travel supply and demand, traffic operations, and parking by influencing traveler choices related to destination, time of day, mode, route, and facility/lane to improve system efficiency and reliability.
Subarea Operations Objectives
  • Increase the amount of subarea travelers receiving information on active transportation and demand management (ATDM) strategies by X percent within Y years.
  • Increase customer satisfaction with ATDM efforts by X percent over Y years.
  • Improve average subarea travel time during peak periods by X percent by year Y. Reduce subarea trips per year by X percent through dynamic ridesharing and active transit management within Y years.
  • Increase the percentage of subarea travelers with electronic toll collection (ETC) transponders by X percent by year Y.
  • Increase the share of subarea routes or lanes that are using dynamic pricing to X percent by year Y.
  • Reduce the number of congestion-inducing crashes occurring within subarea roadways and at subarea freeway ramps by X percent by year Y.
  • Implement active parking management for X percent of the subarea within Y years.
Performance Measures
  • Total number of subarea travelers and percent receiving information on ATDM strategies.
  • Percentage of customers satisfied with subarea ATDM practices.
  • Average subarea travel time during peak periods (minutes).
  • Share of household trips by each mode of travel before and after availability of dynamic ridesharing and active transit management.
  • Percentage of subarea travelers with ETC transponders.
  • Share of subarea routes or lane miles using dynamic pricing.
  • Total number of congestion-inducing crashes within subarea roadways and at freeway ramps (per year).
  • Percent of subarea parking stalls with active parking management.
Anticipated Data Needs
  • Survey/count of travelers exposed to ATDM information.
  • Customer satisfaction surveys.
  • Subarea peak period and free flow travel times and speeds.
  • Person travel time along subarea links (e.g. vehicle volume multiplied by vehicle occupancy) during free flow conditions and congested conditions.
  • Trip length.
  • Mode share and total trips for subarea.
  • Total number of subarea users (annually) with ETC transponders.
  • System information (e.g. miles of dynamically priced lanes or facilities).
  • Total number of congested-related crashes by location within subarea.
  • Count of total and actively managed parking stalls.
Data Resources and Partners Data will need to be gathered from transportation management centers, State DOTs, cities, counties, toll authorities, transit agencies, and parking providers.
TSMO Strategies to Consider

There are numerous TSMO strategies to consider to achieve ATDM objectives. The strategies are typically categorized as they relate to demand, traffic, or parking:

Active Demand Management:

  • Subarea monitoring.
  • Subarea specific traveler information (including predictive information).
  • Dynamic ridesharing.
  • Active transit management: dynamic fare reduction, dynamic transit capacity assignment, on-demand transit, transfer connection protection.
  • Dynamic/congestion pricing (also electronic toll collection).

Active Traffic Management:

  • Adaptive ramp metering.
  • Dynamic re-routing.
  • Dynamic truck restrictions.

Active Parking Management:

  • Dynamic overflow transit parking.
  • Dynamic parking reservation.
  • Dynamic wayfinding.
  • Dynamically priced parking.

Automated enforcement may also be considered to complement some of the strategies such as dynamic pricing.

35 For more information, see: Federal Highway Administration and Federal Transit Administration, Advancing Metropolitan Planning for Operations: An Objectives-Driven, Performance-Based Approach - A Guidebook. Available at: https://ops.fhwa.dot.gov/publications/fhwahop10026/. [ Return to note 35. ]

36 For more information, see: Metro, Regional Transportation System Management and Operations: 2010-2020. Available at: http://www.oregonmetro.gov/sites/default/files/062010_regional_transportation_system_management_operations_plan_executive_summary.pdf. [ Return to note 36. ]

37 For more information, see: Florida Department of Transportation, Transportation System Management & Operations. Available at: http://www.dot.state.fl.us/trafficoperations/TSMO/TSMO-home.shtm. [ Return to note 37. ]

38 For more information, see: Federal Highway Administration, The Regional Concept for Transportation Operations: A Practitioner's Guide. Available at: https://ops.fhwa.dot.gov/publications/fhwahop11032/. [ Return to note 38. ]

39 For suggested stakeholders based on operational objectives, see: Federal Highway Administration and Federal Transit Administration, Advancing Metropolitan Planning for Operations: An Objectives-Driven, Performance-Based Approach - A Guidebook, FHWA-HOP-10-026 (Washington, DC: 2010). Available at: https://ops.fhwa.dot.gov/publications/fhwahop10026/. [ Return to note 39. ]

40 For more information, see: Federal Highway Administration, The Collaborative Advantage: Realizing the Tangible Benefits of Regional Transportation Operations Collaboration, FHWA-HOP-08-001 (Washington, DC: August 2007). Available at: https://ops.fhwa.dot.gov/publications/benefits_guide/index.htm. [ Return to note 40. ]

41 Federal Highway Administration, Regional Transportation Operations Collaboration and Coordination: A Primer for Working Together to Improve Transportation Safety, Reliability, and Security, FHWA-OP-03-008 (Washington, DC: 2003). [ Return to note 41. ]

42 Wisconsin Department of Transportation, WisDOT Traffic Operations Infrastructure Plan, April 2008. Available at: http://www.topslab.wisc.edu/its/toip/Final%20Reports/WisDOT_TOIP_ExecutiveSummary.pdf. [ Return to note 42. ]

43 New Jersey Transportation Planning Authority, The Connected Corridor: Final Report: New Jersey's TSM&O Strategic Plan and ITS Architecture. Prepared by CH2M in association with Advantage Engineering Associates, December 2014. Available at: http://www.njtpa.org/planning/regional-studies/intelligent-transportation/theconnectedcorridor.aspx. [ Return to note 43. ]

44 Atlanta Regional Commission, Atlanta Regional Transportation Demand Management Plan, 2013. Available at: http://www.atlantaregional.com/transportation/commute-options/regional-tdm-plan. [ Return to note 44. ]

45 Federal Highway Administration, "Business Process Frameworks for Transportation Operations" Web page. Available at: https://ops.fhwa.dot.gov/tsmoframeworktool/index.htm. [ Return to note 45. ]

46 For more information, see: Federal Highway Administration, Advancing Metropolitan Planning for Operations: An Objectives-Driven, Performance-Based Approach - A Guidebook. Available at: https://ops.fhwa.dot.gov/publications/fhwahop10026/index.htm. [ Return to note 46. ]

47 See Federal Highway Administration, "Active Transportation Demand Management" Web page. Available at: https://ops.fhwa.dot.gov/atdm/index.htm. [ Return to note 47. ]

48 City of Salem, Transportation System Plan, February 2016. Available at: http://www.cityofsalem.net/Departments/PublicWorks/TransportationServices/TransportationPlan/Pages/default.aspx . [ Return to note 48. ]

49 49 For these examples, see Federal Highway Administration, Advancing Metropolitan Planning for Operations: An Objectives-Driven, Performance-Based Approach - A Guidebook, "Chapter 3. 3.0 Developing Operations Goals and Objectives," Section 3.1 Develop Operations Goals, FHWA-HOP-10-026 (Washington, DC: 2010). Available at: https://ops.fhwa.dot.gov/publications/fhwahop10026/chap_3.htm#s31. [ Return to note 49. ]

50 See: Federal Highway Administration and Federal Transit Administration, Advancing Metropolitan Planning for Operations: The Building Blocks of a Model Transportation Plan Incorporating Operations - A Desk Reference, FHWA-HOP-10-027 (Washington, DC: 2010). Available at: https://ops.fhwa.dot.gov/publications/fhwahop10027/. [ Return to note 50. ]

51 Federal Highway Administration, The Role of Transportation Systems Management & Operations in Supporting Livability and Sustainability - A Primer, January 2012, FHWA-HOP-12-004. Available at https://ops.fhwa.dot.gov/publications/fhwahop12004/index.htm. [ Return to note 51. ]

52 City of Salem, Oregon, Salem Transportation System Plan, Amended February 2016. Available at: http://www.cityofsalem.net/Departments/PublicWorks/TransportationServices/TransportationPlan/Pages/default.aspx. [ Return to note 52. ]

53 Ibid. [ Return to note 53. ]

54 City of Salem, Oregon, Salem Transportation System Plan, February 2016. Available at: http://www.cityofsalem.net/Departments/PublicWorks/TransportationServices/TransportationPlan/Pages/default.aspx. [ Return to note 54. ]

55 See Dakota County, Minnesota, Dakota County 2030 Transportation Plan, 2010, at https://www.co.dakota.mn.us/Transportation/PlanningPrograms/Documents/2030TransportationPlan.pdf, for the entire Dakota County Transportation Plan, which includes detailed descriptions of their goals and related strategies and policies. [ Return to note 55. ]

56 Tool for Operations Benefit Cost Analysis can be downloaded from: https://ops.fhwa.dot.gov/plan4ops/topsbctool/index.htm. [ Return to note 56. ]

57 Transportation Research Board, Highway Capacity Manual 2010 (Washington, DC: 2010). Available from: http://www.trb.org/Main/Blurbs/164718.aspx. [ Return to note 57. ]

58 Transportation Research Board, Strategic Highway Research Program, Guide to Incorporating Reliability Measures into the Transportation Planning and Programming Processes (Washington, DC: 2014). Available at: http://onlinepubs.trb.org/onlinepubs/shrp2/SHRP2_S2-L05-RR-2.pdf. [ Return to note 58. ]

59 Federal Highway Administration and Federal Transit Administration, Advancing Metropolitan Planning for Operations: The Building Blocks of a Model Transportation Plan Incorporating Operations - A Desk Reference, FHWA-HOP-10-027 (Washington, DC: 2010). Available at: https://ops.fhwa.dot.gov/publications/fhwahop10027/. [ Return to note 5. ]

60 U.S. Department of Transportation, Federal Highway Administration and Federal Transit Administration, Advancing Metropolitan Planning for Operations: The Building Blocks of a Model Transportation Plan Incorporating Operations - A Desk Reference, 2010, FHWA-HOP-10-027. Available at: https://ops.fhwa.dot.gov/publications/fhwahop10027/. [ Return to note 60. ]

61 U.S. Department of Transportation, Federal Highway Administration and Federal Transit Administration, Advancing Metropolitan Planning for Operations: The Building Blocks of a Model Transportation Plan Incorporating Operations - A Desk Reference, 2010, FHWA-HOP-10-027. Available at: https://ops.fhwa.dot.gov/publications/fhwahop10027/. [ Return to note 61. ]

62 U.S. Department of Transportation, Federal Highway Administration and Federal Transit Administration, Advancing Metropolitan Planning for Operations: The Building Blocks of a Model Transportation Plan Incorporating Operations - A Desk Reference, 2010, FHWA-HOP-10-027. Available at: https://ops.fhwa.dot.gov/publications/fhwahop10027/. [ Return to note 62. ]

63 U.S. Department of Transportation, Federal Highway Administration and Federal Transit Administration, Advancing Metropolitan Planning for Operations: The Building Blocks of a Model Transportation Plan Incorporating Operations - A Desk Reference, 2010, FHWA-HOP-10-027. Available at: https://ops.fhwa.dot.gov/publications/fhwahop10027/. [ Return to note 63. ]

64 U.S. Department of Transportation, Federal Highway Administration and Federal Transit Administration, Advancing Metropolitan Planning for Operations: The Building Blocks of a Model Transportation Plan Incorporating Operations - A Desk Reference, 2010, FHWA-HOP-10-027. Available at: https://ops.fhwa.dot.gov/publications/fhwahop10027/. [ Return to note 64. ]

65 U.S. Department of Transportation, Federal Highway Administration and Federal Transit Administration, Advancing Metropolitan Planning for Operations: The Building Blocks of a Model Transportation Plan Incorporating Operations - A Desk Reference, 2010, FHWA-HOP-10-027. Available at: https://ops.fhwa.dot.gov/publications/fhwahop10027/. [ Return to note 65. ]

66 U.S. Department of Transportation, Federal Highway Administration and Federal Transit Administration, Advancing Metropolitan Planning for Operations: The Building Blocks of a Model Transportation Plan Incorporating Operations - A Desk Reference, 2010, FHWA-HOP-10-027. Available at: https://ops.fhwa.dot.gov/publications/fhwahop10027/. [ Return to note 66. ]

67 U.S. Department of Transportation, Federal Highway Administration and Federal Transit Administration, Advancing Metropolitan Planning for Operations: The Building Blocks of a Model Transportation Plan Incorporating Operations - A Desk Reference, 2010, FHWA-HOP-10-027. Available at: https://ops.fhwa.dot.gov/publications/fhwahop10027/. [ Return to note 67. ]

68 U.S. Department of Transportation, Federal Highway Administration and Federal Transit Administration, Advancing Metropolitan Planning for Operations: The Building Blocks of a Model Transportation Plan Incorporating Operations - A Desk Reference, 2010, FHWA-HOP-10-027. Available at: https://ops.fhwa.dot.gov/publications/fhwahop10027/. [ Return to note 68. ]

69 U.S. Department of Transportation, Federal Highway Administration and Federal Transit Administration, Advancing Metropolitan Planning for Operations: The Building Blocks of a Model Transportation Plan Incorporating Operations - A Desk Reference, 2010, FHWA-HOP-10-027. Available at: https://ops.fhwa.dot.gov/publications/fhwahop10027/. [ Return to note 69. ]

70 U.S. Department of Transportation, Federal Highway Administration and Federal Transit Administration, Advancing Metropolitan Planning for Operations: The Building Blocks of a Model Transportation Plan Incorporating Operations - A Desk Reference, 2010, FHWA-HOP-10-027. Available at: https://ops.fhwa.dot.gov/publications/fhwahop10027/. [ Return to note 70. ]

71 U.S. Department of Transportation, Federal Highway Administration and Federal Transit Administration, Advancing Metropolitan Planning for Operations: The Building Blocks of a Model Transportation Plan Incorporating Operations - A Desk Reference, 2010, FHWA-HOP-10-027. Available at: https://ops.fhwa.dot.gov/publications/fhwahop10027/. [ Return to note 71. ]

72 U.S. Department of Transportation, Federal Highway Administration and Federal Transit Administration, Advancing Metropolitan Planning for Operations: The Building Blocks of a Model Transportation Plan Incorporating Operations - A Desk Reference, 2010, FHWA-HOP-10-027. Available at: https://ops.fhwa.dot.gov/publications/fhwahop10027/. [ Return to note 72. ]

73 U.S. Department of Transportation, Mobility on Demand (MOD) Fact Sheet #1: Overview. Available at: http://www.its.dot.gov/factsheets/pdf/MobilityonDemand.pdf. [ Return to note 73. ]

74 U.S. Department of Transportation, Federal Highway Administration and Federal Transit Administration, Advancing Metropolitan Planning for Operations: The Building Blocks of a Model Transportation Plan Incorporating Operations - A Desk Reference, 2010, FHWA-HOP-10-027. Available at: https://ops.fhwa.dot.gov/publications/fhwahop10027/. [ Return to note 74. ]

75 U.S. Department of Transportation, Federal Highway Administration and Federal Transit Administration, Advancing Metropolitan Planning for Operations: The Building Blocks of a Model Transportation Plan Incorporating Operations - A Desk Reference, 2010, FHWA-HOP-10-027. Available at: https://ops.fhwa.dot.gov/publications/fhwahop10027/. [ Return to note 75. ]

76 Frost & Sullivan, Uber for Trucks: Executive Analysis of the North American Mobile-based Freight Brokerage Market. Available at: http://www.frost.com/sublib/display-report.do?id=NF61-01-00-00-00&src=PR. [ Return to note 76. ]

77 U.S. Department of Transportation, Federal Highway Administration and Federal Transit Administration, Advancing Metropolitan Planning for Operations: The Building Blocks of a Model Transportation Plan Incorporating Operations - A Desk Reference, 2010, FHWA-HOP-10-027. Available at: https://ops.fhwa.dot.gov/publications/fhwahop10027/. [ Return to note 77. ]

78 U.S. Department of Transportation, Federal Highway Administration, Active Transportation and Demand Management Program. Available at: https://ops.fhwa.dot.gov/atdm/index.htm. [ Return to note 78. ]

Office of Operations