Public Perception of Safety Messages and Public Service Announcements on Dynamic Message Signs in Rural Areas
Chapter 5. Findings and Recommendations
This section summarizes the analysis findings for each hypothesis, provides the conclusions from the evaluation, and present recommendations for displaying public service announcements (PSAs) and safety messages on dynamic message signs (DMS) in rural areas, as well as future research needs or recommendations for changes in key reference documents.
Study Findings
Safety Campaign Messages Posted During this Study
The displayed information type changed by site and round (R1, R2, R3) as shown in Table 3. Seatbelt-related messages were the most common message campaign theme for the four sites during the data collection period, followed by general safety information. Note that only catchy messages were shown for the duration of survey activities in Missouri. As such, this presents an opportunity to examine the possible impacts of catchy versus traditional messages on DMS. However, it is important to keep in mind a variety of factors that could cause bias, including geographic differences, site characteristics, the relative proximity of the DMS to the survey, and the safety campaign or PSA type being displayed.
| State, Corridor | Survey Round, 2015 Dates | Safety Campaign Message Content* | Information Type |
|---|---|---|---|
| Nevada, I-80 | R1: 5/4-5/7;R2: 10/5-10/7 | OUR GOAL IS ZERO FATALITIES ON NEVADA ROADS | General Safety |
| Nevada, I-80 | R1: 5/4-5/7;R2: 10/5-10/7 | DRIVE SAFELY MAKE IT ZERO FATALITIES | General Safety |
| Minnesota/Wisconsin, I-94 | R1: 5/26-5/28 | EXTRA SEAT BELT PATROLS NOW, CLICK IT OR TICKET | Seatbelt |
| Minnesota/Wisconsin, I-94 | R1: 5/26-5/28 | BUCKLE UP, __ TRAFFIC DEATHS THIS YEAR | Seatbelt |
| Minnesota/Wisconsin, I-94 | R2: 9/15-9/17;R3: 10/26-10/29 | WI REMINDS YOU TO MOVE OVER FOR EMERGENCY VEHICLES | Mixed: Seatbelt, Distracted Driving, DUI, EMS |
| Minnesota/Wisconsin, I-94 | R2: 9/15-9/17;R3: 10/26-10/29 | BUCKLE UP, __ TRAFFIC DEATHS THIS YEAR | Mixed: Seatbelt, Distracted Driving, DUI, EMS |
| Minnesota/Wisconsin, I-94 | R2: 9/15-9/17;R3: 10/26-10/29 | JUST DRIVE, TEXTING CAN WAIT | Mixed: Seatbelt, Distracted Driving, DUI, EMS |
| Minnesota/Wisconsin, I-94 | R2: 9/15-9/17;R3: 10/26-10/29 | PLAN AHEAD DESIGNATE A SOBER DRIVER | Mixed: Seatbelt, Distracted Driving, DUI, EMS |
| Kansas, I-70 | R1: 7/6-7/9 | MOVE OVER FOR HIGHWAY WORKERS | Work zone/EMS |
| Kansas, I-70 | R1: 7/6-7/9 | MOVE OVER FOR EMERGENCY VEHICLES | Work zone/EMS |
| Kansas, I-70 | R2: 9/8-9/11 | DON’T DRIVE DRUNK, ALCOHOL LAWS ENFORCED | DUI and EMS |
| Kansas, I-70 | R2: 9/8-9/11 | MOVE OVER FOR EMERGENCY VEHICLES | DUI and EMS |
| Missouri**, I-44 | R1: 7/13-7/15 | It's a Passing Lane…Not a Cruising Lane | Safe driving and Seatbelt |
| Missouri**, I-44 | R1: 7/13-7/15 | Pass on Left, Drive on Right | Safe driving and Seatbelt |
| Missouri**, I-44 | R1: 7/13-7/15 | Changing Lanes? Show Me Your Blinker | Safe driving and Seatbelt |
| Missouri**, I-44 | R1: 7/13-7/15 | Turn Signals…The Original Instant Message | Safe driving and Seatbelt |
| Missouri**, I-44 | R1: 7/13-7/15 | Unbuckled? Seriously? | Safe driving and Seatbelt |
| Missouri**, I-44 | R1: 7/13-7/15 | Buckle Up, Windshields Hurt | Safe driving and Seatbelt |
| Missouri**, I-44 | R2: 10/14-10/15 | It's No Trick, Seatbelts Are a Treat | Seatbelt |
| Missouri**, I-44 | R2: 10/14-10/15 | Buckle Up, Have a Nice Day | Seatbelt |
| Missouri**, I-44 | R2: 10/14-10/15 | That Seat Belt Looks Good On You | Seatbelt |
| Missouri**, I-44 | R3: 11/2-11/5 | All Buckled, All Seats, All the Time | Seatbelt |
| Missouri**, I-44 | R3: 11/2-11/5 | That Seat Belt Looks Good On You | Seatbelt |
| Missouri**, I-44 | R3: 11/2-11/5 | Buckle Up, Windshields Hurt | Seatbelt |
| Missouri**, I-44 | R3: 11/2-11/5 | Give Thanks, Buckle Up, Drive Safely | Seatbelt |
| Missouri**, I-44 | R3: 11/2-11/5 | Thanks for Wearing Your Seat Belt | Seatbelt |
| Missouri**, I-44 | R3: 11/2-11/5 | Thanks for Buckling Kids in Car Seats | Seatbelt |
*Messages that were asked to be interpreted during surveys are shown in bold.
**Missouri posts PSAs and safety messages in Title Case, and not ALL CAPS.
Traveler Type Distribution
Table 4 presents the number of travelers encountered during each round of surveying at each location, and whether they took the survey or their reason for not participating. It should be noted that the information presented in the table hints at valuable, but imperfect information. There are a number of reasons for people to refuse to take the survey, and it is possible that travelers say they did not see a DMS just to avoid further engagement with the survey team. In other instances, travelers verbally expressed frustration that they had not seen the DMS, which could be the result of several factors. The DMS in Kansas, Missouri, and Wisconsin are typically placed by the side of the road, the DMS in Nevada were either overhead or in the median, and the DMS in Minnesota were overhead, and a traveler passing or closely following a truck may not see the DMS, for example. In other cases, the survey intercept location may have been further away from the DMS and therefore less memorable to travelers. While distracted driving is an issue and there is an interest in understanding whether signs are not visible to travelers or a distraction that travelers ignore, for example, the focus of this survey effort was to capture feedback based on direct recall of recently seeing the message. As with any similar survey effort, unpleasant weather or a location with busy travelers can cause reduced survey participation, which may vary by corridor or day.
| State | Survey Round | Screener Results (Did not take survey): Refused before determining eligibility | Screener Results (Did not take survey): Eligible and Refused | Screener Results (Did not take survey): Ineligible (did not see DMS) | Screener Results (Did not take survey): Ineligible (did not travel on corridor) | Screener Results (Did not take survey): Other barrier, e.g., language | Screener Results (Did not take survey): Subtotal | Survey Responses | Total Travelers |
|---|---|---|---|---|---|---|---|---|---|
| NV | R1 | 153 | 68 | 84 | 26 | 14 | 345 | 204 | 549 |
| NV | R2 | 23 | 49 | 40 | 2 | 11 | 125 | 93 | 218 |
| MN/WI | R1 | 141 | 91 | 188 | 7 | 3 | 430 | 160 | 590 |
| MN/WI | R2 | 53 | 64 | 62 | 0 | 15 | 194 | 233 | 427 |
| MN/WI | R3 | 352 | 196 | 67 | 1 | 5 | 621 | 289 | 910 |
| KS | R1 | 80 | 125 | 115 | 0 | 5 | 325 | 177 | 502 |
| KS | R2 | 30 | 54 | 31 | 7 | 6 | 128 | 216 | 344 |
| MO | R1 | 141 | 101 | 70 | 0 | 10 | 322 | 181 | 503 |
| MO | R2 | 34 | 59 | 35 | 3 | 7 | 138 | 102 | 240 |
| MO | R3 | 304 | 247 | 200 | 0 | 22 | 773 | 282 | 1055 |
| Total | 1311 | 1054 | 892 | 46 | 98 | 3401 | 1937 | 5338 | |
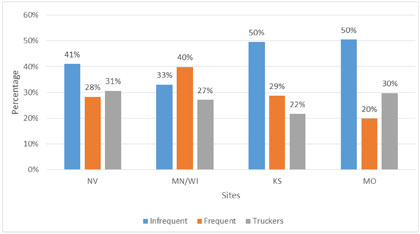
Table 5 and the corresponding Figure 8 summarize survey participants by group for each site. Infrequent travelers comprised the highest percentage of survey participants in Kansas, Missouri, and Nevada. Surveys on these corridors were conducted at rest areas, as these locations seemed to provide the highest volume of travelers to intercept who had actually been on the corridor to see a DMS. Frequent travelers often consist of individuals whose origin and destination are not necessarily directly off of the highway and not far enough apart to merit an en route stop near the highway. Truckers consist of a lower percentage of travelers on each corridor as a whole.
| State | Corridor | Number of Survey Participants: Infrequent | Number of Survey Participants: Frequent | Number of Survey Participants: Truckers | Number of Survey Participants: Total |
|---|---|---|---|---|---|
| Nevada | I-80 | 122 | 84 | 91 | 297 |
| Nevada | I-80 | 41% | 28% | 31% | 100% |
| Minnesota/Wisconsin | I-94 | 225 | 272 | 185 | 682 |
| Minnesota/Wisconsin | I-94 | 33% | 40% | 27% | 100% |
| Kansas | I-70 | 195 | 113 | 85 | 393 |
| Kansas | I-70 | 50% | 29% | 22% | 100% |
| Missouri | I-44 | 285 | 112 | 168 | 565 |
| Missouri | I-44 | 50% | 20% | 30% | 100% |
| OVERALL | 827 | 581 | 529 | 1937 | |
| OVERALL | 43% | 30% | 27% | 100% | |
Note: percentages may not sum to 100 exactly due to rounding.
Gender Distribution
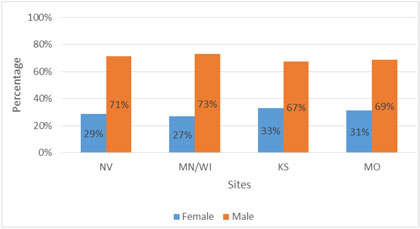
Table 6 and Figure 9 summarize the gender distribution among participants. In all four sites there were significantly more male participants (around 70 percent) than female participants. Anecdotally, this appeared to be reflective of the driving population encountered by the survey team. The proportions of male and female travelers intercepted for each location generally reflect the percentages of survey participants.
| State | Corridor | Number of Survey Participants: Female | Number of Survey Participants: Male | Number of Survey Participants: Total |
|---|---|---|---|---|
| Nevada | I-80 | 85 | 212 | 297 |
| Nevada | I-80 | 29% | 71% | 100% |
| Minnesota/Wisconsin | I-94 | 185 | 497 | 682 |
| Minnesota/Wisconsin | I-94 | 27% | 73% | 100% |
| Kansas | I-70 | 129 | 264 | 393 |
| Kansas | I-70 | 33% | 67% | 100% |
| Missouri | I-44 | 176 | 389 | 565 |
| Missouri | I-44 | 31% | 69% | 100% |
| OVERALL | 575 | 1362 | 1937 | |
| OVERALL | 30% | 70% | 100% | |
Frequency of Seeing General Safety Campaign Messages on DMS
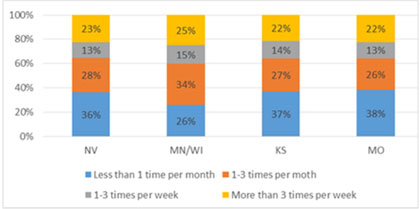
Table 7 and Figure 10 provide the panel composition based on frequency of seeing the safety campaign messages on DMS. Kansas, Missouri, and Nevada survey participants had a very similar distribution in terms of self-reported frequency of seeing safety campaign messages on DMS. In those sites, the highest percentage (around 37 percent) of travelers see safety campaign message on DMS less than one time per month, with the second highest (around 27 percent) at 1-3 times per month. In Minnesota/Wisconsin, the participant groups were roughly switched with the largest group (around 34 percent) being travelers who reported seeing safety campaign message 1-3 times per month, followed by 26 percent of travelers who reported a frequency of less than one time per month. The switch in Minnesota/Wisconsin may reflect the slightly higher proportion of frequent travelers versus infrequent travelers, and the proximity to the Minneapolis-St. Paul metro area where DMS are common.
| State | Corridor | Number and Percentage of Survey Participants: <1 time per month | Number and Percentage of Survey Participants: 1-3 times per month | Number and Percentage of Survey Participants: 1-3 times per week | Number and Percentage of Survey Participants: >3 times per week | Number and Percentage of Survey Participants: Total1 |
|---|---|---|---|---|---|---|
| Nevada | I-80 | 108 | 83 | 38 | 67 | 296 |
| Nevada | I-80 | 36% | 28% | 13% | 23% | 100% |
| Minnesota/Wisconsin | I-94 | 175 | 232 | 104 | 170 | 681 |
| Minnesota/Wisconsin | I-94 | 26% | 34% | 15% | 25% | 100% |
| Kansas | I-70 | 145 | 106 | 56 | 85 | 392 |
| Kansas | I-70 | 37% | 27% | 14% | 22% | 100% |
| Missouri | I-44 | 215 | 147 | 76 | 126 | 564 |
| Missouri | I-44 | 38% | 26% | 13% | 22% | 100% |
| OVERALL | 643 | 568 | 274 | 448 | 1933 | |
| OVERALL | 33% | 29% | 14% | 23% | 100% | |
1Four participants did not provide inputs.
Note: percentages may not sum to 100 exactly due to rounding.
Hypotheses Area and Survey Questions
Table 8 lists the evaluation hypotheses and the related survey questions that were utilized to evaluate the hypotheses.
For each of the hypotheses, the following results begin with a simple summary of responses by site. Following that simple summary, a statistical ANOVA model has been fit to the responses for each question. That model compares the responses under several groupings:
- Traveler type (i.e., infrequent, frequent, truckers).
- Age (i.e., 16-55, over 55).
- Gender.
- Round (i.e., survey responses were evaluated over 2 or 3 rounds of data collection).
- Frequency of seeing DMS messages (i.e., <1 time per month, 1-3 times per month, 1-3 times per week, >3 times per week).
The responses to the survey questions are in the form of percentages. Each survey question either naturally yields a dichotomous response, or has been transformed into one (e.g., scaled response of "Agree" and "Strongly Agree" are added together to generate a single response for "Agree"). When the dichotomous response is fit to the logistic regression statistical model, the estimates for the variables of interest compared between levels are provided as odds ratios. The odds ratio is the probability of being in a class divided by probability of not being in the class for one condition divided by the odds of the comparison condition. The reported odds ratios are accompanied by statistical 95 percent confidence intervals. If estimated odds ratios exceed 1.0, it means the odds of the condition are higher for the comparison group. The converse is true for odds ratios less than 1.0. If the 95 percent confidence interval is either wholly above 1.0 or wholly below 1.0, it provides evidence that the survey data collected identify the difference as significant. The interpretation of the significance is that the data collected provide a probability of no more than one chance in 20 that the difference was due to random chance. Instead, it is highly likely the direction of the observed outcome reflects truth.
For most questions, the statistical models were fit separately for each site. For a few hypotheses, sites were combined.
| Evaluation Area | Hypotheses | Evaluation Questions |
|---|---|---|
| Awareness | A significant percentage of travelers have observed an actual safety message and/or PSA on a DMS | Did you observe one of these safety-related messages on DMS? |
| Understanding | Drivers can understand the messages on the DMS |
What does "*specific message*" mean to you? Do you agree that "*" is understandable? |
| Behavior Changes | The display of a PSA on a DMS does not cause traffic to slow down or other congestion | Have these messages ever caused you to slow down? |
| Behavior Changes | The contents of the PSA cause a change in behavior by the travelers (e.g., more aware, looking for an AMBER alert license plate, etc.) |
After seeing the messages did you do anything differently? Has seeing one of these messages ever caused you to change your driving? |
| Opinions | Travelers believe that DMS for safety awareness and PSA messages are appropriate | Do you agree that the message is appropriate? |
| Opinions | Travelers believe that DMS should only be used for traffic-related messages | What types of message do you think should be displayed on DMS? |
| Opinions | Travelers believe that it would be more effective and/or less distracting to motorists to disseminate safety awareness messages and PSAs via other means | Which way of communicating safety-related information do you think is best? |
| Opinions | Travelers perceive a value of safety awareness and PSA messages on DMS | Do you agree that the message raised your awareness of the issue? |
Evaluation of Awareness
- Hypothesis: A significant percentage of travelers have observed an actual safety message and/or PSA on a DMS.
- Question: Did you observe one of these safety-related messages on DMS?
Because all survey participants already said they had seen a DMS in order to be eligible to take the survey, the number of travelers encountered by survey administrators, presented in Table 4, provide some insight for this hypothesis. In total for all survey rounds, 2991 travelers (77 percent, this number includes the 1937 survey participants and 1054 travelers who were eligible but refused to take the survey), responded that they had seen the DMS, compared with 892 travelers who had not.
Did you observe one of these safety-related messages on the DMS?
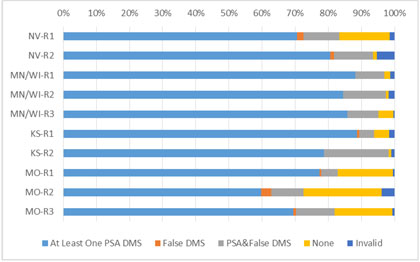
Participants were permitted to select from a list of safety campaign messages that were truly posted, as well as a false message (i.e., "smoking is harmful to your health"). They also were permitted to respond that they had not seen any message. The survey allowed any combination of responses. In summarizing the responses, five mutually exclusive categories were identified. There were some participants whose responses were coded as "invalid", as they selected an illogical option (i.e., selecting "None" and one or more messages at the same time). These data were removed from the modelling dataset, but are included in the Table 5 summary.
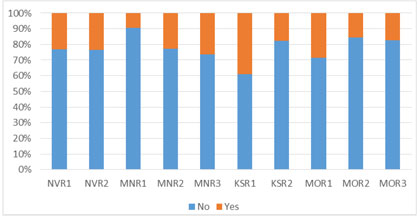
From Table 9 and Figure 11, it can be see that a majority of the participants, between 60 to 89 percent, observed at least one of the specified safety-related messages on DMS, indicating a high awareness level of the posted safety-related messages. Compared with other sites, Missouri appears to have the lowest percentage of participants reporting that they observed at least one of the messages, and the highest percentage of participants who did not see any of the listed messages in the survey. This could be due to several factors, including the fact that a greater number of messages were shown during the survey periods and DMS were further upstream from the survey location in Missouri than at other corridors. Missouri is also the only site where catchy messages were displayed on the DMS.
| State | Round | Number and Percentage of Survey Participants: At Least One True | Number and Percentage of Survey Participants: False Message | Number and Percentage of Survey Participants: True & False | Number and Percentage of Survey Participants: None | Number and Percentage of Survey Participants: Invalid | Number and Percentage of Survey Participants: Number of Participants |
|---|---|---|---|---|---|---|---|
| Nevada | R1 | 71% | 2% | 11% | 15% | 1% | 204 |
| Nevada | R2 | 81% | 1% | 12% | 1% | 5% | 93 |
| Minnesota/Wisconsin | R1 | 88% | 0% | 9% | 2% | 1% | 160 |
| Minnesota/Wisconsin | R2 | 85% | 0% | 13% | 1% | 2% | 233 |
| Minnesota/Wisconsin | R3 | 86% | 0% | 9% | 5% | 0% | 289 |
| Kansas | R1 | 89% | 1% | 5% | 5% | 2% | 177 |
| Kansas | R2 | 79% | 0% | 19% | 1% | 1% | 216 |
| Missouri | R1 | 77% | 1% | 5% | 17% | 1% | 181 |
| Missouri | R2 | 60% | 3% | 10% | 24% | 4% | 102 |
| Missouri | R3 | 70% | 1% | 12% | 17% | 1% | 282 |
| All Participants |
1529 (79%) |
12 (1%) |
206 (11%) |
163 (8%) |
27 (1%) |
1937 | |
Note: At least one true = the participant reported to have observed at least one of the true DMS message listed in Table 3, and not the false message ("smoking is harmful to your health").
False message = only the false message ("smoking is harmful to your health") was chosen by the participant.
True & False = the participant chose both the false message and one or more of the true messages.
None = the participant indicated that they did not observe any of the messages listed in the question.
Invalid = the participant chose both "None" and one or more of the listed messages.
Percentages may not sum to 100 exactly due to rounding.
For modeling purposes, participant responses were grouped into two categories. The first category was participants who observed at least one (true) safety-related message, while other types of responses were aggregated as the second category. A binary logistic regression model was fit with traveler type, age, gender, round, and frequency of seeing a safety-related message during general travels as the predictors. The modeled probability was of observing at least one of the (true) listed safety-related messages.
Table 10 below and Figure C-1 through Figure C-4 in Appendix C show the estimated odds ratios and confidence intervals from the model. Infrequent travelers had higher levels of awareness in Kansas, Minnesota/Wisconsin, and Nevada followed by frequent travelers, while truckers had the lowest awareness level. However, the differences were not statistically significant in either Kansas or Minnesota/Wisconsin; infrequent travelers reported statistically significantly higher awareness level than truckers in Nevada. Anecdotally, truckers commented more than other travelers that DMS messages were a waste of money or not relevant to them. Missouri had a different pattern, with infrequent travelers having significantly lower awareness level than frequent travelers. This could be the result of the relatively longer distance of the DMS from the survey location and fewer rural DMS located upstream of the Missouri survey location than in other corridors.
Younger travelers tended to report a higher awareness of the listed safety-related message for all four sites. However, only in Minnesota/Wisconsin was a statistically significant difference found.
The impact of gender varied, but was found to be significant in Nevada, where females were found to be significantly less aware of the listed safety-related message than males.
Survey date/round had significant impacts for all sites other than Minnesota/Wisconsin for unknown reasons, but the direction of the conclusion varied. Response levels did not appear to be impacted significantly as a function of how often DMS signs were reported to be seen.
| Label | NV | MN/WI | KS | MO |
|---|---|---|---|---|
| TravelerType 1 vs 2 | 1.5 (0.7, 3.3) | 1.1 (0.6, 2.1) | 1.3 (0.6, 2.6) | 0.5 (0.3, 0.9) |
| TravelerType 1 vs 3 | 2.6 (1.1, 6.2) | 1.5 (0.7, 3.0) | 2.2 (0.9, 5.0) | 0.7 (0.4, 1.1) |
| TravelerType 2 vs 3 | 1.8 (0.8, 3.8) | 1.3 (0.7, 2.4) | 1.7 (0.9, 4.0) | 1.4 (0.7, 2.6) |
| Age 1 vs 2 | 1.5 (0.8, 2.8) | 2.5 (1.5, 4.2) | 1.8 (1.0, 3.4) | 1.3 (0.9, 2.0) |
| Gender Female vs Male | 0.5 (0.3, 1.0) | 1.7 (1.0, 3.0) | 1.2 (0.6, 2.2) | 0.9 (0.6, 1.4) |
| Round R1 vs R2 | 0.4 (0.2, 0.9) | 1.2 (0.6, 2.3) | 2.9 (1.5, 5.4) | 2.0 (1.1, 3.5) |
| Round R1 vs R3 | 1.2 (0.6, 2.2) | 1.5 (0.9, 2.3) | ||
| Round R2 vs R3 | 1.0 (0.6, 1.7) | 0.7 (0.5, 1.2) | ||
| DMSFrequency 1 vs 2 | 0.7 (0.3, 1.7) | 0.9 (0.5, 1.7) | 1.4 (0.7, 3.0) | 0.8 (0.5, 1.3) |
| DMSFrequency 1 vs 3 | 0.6 (0.3, 1.3) | 0.8 (0.4, 1.6) | 0.9 (0.4, 1.9) | 0.8 (0.5, 1.4) |
| DMSFrequency 2 vs 3 | 0.8 (0.4, 1.6) | 0.9 (0.5, 1.7) | 0.7 (0.3, 1.3) | 1.1 (0.6, 1.8) |
Note: TravelerType 1 = Infrequent, TravelerType 2 = Frequent, TravelerType 3 = Truckers; Age 1 = 16-55, age 2 = Over 55; DMSFrequency 1 = Less than 1 time per month, DMSFrequency 2 = 1-3 times per month, DMSFrequency 3 = One or more times per week.
Value in bold means that the odds ratio is significantly different than 1.
Evaluation of Understanding
- Hypothesis: Drivers can understand the messages on the DMS.
- Question: What does "*specific message*" mean to you?
- Question: Do you agree that “*” is understandable?
What does the identified message mean to you?
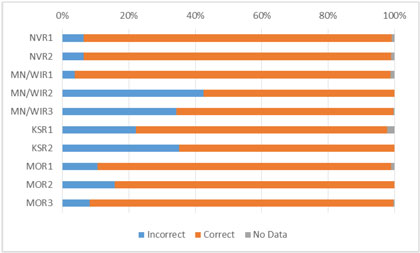
Survey participants were asked to select from multiple choice options to determine if they understood the meaning of one of the safety messages currently being displayed in the corridor. For each site and survey round, different message were selected for the participant to interpret. As shown in Table 11, most travelers correctly interpreted the messages posted during each survey round for each corridor. Minnesota/Wisconsin Round #1 had the highest correct interpretation rate at 95 percent when asked to correctly interpret "Click it or ticket." However, Minnesota/Wisconsin also had the lowest correct interpretation rate (58 percent) at Round 2 when asked to correctly interpret, "WI REMINDS YOU TO MOVE OVER FOR EMERGENCY VEHICLES."
| State | Round | Number and Percentage of Survey Participants: Incorrect | Number and Percentage of Survey Participants: Correct | Number and Percentage of Survey Participants: No Data | Number and Percentage of Survey Participants: Total |
|---|---|---|---|---|---|
| Nevada | R1 | 6% | 93% | 1% | 204 |
| Nevada | R2 | 6% | 92% | 1% | 93 |
| Minnesota/Wisconsin | R1 | 4% | 95% | 1% | 160 |
| Minnesota/Wisconsin | R2 | 42% | 58% | 0% | 233 |
| Minnesota/Wisconsin | R3 | 34% | 65% | 0% | 289 |
| Kansas | R1 | 22% | 76% | 2% | 177 |
| Kansas | R2 | 35% | 65% | 0% | 216 |
| Missouri | R1 | 11% | 88% | 1% | 181 |
| Missouri | R2 | 16% | 84% | 0% | 102 |
| Missouri | R3 | 8% | 91% | 0% | 282 |
| All Participants | 396 (20%) | 1528 (79%) | 13 (1%) | 1937 | |
A binary logistic model was fit to the data with the probability of understanding the identified message correctly as the response and traveler type, age, gender, round, and frequency of seeing safety-related message during general travels as the predictors as shown in Table 12 and Figure C-5 through Figure C-8 in Appendix C. No statistically significant impacts were found in either Kansas or Minnesota/Wisconsin corridors. In Nevada, truckers were found to have a significantly lower understanding level than both infrequent travelers and frequent travelers. In Missouri, infrequent travelers' understanding of the identified message was significantly lower than frequent travelers. This may be a result of frequent drivers being more familiar with the catchy messages posted in Missouri.
Only in Minnesota/Wisconsin was a statistically significant impact of age observed where younger travelers understood the identified message better. Females were found to understand the identified message significantly better than male travelers in Missouri and Nevada.
An interesting finding is that the traveler frequency of seeing safety-related messages on DMS was positively correlated with their understanding of the identified message in each site.
| Label | NV | MN/WI | KS | MO |
|---|---|---|---|---|
| TravelerType 1 vs 2 | 0.8 (0.2, 2.9) | 0.8 (0.6, 1.1) | 1.0 (0.6, 1.4) | 0.5 (0.2, 0.9) |
| TravelerType 1 vs 3 | 4.5 (1.7, 11.9) | 0.8 (0.6, 1.2) | 1.0 (0.6, 1.6) | 0.7 (0.4, 1.3) |
| TravelerType 2 vs 3 | 5.4 (1.7, 17.0) | 1.0 (0.7, 1.4) | 1.1 (0.6, 1.7) | 1.6 (0.8, 3.1) |
| Age 1 vs 2 | 1.2 (0.6, 2.5) | 1.5 (1.2, 2.0) | 1.3 (0.9, 1.8) | 0.8 (0.6, 1.3) |
| Gender Female vs Male | 5.9 (1.3, 25.8) | 1.0 (0.7, 1.3) | 1.2 (0.9, 1.7) | 2.6 (1.5, 4.3) |
| Round R1 vs R2 | 0.9 (0.4, 2.0) | 19.2 (10.4, 35.4) | 1.9 (1.4, 2.6) | 1.4 (0.9, 2.4) |
| Round R1 vs R3 | 13.8 (7.5, 25.4) | 0.7 (0.5, 1.1) | ||
| Round R2 vs R3 | 0.7 (0.6, 0.9) | 0.5 (0.3, 0.8) | ||
| DMSFrequency 1 vs 2 | 0.4 (0.1, 0.9) | 0.7 (0.5, 0.9) | 0.6 (0.4, 1.0) | 0.5 (0.3, 0.9) |
| DMSFrequency 1 vs 3 | 0.2 (0.1, 0.6) | 0.8 (0.5, 1.1) | 0.6 (0.4, 0.9) | 0.5 (0.3, 0.9) |
| DMSFrequency 2 vs 3 | 0.6 (0.2, 1.5) | 1.2 (0.8, 1.6) | 0.9 (0.6, 1.4) | 1.0 (0.6, 1.9) |
| R1 Specified Message | OUR GOAL IS ZERO FATALITIES ON NEVADA ROADS | CLICK IT OR TICKET | MOVE OVER FOR HIGHWAY WORKERS | It's a Passing Lane…Not a Cruising Lane |
| R2 Specified Message | OUR GOAL IS ZERO FATALITIES ON NEVADA ROADS | WI REMINDS YOU TO MOVE OVER FOR EMERGENCY VEHICLES | DON'T DRIVE DRUNK, ALCOHOL LAWS ENFORCED | It's No Trick, Seatbelts Are a Treat |
| R3 Specified Message | WI REMINDS YOU TO MOVE OVER FOR EMERGENCY VEHICLES | All Buckled, All Seats, All the Time |
Note: TravelerType 1 = Infrequent, TravelerType 2 = Frequent, TravelerType 3 = Truckers; Age 1 = 16-55, age 2 = Over 55; DMSFrequency 1 = Less than 1 time per month, DMSFrequency 2 = 1-3 times per month, DMSFrequency 3 = One or more times per week.
Value in bold means that the odds ratio is significantly different than 1.
Do you agree that the identified message is understandable?
Site by Site
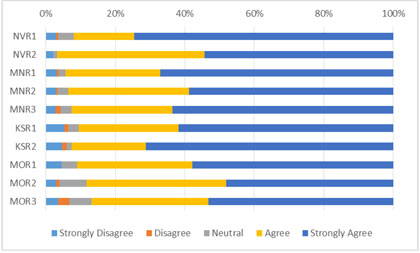
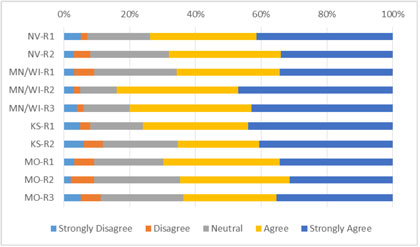
Participants were asked their agreement on whether the identified safety message currently being displayed on the corridor was understandable. Note that the messages presented for this question for each survey round were the same messages as the previous Understanding Hypotheses question. About 92 percent of travelers agreed or strongly agreed that the identified message was understandable, as shown in Table 13 and Figure 13. Missouri had a relatively lower percentage of travelers who agreed or strongly agreed with the statement. When participant responses to this question were compared with those in the previous question (interpretation of the identified DMS), it was found that although a very high percentage of participants considered the identified DMS understandable, a relatively smaller percentage of participants interpreted the message correctly.
| State | Round | Number and Percentage of Survey Participants: Strongly Disagree | Number and Percentage of Survey Participants: Disagree | Number and Percentage of Survey Participants: Neutral | Number and Percentage of Survey Participants: Agree | Number and Percentage of Survey Participants: Strongly Agree | Number and Percentage of Survey Participants: Total |
|---|---|---|---|---|---|---|---|
| Nevada | R1 | 3% | 1% | 4% | 17% | 75% | 201 |
| Nevada | R2 | 2% | 0% | 1% | 42% | 54% | 92 |
| Minnesota/Wisconsin | R1 | 3% | 1% | 2% | 27% | 67% | 158 |
| Minnesota/Wisconsin | R2 | 3% | 0% | 3% | 35% | 59% | 233 |
| Minnesota/Wisconsin | R3 | 3% | 1% | 3% | 29% | 64% | 286 |
| Kansas | R1 | 5% | 1% | 3% | 29% | 62% | 170 |
| Kansas | R2 | 5% | 1% | 1% | 21% | 71% | 216 |
| Missouri | R1 | 4% | 0% | 4% | 33% | 58% | 178 |
| Missouri | R2 | 3% | 1% | 8% | 40% | 48% | 102 |
| Missouri | R3 | 4% | 3% | 6% | 34% | 53% | 280 |
| All Participants | 68 (3%) | 22 (1%) | 71 (4%) | 570 (30%) | 1185 (62%) | 1916 | |
Note: 21 participants did not provide inputs.
A binary logistic model was fit to the data with the probability of travelers agreeing or strongly agreeing that the message was understandable as the response and traveler type, age, gender, round, and frequency of seeing safety-related message during general travels as the predictors, as shown in Table 14 and Figure C-9 through Figure C-12 in Appendix C. In both Kansas and Nevada, infrequent travelers were more likely than frequent travelers or truckers to consider the message as understandable.
| Label | NV | MN/WI | KS | MO |
|---|---|---|---|---|
| TravelerType 1 vs 2 | 2.6 (0.9, 7.3) | 1.1 (0.6, 2.0) | 2.3 (1.2, 4.5) | 1.0 (0.6, 1.7) |
| TravelerType 1 vs 3 | 4.6 (1.4, 14.9) | 0.8 (0.4, 1.5) | 1.3 (0.6, 2.7) | 0.8 (0.5, 1.3) |
| TravelerType 2 vs 3 | 1.8 (0.8, 4.3) | 0.7 (0.4, 1.2) | 0.6 (0.3, 1.1) | 0.8 (0.5, 1.4) |
| Age 1 vs 2 | 5.5 (2.3, 13.1) | 0.4 (0.2, 0.6) | 0.4 (0.2, 0.7) | 0.6 (0.4, 0.9) |
| Gender Female vs Male | 0.4 (0.2, 0.9) | 2.0 (1.1, 3.6) | 2.0 (1.0, 4.0) | 1.0 (0.7, 1.5) |
| Round R1 vs R2 | 0.4 (0.2, 1.0) | 1.3 (0.7, 2.3) | 0.8 (0.5, 1.4) | 1.4 (0.8, 2.5) |
| Round R1 vs R3 | 1.2 (0.6, 2.1) | 1.6 (1.0, 2.5) | ||
| Round R2 vs R3 | 0.9 (0.6, 1.5) | 1.1 (0.7, 1.9) | ||
| DMSFrequency 1 vs 2 | 0.8 (0.3, 2.4) | 0.7 (0.4, 1.4) | 0.8 (0.4, 1.7) | 0.8 (0.5, 1.2) |
| DMSFrequency 1 vs 3 | 1.1 (0.4, 3.1) | 0.8 (0.4, 1.5) | 1.1 (0.6, 2.3) | 0.6 (0.3, 0.9) |
| DMSFrequency 2 vs 3 | 1.3 (0.6, 3.1) | 1.1 (0.6, 1.9) | 1.4 (0.7, 2.8) | 0.7 (0.4, 1.2) |
| R1 Specified Message | OUR GOAL IS ZERO FATALITIES ON NEVADA ROADS | CLICK IT OR TICKET | MOVE OVER FOR HIGHWAY WORKERS | It's a Passing Lane…Not a Cruising Lane |
| R2 Specified Message | OUR GOAL IS ZERO FATALITIES ON NEVADA ROADS | WI REMINDS YOU TO MOVE OVER FOR EMERGENCY VEHICLES | DON'T DRIVE DRUNK, ALCOHOL LAWS ENFORCED | It's No Trick, Seatbelts Are a Treat |
| R3 Specified Message | WI REMINDS YOU TO MOVE OVER FOR EMERGENCY VEHICLES | All Buckled, All Seats, All the Time |
Note: TravelerType 1 = Infrequent, TravelerType 2 = Frequent, TravelerType 3 = Truckers; Age 1 = 16-55, age 2 = Over 55; DMSFrequency 1 = Less than 1 time per month, DMSFrequency 2 = 1-3 times per month, DMSFrequency 3 = One or more times per week.
Value in bold means that the odds ratio is significantly different than 1.
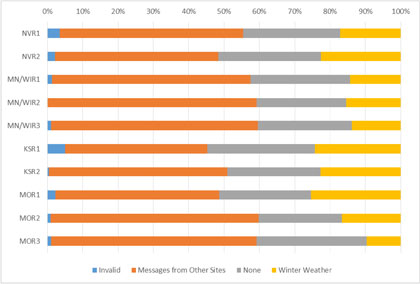
Messages at All Sites
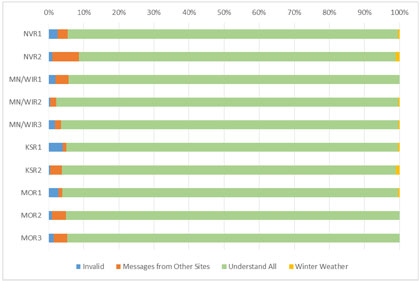
Survey respondents were presented a series of PSA messages that had been displayed in other survey corridors (e.g., Kansas respondents saw PSA messages that had been displayed in Minnesota/Wisconsin and Nevada), as well as a weather message. Findings show that over 96 percent of all respondents found all four of the messages to be understandable. Participant responses in Figure 14 are presented so that they can be matched in the same category across sites. Note for Figure 14 that invalid means that conflicting responses were selected (i.e., selected both "None of these" and one of the messages); Messages from other sites means the respondent selected at least one message displayed at the other sites; Winter Weather means the respondent selected the winter weather message only; and understand all/none of these is as stated.
Evaluation of Behavior Change
- Hypothesis: The display of a PSA on a DMS does not cause traffic to slow down or other congestion.
- Question: Have these messages ever caused you to slow down?
- Hypothesis: The contents of the PSA cause a change in behavior by the travelers (e.g., more aware, looking for license plates from an AMBER alert message, etc.).
- Question: After seeing the messages did you do anything differently?
- Question: Has seeing one of these messages ever caused you to change your driving?
General – Have these messages ever caused you to slow down?
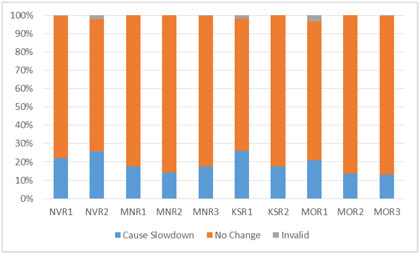
These general questions were not related to site-specific messages. In other words, the same question was asked in all sites and during all survey rounds and no specific messages were referenced. Similar to the previous question, a smaller percentage (less than 26 percent) of travelers thought the safety-related DMS messages caused them or other travelers to slow down.
| State | Round | Number and Percentage of Survey Participants: Caused to Slow Down | Number and Percentage of Survey Participants: No Change | Number and Percentage of Survey Participants: Invalid | Number and Percentage of Survey Participants: Number of Participants |
|---|---|---|---|---|---|
| Nevada | R1 | 22% | 77% | 0% | 204 |
| Nevada | R2 | 26% | 72% | 2% | 93 |
| Minnesota/Wisconsin | R1 | 18% | 83% | 0% | 160 |
| Minnesota/Wisconsin | R2 | 14% | 86% | 0% | 233 |
| Minnesota/Wisconsin | R3 | 18% | 82% | 0% | 289 |
| Kansas | R1 | 26% | 72% | 2% | 177 |
| Kansas | R2 | 18% | 82% | 0% | 216 |
| Missouri | R1 | 21% | 76% | 3% | 181 |
| Missouri | R2 | 14% | 86% | 0% | 102 |
| Missouri | R3 | 13% | 87% | 0% | 282 |
| All Participants | 354 (18%) | 1569 (81%) | 14 (1%) | 1937 | |
A binary logistic model was fit to the data with the probability of causing them to slow down as the response and traveler type, age, gender, round, and frequency of seeing safety-related message during general travels as the predictors, as shown in Table 16 and Figure C-13 through Figure C-16 in Appendix C. In Minnesota/Wisconsin and Nevada, infrequent travelers were significantly less likely to respond that the safety-related DMS messages cause them to slow down to read the message than frequent travelers and truckers. No statistically significant differences were found in Kansas or Missouri.
In Nevada, female travelers were more likely to think the DMS messages would cause traffic to slow down. In Minnesota/Wisconsin and Missouri, travelers who observed safety-related DMS messages with lower frequency were less likely to think the DMS messages would cause them to slow down. These results may reflect geographic differences in driving behavior.
| Label | NV | MN/WI | KS | MO |
|---|---|---|---|---|
| TravelerType 1 vs 2 | 0.7 (0.4, 1.2) | 0.6 (0.4, 1.0) | 0.7 (0.4, 1.0) | 1.5 (1.0, 2.5) |
| TravelerType 1 vs 3 | 0.4 (0.2, 0.8) | 0.5 (0.3, 0.8) | 0.9 (0.5, 1.5) | 1.3 (0.9, 2.1) |
| TravelerType 2 vs 3 | 0.6 (0.4, 1.0) | 0.8 (0.5, 1.1) | 1.3 (0.8, 2.2) | 0.9 (0.6, 1.4) |
| Age 1 vs 2 | 0.7 (0.5, 1.1) | 1.3 (0.9, 1.7) | 1.1 (0.8, 1.6) | 1.3 (0.9, 1.8) |
| Gender Female vs Male | 1.8 (1.2, 2.9) | 1.3 (0.9, 1.8) | 1.0 (0.7, 1.4) | 0.8 (0.5, 1.2) |
| Round R1 vs R2 | 0.8 (0.5, 1.1) | 1.4 (0.9, 2.0) | 1.7 (1.2, 2.4) | 1.8 (1.1, 2.8) |
| Round R1 vs R3 | 1.1 (0.7, 1.5) | 1.8 (1.2, 2.5) | ||
| Round R2 vs R3 | 0.8 (0.6, 1.1) | 1.0 (0.6, 1.6) | ||
| DMSFrequency 1 vs 2 | 0.8 (0.5, 1.5) | 0.6 (0.4, 1.0) | 0.6 (0.4, 1.0) | 0.4 (0.3, 0.6) |
| DMSFrequency 1 vs 3 | 0.7 (0.4, 1.3) | 0.7 (0.4, 1.1) | 0.7 (0.4, 1.1) | 0.6 (0.4, 0.9) |
| DMSFrequency 2 vs 3 | 0.9 (0.5, 1.4) | 1.1 (0.8, 1.6) | 1.0 (0.7, 1.6) | 1.4 (1.0, 2.1) |
Note: TravelerType 1 = Infrequent, TravelerType 2 = Frequent, TravelerType 3 = Truckers; Age 1 = 16-55, age 2 = Over 55; DMSFrequency 1 = Less than 1 time per month, DMSFrequency 2 = 1-3 times per month, DMSFrequency 3 = One or more times per week.
Value in bold means that the odds ratio is significantly different than 1
After seeing the identified message did you do anything differently?
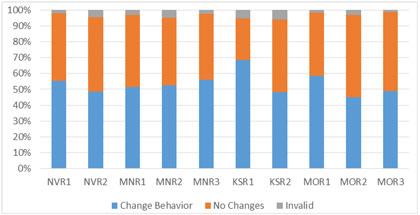
Survey participants were asked to report whether they did anything differently immediately after seeing the safety messages currently being displayed in the corridor. The analysis on this question is to understand the impact of PSAs on traveler behavior. Note, however, that changes in behavior were expected be relatively low, given high compliance rates with the safety message, e.g., seat belt usage. As shown in Table 17 and Figure 16, 77 percent of travelers indicated that they did not do anything differently after seeing the identified message. In a follow-up question, most of these respondents said they did not change their behavior because they were already driving safely. In most surveys less than 30 percent of travelers indicated their behavior change after seeing the message, with Minnesota/Wisconsin Round 1 ("EXTRA SEAT BELT PATROLS NOW, CLICK IT OR TICKET" and "BUCKLE UP, __ TRAFFIC DEATHS THIS YEAR") having the smallest percentage at 9 percent. Kansas Round 1 survey had the highest percentage (39%) of drivers reporting any behavior change after seeing the identified message ("MOVE OVER FOR HIGHWAY WORKERS" and "MOVE OVER FOR EMERGENCY VEHICLES").
| State | Round | Number and Percentage of Survey Participants: No | Number and Percentage of Survey Participants: Yes | Number and Percentage of Survey Participants: Number of Participants |
|---|---|---|---|---|
| Nevada | R1 | 77% | 23% | 204 |
| Nevada | R2 | 76% | 24% | 93 |
| Minnesota/Wisconsin | R1 | 91% | 9% | 160 |
| Minnesota/Wisconsin | R2 | 77% | 23% | 233 |
| Minnesota/Wisconsin | R3 | 74% | 26% | 289 |
| Kansas | R1 | 61% | 39% | 177 |
| Kansas | R2 | 82% | 18% | 216 |
| Missouri | R1 | 71% | 29% | 181 |
| Missouri | R2 | 84% | 16% | 102 |
| Missouri | R3 | 83% | 17% | 282 |
| All Participants | 1500 (77%) | 437 (23%) | 1937 | |
Models were structured to investigate the probability of travelers doing things differently after seeing the identified message. It was found that infrequent travelers were significantly less likely to change their driving activity than frequent travelers and truckers in both Kansas and Nevada, as shown in Table 18 and Figure C-17 through Figure C-20 in Appendix C. However, no statistically significant differences were found in Minnesota/Wisconsin or Missouri. Younger people were more likely to do things differently than older people in Kansas and Missouri. This could reflect relatively higher traveler compliance with the subject of the safety messages being shown on certain corridors or by older drivers. Infrequent travelers on a certain corridor may also drive more and be exposed to safety messages in other areas that have helped to encourage safer driving behavior. It was found that for each site-specific model, the odds ratios were not significant only between rounds that had a same information type (i.e., seatbelt).
| Label | NV | MN/WI | KS | MO |
|---|---|---|---|---|
| TravelerType 1 vs 2 | 0.6 (0.4, 1.1) | 0.8 (0.5, 1.1) | 0.6 (0.4, 1.0) | 1.0 (0.6, 1.5) |
| TravelerType 1 vs 3 | 0.5 (0.3, 0.9) | 0.9 (0.6, 1.4) | 0.4 (0.3, 0.6) | 1.1 (0.7, 1.6) |
| TravelerType 2 vs 3 | 0.8 (0.4, 1.3) | 1.2 (0.8, 1.7) | 0.6 (0.4, 1.0) | 1.1 (0.7, 1.7) |
| Age 1 vs 2 | 1.0 (0.7, 1.6) | 1.3 (1.0, 1.7) | 1.9 (1.3, 2.7) | 1.4 (1.0, 2.0) |
| Gender Female vs Male | 2.2 (1.4, 3.5) | 0.9 (0.7, 1.3) | 1.2 (0.8, 1.7) | 0.6 (0.4, 0.8) |
| Round R1 vs R2 | 0.9 (0.6, 1.4) | 0.4 (0.2, 0.6) | 3.0 (2.1, 4.2) | 2.1 (1.3, 3.3) |
| Round R1 vs R3 | 0.3 (0.2, 0.5) | 1.9 (1.3, 2.6) | ||
| Round R2 vs R3 | 0.9 (0.7, 1.2) | 0.9 (0.6, 1.4) | ||
| DMSFrequency 1 vs 2 | 0.6 (0.3, 1.0) | 0.9 (0.6, 1.3) | 1.3 (0.8, 2.0) | 0.7 (0.5, 1.0) |
| DMSFrequency 1 vs 3 | 1.4 (0.8, 2.6) | 0.7 (0.5, 1.1) | 1.1 (0.7, 1.7) | 0.7 (0.5, 1.0) |
| DMSFrequency 2 vs 3 | 2.5 (1.5, 4.1) | 0.8 (0.6, 1.2) | 0.9 (0.6, 1.3) | 1.0 (0.7, 1.4) |
| R1 Specified Message | OUR GOAL IS ZERO FATALITIES ON NEVADA ROADS | CLICK IT OR TICKET | MOVE OVER FOR HIGHWAY WORKERS | It's a Passing Lane…Not a Cruising Lane |
| R2 Specified Message | OUR GOAL IS ZERO FATALITIES ON NEVADA ROADS | WI REMINDS YOU TO MOVE OVER FOR EMERGENCY VEHICLES | DON'T DRIVE DRUNK, ALCOHOL LAWS ENFORCED | It's No Trick, Seatbelts Are a Treat |
| R3 Specified Message | WI REMINDS YOU TO MOVE OVER FOR EMERGENCY VEHICLES | All Buckled, All Seats, All the Time |
Note: TravelerType 1 = Infrequent, TravelerType 2 = Frequent, TravelerType 3 = Truckers; Age 1 = 16-55, age 2 = Over 55; DMSFrequency 1 = Less than 1 time per month, DMSFrequency 2 = 1-3 times per month, DMSFrequency 3 = One or more times per week.
Value in bold means that the odds ratio is significantly different than 1.
General – Have these messages ever caused changes in your driving behavior?
This is also a general question that was not related to site-specific messages. Between 45 percent and 68 percent of travelers indicated the safety-related DMS messages had caused changes in their driving behavior.
| State | Round | Number and Percentage of Survey Participants: Caused Changes | Number and Percentage of Survey Participants: No Change | Number and Percentage of Survey Participants: Invalid | Number and Percentage of Survey Participants: Number of Participants |
|---|---|---|---|---|---|
| Nevada | R1 | 55% | 43% | 2% | 204 |
| Nevada | R2 | 48% | 47% | 4% | 93 |
| Minnesota/Wisconsin | R1 | 51% | 46% | 3% | 160 |
| Minnesota/Wisconsin | R2 | 52% | 43% | 5% | 233 |
| Minnesota/Wisconsin | R3 | 56% | 42% | 2% | 289 |
| Kansas | R1 | 68% | 27% | 5% | 177 |
| Kansas | R2 | 48% | 46% | 6% | 216 |
| Missouri | R1 | 59% | 40% | 2% | 181 |
| Missouri | R2 | 45% | 52% | 3% | 102 |
| Missouri | R3 | 49% | 50% | 1% | 282 |
| All Participants | 1039 (54%) | 835 (43%) | 63 (3%) | 1937 | |
The probability of the safety-related DMS messages causing driving changes was modeled, and results are presented in Table 20 and Figure C-21 through Figure C-24 in Appendix C. At most sites, except Missouri, infrequent travelers were significantly less likely to change their driving behavior due to the safety-related DMS messages. In Kansas, young travelers and also female travelers were more likely to change their driving because of the DMS messages. Generally, travelers observing DMS less frequently were less likely to change their driving behavior. This may reflect the benefit of a driver seeing specific safety campaign messages more frequently, such that seeing a message advocating for a given topic will eventually lead to a behavior change.
| Label | NV | MN/WI | KS | MO |
|---|---|---|---|---|
| TravelerType 1 vs 2 | 0.6 (0.4, 1.0) | 0.8 (0.6, 1.0) | 0.6 (0.4, 0.9) | 0.9 (0.6, 1.2) |
| TravelerType 1 vs 3 | 0.9 (0.6, 1.5) | 1.0 (0.7, 1.4) | 0.9 (0.6, 1.4) | 1.0 (0.7, 1.4) |
| TravelerType 2 vs 3 | 1.5 (0.9, 2.4) | 1.3 (1.0, 1.7) | 1.5 (0.9, 2.4) | 1.1 (0.8, 1.6) |
| Age 1 vs 2 | 1.1 (0.8, 1.5) | 1.2 (1.0, 1.5) | 1.5 (1.1, 2.0) | 1.2 (0.9, 1.5) |
| Gender Female vs Male | 1.5 (1.0, 2.3) | 1.2 (0.9, 1.6) | 1.6 (1.1, 2.2) | 0.8 (0.6, 1.1) |
| Round R1 vs R2 | 1.3 (0.9, 1.9) | 0.9 (0.7, 1.2) | 2.6 (1.9, 3.6) | 1.7 (1.2, 2.4) |
| Round R1 vs R3 | 0.8 (0.6, 1.1) | 1.4 (1.1, 1.9) | ||
| Round R2 vs R3 | 0.9 (0.7, 1.2) | 0.8 (0.6, 1.2) | ||
| DMSFrequency 1 vs 2 | 0.6 (0.4, 0.9) | 1.0 (0.7, 1.4) | 1.2 (0.8, 1.8) | 0.5 (0.4, 0.7) |
| DMSFrequency 1 vs 3 | 1.1 (0.7, 1.8) | 0.9 (0.6, 1.2) | 0.7 (0.4, 1.0) | 0.7 (0.5, 0.9) |
| DMSFrequency 2 vs 3 | 1.9 (1.2, 3.0) | 0.9 (0.7, 1.1) | 0.6 (0.4, 0.9) | 1.3 (0.9, 1.8) |
Note: TravelerType 1 = Infrequent, TravelerType 2 = Frequent, TravelerType 3 = Truckers; Age 1 = 16-55, age 2 = Over 55; DMSFrequency 1 = Less than 1 time per month, DMSFrequency 2 = 1-3 times per month, DMSFrequency 3 = One or more times per week.
Value in bold means that the odds ratio is significantly different than 1.
Evaluation of Traveler Opinions
- Hypothesis: Travelers believe that DMS for safety awareness and PSA messages are appropriate.
- Question: Do you agree that the message is appropriate?
- Hypothesis: Travelers believe that DMS should only be used for traffic-related messages. Travelers believe that it would be more effective and/or less distracting to motorists to disseminate safety awareness messages and PSAs via other means.
- Question: What types of message do you think should be displayed on DMS?
- Hypothesis: Travelers believe that it would be more effective and/or less distracting to motorists to disseminate safety awareness messages and PSAs via other means.
- Question: Which way of communicating safety-related information do you think is best?
- Hypothesis: Travelers perceive a value of safety awareness and PSA messages on DMS.
- Question: Do you agree that the message raised your awareness of the issue?
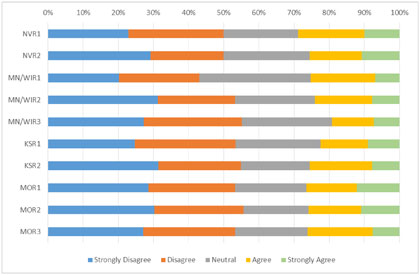
Do you agree that the identified message is appropriate?
Site by Site
Travelers were asked their agreement on whether an identified message was appropriate. At least 85 percent of travelers agreed or strongly agreed that the identified message was appropriate, with Minnesota/Wisconsin site travelers resulting in the highest percentage at 93 percent.
| State | Round | Number and Percentage of Survey Participants: Strongly Disagree | Number and Percentage of Survey Participants: Disagree | Number and Percentage of Survey Participants: Neutral | Number and Percentage of Survey Participants: Agree | Number and Percentage of Survey Participants: Strongly Agree | Number and Percentage of Survey Participants: Total |
|---|---|---|---|---|---|---|---|
| Nevada | R1 | 3% | 1% | 5% | 22% | 68% | 201 |
| Nevada | R2 | 2% | 1% | 8% | 41% | 48% | 92 |
| Minnesota/Wisconsin | R1 | 3% | 2% | 3% | 28% | 65% | 158 |
| Minnesota/Wisconsin | R2 | 3% | 1% | 3% | 37% | 55% | 233 |
| Minnesota/Wisconsin | R3 | 3% | 0% | 4% | 31% | 62% | 286 |
| Kansas | R1 | 4% | 2% | 5% | 29% | 59% | 170 |
| Kansas | R2 | 4% | 1% | 6% | 24% | 65% | 216 |
| Missouri | R1 | 5% | 1% | 3% | 34% | 57% | 178 |
| Missouri | R2 | 1% | 1% | 8% | 47% | 43% | 102 |
| Missouri | R3 | 4% | 3% | 8% | 33% | 52% | 280 |
| All Participants | 66 (3%) | 25 (1%) | 98 (5%) | 607 (32%) | 1120 (58%) | 1916 | |
Note: 21 participants did not provide inputs.
A binary logistic model was fit to the data with the probability of travelers agreeing or strongly agreeing that the message was appropriate as the response and traveler type, age, gender, round, and frequency of seeing safety-related message during general travels as the predictors, and results are presented in Table 22 and Figure C-25 through Figure C-28 in Appendix C.
No statistically significant differences were observed in terms of traveler type. Younger travelers were significantly less likely to consider the messages to be appropriate than older travelers in Kansas, Minnesota/Wisconsin and Missouri, while the opposite was found in Nevada.
| Label | NV | MN/WI | KS | MO |
|---|---|---|---|---|
| TravelerType 1 vs 2 | 1.5 (0.5, 4.6) | 1.1 (0.5, 2.5) | 1.4 (0.6, 3.1) | 0.6 (0.2, 1.3) |
| TravelerType 1 vs 3 | 2.1 (0.6, 7.2) | 1.2 (0.5, 3.0) | 0.7 (0.3, 1.7) | 0.8 (0.4, 1.7) |
| TravelerType 2 vs 3 | 1.4 (0.5, 3.9) | 1.1 (0.5, 2.4) | 0.5 (0.2, 1.2) | 1.5 (0.6, 3.6) |
| Age 1 vs 2 | 3.0 (1.2, 7.2) | 0.5 (0.3, 1.0) | 0.4 (0.2, 0.8) | 0.5 (0.3, 0.9) |
| Gender Female vs Male | 1.1 (0.4, 2.9) | 1.1 (0.5, 2.3) | 2.5 (1.1, 5.7) | 0.8 (0.5, 1.5) |
| Round R1 vs R2 | 1.4 (0.6, 3.1) | 1.0 (0.5, 2.2) | 1.1 (0.6, 2.1) | 1.1 (0.5, 2.6) |
| Round R1 vs R3 | 0.8 (0.4, 1.7) | 1.7 (0.9, 3.2) | ||
| Round R2 vs R3 | 0.8 (0.4, 1.6) | 1.5 (0.7, 3.2) | ||
| DMSFrequency 1 vs 2 | 1.5 (0.5, 4.8) | 0.6 (0.3, 1.5) | 0.8 (0.3, 1.9) | 0.6 (0.3, 1.1) |
| DMSFrequency 1 vs 3 | 1.3 (0.4, 4.4) | 0.9 (0.4, 2.0) | 1.0 (0.4, 2.3) | 0.5 (0.3, 1.1) |
| DMSFrequency 2 vs 3 | 0.9 (0.4, 2.2) | 1.4 (0.7, 3.1) | 1.2 (0.5, 2.9) | 1.0 (0.5, 2.1) |
| R1 Specified Message | OUR GOAL IS ZERO FATALITIES ON NEVADA ROADS | CLICK IT OR TICKET | MOVE OVER FOR HIGHWAY WORKERS | It's a Passing Lane…Not a Cruising Lane |
| R2 Specified Message | OUR GOAL IS ZERO FATALITIES ON NEVADA ROADS | WI REMINDS YOU TO MOVE OVER FOR EMERGENCY VEHICLES | DON'T DRIVE DRUNK, ALCOHOL LAWS ENFORCED | It's No Trick, Seatbelts Are a Treat |
| R3 Specified Message | WI REMINDS YOU TO MOVE OVER FOR EMERGENCY VEHICLES | All Buckled, All Seats, All the Time |
Note: TravelerType 1 = Infrequent, TravelerType 2 = Frequent, TravelerType 3 = Truckers; Age 1 = 16-55, age 2 = Over 55; DMSFrequency 1 = Less than 1 time per month, DMSFrequency 2 = 1-3 times per month, DMSFrequency 3 = One or more times per week.
Value in bold means that the odds ratio is significantly different than 1.
Messages at All Sites
Survey respondents were presented a series of PSA messages that had been displayed in other survey corridors (e.g., Kansas respondents saw PSA messages that had been displayed in Minnesota/Wisconsin and Nevada), as well as a weather message. Findings show that over 90 percent of all respondents found all four of the messages to be appropriate. Participant responses in Figure 19 are presented so that they can be matched in the same category across sites. Note for Figure 19 that invalid means that conflicting responses were selected (i.e., selected both "None of these" and one of the messages); Messages from other sites means the respondent selected at least one message displayed at the other sites; Winter Weather means the respondent selected the winter weather message only; and Understand all/none of these is as stated.
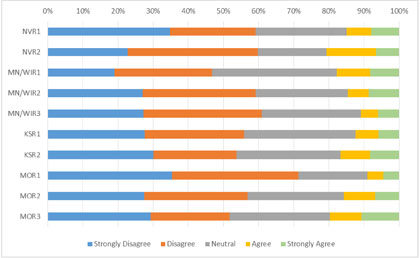
Do you agree that the identified message raised your awareness of the issue?
Site by Site
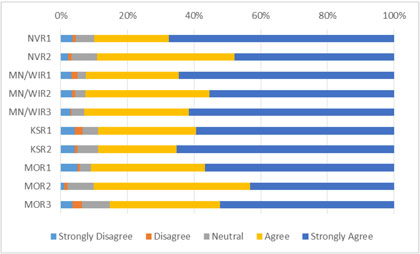
When asked whether the identified message raised their awareness of the issue, at least 63 percent of travelers agreed or strongly agreed. The Minnesota/Wisconsin Round 2 survey had the highest percentage at 84 percent, while Missouri Round 3 had the smallest percentage at 63 percent.
| State | Round | Number and Percentage of Survey Participants: Strongly Disagree | Number and Percentage of Survey Participants: Disagree | Number and Percentage of Survey Participants: Neutral | Number and Percentage of Survey Participants: Agree | Number and Percentage of Survey Participants: Strongly Agree | Number and Percentage of Survey Participants: Total |
|---|---|---|---|---|---|---|---|
| Nevada | R1 | 5% | 2% | 19% | 32% | 41% | 201 |
| Nevada | R2 | 3% | 5% | 24% | 34% | 34% | 92 |
| Minnesota/Wisconsin | R1 | 3% | 6% | 25% | 31% | 34% | 158 |
| Minnesota/Wisconsin | R2 | 3% | 2% | 11% | 37% | 47% | 233 |
| Minnesota/Wisconsin | R3 | 4% | 2% | 14% | 37% | 43% | 286 |
| Kansas | R1 | 5% | 3% | 16% | 32% | 44% | 170 |
| Kansas | R2 | 6% | 6% | 23% | 25% | 41% | 216 |
| Missouri | R1 | 3% | 6% | 21% | 35% | 34% | 178 |
| Missouri | R2 | 2% | 7% | 26% | 33% | 31% | 102 |
| Missouri | R3 | 5% | 6% | 25% | 28% | 35% | 280 |
| All Participants | 81 (4%) | 83 (4%) | 376 (20%) | 621 (32%) | 755 (39%) | 1916 | |
Note: 21 participants did not provide inputs.
As shown in Table 24 and Figure C-29 through Figure C-32 in Appendix C, the logistic regression analysis about whether the message raised traveler awareness of the issue found no significant difference by traveler type; only in Kansas was a significant difference found due to gender. Also in Kansas, travelers seeing DMS frequently were observed to be significantly more likely to think the messages raise their awareness of the issue.
| Label | NV | MN/WI | KS | MO |
|---|---|---|---|---|
| TravelerType 1 vs 2 | 1.2 (0.6, 2.6) | 0.7 (0.4, 1.1) | 1.4 (0.8, 2.4) | 0.6 (0.4, 1.1) |
| TravelerType 1 vs 3 | 1.6 (0.7, 3.6) | 0.8 (0.4, 1.4) | 0.9 (0.5, 1.7) | 1.0 (0.6, 1.6) |
| TravelerType 2 vs 3 | 1.3 (0.7, 2.7) | 1.2 (0.7, 2.0) | 0.7 (0.3, 1.3) | 1.5 (0.9, 2.6) |
| Age 1 vs 2 | 1.5 (0.9, 2.6) | 0.8 (0.5, 1.2) | 0.8 (0.5, 1.3) | 0.9 (0.6, 1.4) |
| Gender Female vs Male | 0.9 (0.5, 1.7) | 1.3 (0.8, 2.0) | 1.7 (1.0, 2.9) | 1.4 (0.9, 2.1) |
| Round R1 vs R2 | 1.4 (0.8, 2.5) | 0.4 (0.2, 0.6) | 1.8 (1.1, 2.9) | 1.2 (0.7, 2.1) |
| Round R1 vs R3 | 0.5 (0.3, 0.7) | 1.3 (0.9, 1.9) | ||
| Round R2 vs R3 | 1.2 (0.8, 1.9) | 1.1 (0.7, 1.7) | ||
| DMSFrequency 1 vs 2 | 0.6 (0.3, 1.3) | 1.2 (0.7, 2.1) | 0.5 (0.2, 0.9) | 0.7 (0.4, 1.1) |
| DMSFrequency 1 vs 3 | 1.2 (0.6, 2.5) | 1.0 (0.6, 1.7) | 0.9 (0.5, 1.7) | 0.8 (0.5, 1.2) |
| DMSFrequency 2 vs 3 | 1.9 (1.0, 3.9) | 0.8 (0.5, 1.3) | 2.0 (1.1, 3.7) | 1.2 (0.7, 1.9) |
| R1 Specified Message | OUR GOAL IS ZERO FATALITIES ON NEVADA ROADS | CLICK IT OR TICKET | MOVE OVER FOR HIGHWAY WORKERS | It's a Passing Lane…Not a Cruising Lane |
| R2 Specified Message | OUR GOAL IS ZERO FATALITIES ON NEVADA ROADS | WI REMINDS YOU TO MOVE OVER FOR EMERGENCY VEHICLES | DON'T DRIVE DRUNK, ALCOHOL LAWS ENFORCED | It's No Trick, Seatbelts Are a Treat |
| R3 Specified Message | WI REMINDS YOU TO MOVE OVER FOR EMERGENCY VEHICLES | All Buckled, All Seats, All the Time |
Note: TravelerType 1 = Infrequent, TravelerType 2 = Frequent, TravelerType 3 = Truckers; Age 1 = 16-55, age 2 = Over 55; DMSFrequency 1 = Less than 1 time per month, DMSFrequency 2 = 1-3 times per month, DMSFrequency 3 = One or more times per week.
Value in bold means that the odds ratio is significantly different than 1.
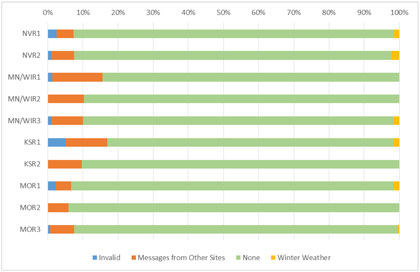
Messages at All Sites
Survey respondents were presented a series of PSA messages that had been displayed in other survey corridors (e.g., Kansas respondents saw PSA messages that had been displayed in Minnesota/Wisconsin and Nevada), as well as a weather message. Findings show that the majority of respondents found all messages to raise their awareness about an issue. Participant responses in Figure 21 are presented so that they can be matched in the same category across sites. Note for Figure 21 that invalid means that conflicting responses were selected (i.e., selected both "None of these" and one of the messages); Messages from other sites means the respondent selected at least one message displayed at the other sites; Winter Weather means the respondent selected the winter weather message only; and Understand all/none of these is as stated.
Displaying safety campaign messages too frequently
Across all four sites, regarding the specific safety campaign messages being shown in the survey corridor 15.0 percent agreed or strongly agreed that the message was displayed too often. However, 24.7 percent agreed or strongly agreed that they were more likely to stop reading DMS after seeing this message multiple times. The responses for all survey rounds for these two questions are depicted in Figure 22 and Figure 23, respectively.
Which way of communicating safety-related information do you think is best?
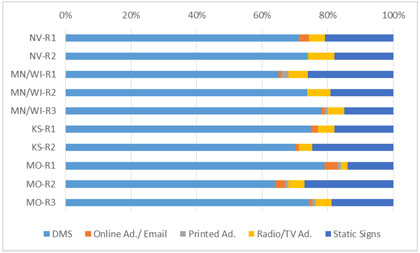
Most travelers considered DMS as the best way to communicate safety-related information, followed by static signs. Given that travelers were taking a survey asking primarily about DMS, there may have been some bias toward this response.
| State | Round | Number and Percentage of Survey Participants: DMS | Number and Percentage of Survey Participants: Online Ad./ Email | Number and Percentage of Survey Participants: Printed Ad. | Number and Percentage of Survey Participants: Radio/TV Ad. | Number and Percentage of Survey Participants: Static Signs | Number and Percentage of Survey Participants: Total |
|---|---|---|---|---|---|---|---|
| Nevada | R1 | 72% | 3% | 0% | 5% | 21% | 199 |
| Nevada | R2 | 74% | 0% | 0% | 8% | 18% | 92 |
| Minnesota/Wisconsin | R1 | 65% | 1% | 2% | 6% | 26% | 157 |
| Minnesota/Wisconsin | R2 | 73% | 0% | 0% | 7% | 19% | 233 |
| Minnesota/Wisconsin | R3 | 78% | 1% | 1% | 5% | 15% | 286 |
| Kansas | R1 | 75% | 2% | 0% | 5% | 18% | 169 |
| Kansas | R2 | 71% | 1% | 0% | 4% | 25% | 216 |
| Missouri | R1 | 79% | 4% | 1% | 2% | 14% | 177 |
| Missouri | R2 | 64% | 3% | 1% | 5% | 27% | 101 |
| Missouri | R3 | 75% | 1% | 1% | 5% | 19% | 280 |
| All Participants | 1401 (73%) | 31 (2%) | 12 (1%) | 93 (5%) | 373 (19%) | 1910 | |
Note: 27 participants did not provide inputs.
The probability of travelers considering DMS as the best communication of safety-related information was modeled, with results presented in Table 26 and Figure C-33 through Figure C-36 in Appendix C. Only in Minnesota/Wisconsin were significant impacts by traveler type observed: infrequent travelers had a significantly higher probability of thinking DMS was the best way to communicate safety-related information than truckers.
| Label | NV | MN/WI | KS | MO |
|---|---|---|---|---|
| TravelerType 1 vs 2 | 1.0 (0.5, 2.2) | 1.5 (1.0, 2.5) | 0.9 (0.5, 1.6) | 0.8 (0.4, 1.4) |
| TravelerType 1 vs 3 | 1.4 (0.6, 3.0) | 1.8 (1.1, 3.2) | 0.8 (0.4, 1.6) | 0.9 (0.5, 1.4) |
| TravelerType 2 vs 3 | 1.3 (0.7, 2.7) | 1.2 (0.8, 1.9) | 0.9 (0.5, 1.8) | 1.1 (0.6, 2.1) |
| Age 1 vs 2 | 1.4 (0.8, 2.4) | 0.8 (0.5, 1.1) | 0.8 (0.5, 1.2) | 0.8 (0.6, 1.3) |
| Gender Female vs Male | 1.5 (0.8, 2.9) | 1.1 (0.7, 1.7) | 1.3 (0.8, 2.1) | 1.3 (0.9, 2.1) |
| Round R1 vs R2 | 0.9 (0.5, 1.7) | 0.7 (0.4, 1.0) | 1.3 (0.8, 2.0) | 2.0 (1.2, 3.5) |
| Round R1 vs R3 | 0.5 (0.3, 0.7) | 1.3 (0.8, 2.1) | ||
| Round R2 vs R3 | 0.7 (0.5, 1.1) | 0.7 (0.4, 1.1) | ||
| DMSFrequency 1 vs 2 | 1.0 (0.5, 2.2) | 0.7 (0.4, 1.2) | 1.3 (0.7, 2.3) | 1.0 (0.6, 1.7) |
| DMSFrequency 1 vs 3 | 1.1 (0.5, 2.3) | 0.7 (0.4, 1.2) | 0.9 (0.5, 1.7) | 0.7 (0.4, 1.2) |
| DMSFrequency 2 vs 3 | 1.1 (0.5, 2.1) | 1.0 (0.6, 1.5) | 0.7 (0.4, 1.3) | 0.7 (0.4, 1.1) |
| R1 Specified Message | OUR GOAL IS ZERO FATALITIES ON NEVADA ROADS | CLICK IT OR TICKET | MOVE OVER FOR HIGHWAY WORKERS | It's a Passing Lane…Not a Cruising Lane |
| R2 Specified Message | OUR GOAL IS ZERO FATALITIES ON NEVADA ROADS | WI REMINDS YOU TO MOVE OVER FOR EMERGENCY VEHICLES | DON'T DRIVE DRUNK, ALCOHOL LAWS ENFORCED | It's No Trick, Seatbelts Are a Treat |
| R3 Specified Message | WI REMINDS YOU TO MOVE OVER FOR EMERGENCY VEHICLES | All Buckled, All Seats, All the Time |
Note: TravelerType 1 = Infrequent, TravelerType 2 = Frequent, TravelerType 3 = Truckers; Age 1 = 16-55, age 2 = Over 55; DMSFrequency 1 = Less than 1 time per month, DMSFrequency 2 = 1-3 times per month, DMSFrequency 3 = One or more times per week.
Value in bold means that the odds ratio is significantly different than 1.
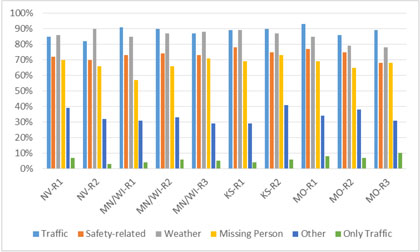
What types of messages do you think should be displayed on DMS?
The following table shows the percentage of participants who selected specific types of messages that should be displayed on DMS. Note that participants could select multiple message types:
- Traffic messages (e.g., congestion, travel time to a destination, accident), 89 percent;
- Safety-related messages (e.g., seat belts, distracted driving, work zone safety), 73 percent;
- Weather messages (e.g., severe storms, icy conditions, windy conditions), 85 percent;
- Missing person messages (e.g., AMBER alert, silver alert), 68 percent; and
- Other messages (e.g., call 511, special event notice, ozone action day), 33 percent.
The table shows the percentage of participants who picked traffic messages only, or thought the DMS should only display traffic messages. Traffic and weather messages had the highest percentage across the sites. However, a very small percentage (less than 10 percent) of the participants thought DMS should only display traffic messages.
| State | Round | Number and Percentage of Survey Participants: Traffic | Number and Percentage of Survey Participants: Safety-related | Number and Percentage of Survey Participants: Weather | Number and Percentage of Survey Participants: Missing Person | Number and Percentage of Survey Participants: Other | Number and Percentage of Survey Participants: Only Traffic | Number and Percentage of Survey Participants: Total |
|---|---|---|---|---|---|---|---|---|
| Nevada | R1 | 85% | 72% | 86% | 70% | 39% | 7% | 199 |
| Nevada | R2 | 82% | 70% | 90% | 66% | 32% | 3% | 92 |
| Minnesota/Wisconsin | R1 | 91% | 73% | 85% | 57% | 31% | 4% | 157 |
| Minnesota/Wisconsin | R2 | 90% | 74% | 87% | 66% | 33% | 6% | 233 |
| Minnesota/Wisconsin | R3 | 87% | 73% | 88% | 71% | 29% | 5% | 286 |
| Kansas | R1 | 89% | 78% | 89% | 69% | 29% | 4% | 169 |
| Kansas | R2 | 90% | 75% | 87% | 73% | 41% | 6% | 216 |
| Missouri | R1 | 93% | 77% | 85% | 69% | 34% | 8% | 177 |
| Missouri | R2 | 86% | 75% | 79% | 65% | 38% | 7% | 101 |
| Missouri | R3 | 89% | 68% | 78% | 68% | 31% | 10% | 280 |
| Participant Numbers | 1693 (89%) | 1400 (73%) | 1627 (85%) | 1301 (68%) | 637 (33%) | 120 (6%) | 1910 | |
Note: 27 participants did not provide inputs.
The probability of travelers thinking DMS should only display traffic message was modeled versus those who think other messages should be displayed, with results presented in Table 28 and Figure C-37 through Figure C-40 in Appendix C. The impact by traveler type was not statistically significant. Younger travelers tended to be more likely to think the DMS should only display traffic messages and these differences were statistically significant in both Kansas and Missouri.
| Label | NV | MN/WI | KS | MO |
|---|---|---|---|---|
| TravelerType 1 vs 2 | 1.1 (0.2, 5.2) | 1.2 (0.5, 3.2) | 3.5 (0.7, 17.0) | 1.8 (0.6, 5.1) |
| TravelerType 1 vs 3 | 0.6 (0.2, 2.8) | 0.8 (0.3, 2.5) | 1.4 (0.4, 5.2) | 1.0 (0.4, 2.1) |
| TravelerType 2 vs 3 | 0.6 (0.1, 2.6) | 0.7 (0.3, 1.7) | 0.4 (0.1, 2.4) | 0.5 (0.2, 1.5) |
| Age 1 vs 2 | 1.8 (0.6, 5.4) | 1.9 (0.9, 3.9) | 3.2 (1.1, 9.6) | 2.4 (1.2, 4.6) |
| Gender Female vs Male | 0.4 (0.1, 1.7) | 0.6 (0.2, 1.6) | 1.0 (0.4, 2.8) | 0.8 (0.4, 1.7) |
| Round R1 vs R2 | 2.4 (0.6, 8.8) | 0.7 (0.3, 1.9) | 0.6 (0.2, 1.7) | 1.1 (0.4, 2.9) |
| Round R1 vs R3 | 1.0 (0.4, 2.6) | 0.8 (0.4, 1.6) | ||
| Round R2 vs R3 | 1.4 (0.6, 3.1) | 0.7 (0.3, 1.7) | ||
| DMSFrequency 1 vs 2 | 2.2 (0.5, 9.2) | 0.6 (0.2, 1.6) | 0.9 (0.3, 2.6) | 1.7 (0.8, 3.8) |
| DMSFrequency 1 vs 3 | 2.4 (0.6, 10.4) | 0.9 (0.3, 2.7) | 2.6 (0.6, 11.2) | 3.0 (1.3, 7.0) |
| DMSFrequency 2 vs 3 | 1.1 (0.3, 4.5) | 1.6 (0.7, 3.5) | 3.1 (0.7, 12.8) | 1.7 (0.7, 4.2) |
Note: TravelerType 1 = Infrequent, TravelerType 2 = Frequent, TravelerType 3 = Truckers; Age 1 = 16-55, age 2 = Over 55; DMSFrequency 1 = Less than 1 time per month, DMSFrequency 2 = 1-3 times per month, DMSFrequency 3 = One or more times per week.
Value in bold means that the odds ratio is significantly different than 1.
Discussion of Results
Table 29 summarizes specific hypotheses and findings for each of the evaluation areas of awareness, understanding, behavior changes and opinions. Overall, about 77 percent of travelers encountered by the survey team had seen a DMS, while about 79 percent indicated that they had observed at least one of the safety-related messages, which supports the awareness hypothesis. The understanding hypothesis was also supported, as over 79 percent of travelers were able to correctly interpret the presented message. An even higher percentage (92 percent) of respondents agreed or strongly agreed that the message was understandable. In terms of behavior, self-report survey data found that 23 percent of travelers changed their driving behavior after seeing the safety message, which in conjunction with 54 percent saying they have changed their behavior in the past after seeing a safety message, supports the behavior change hypothesis. Given relatively high compliance rates with safety laws and a generally safe traveling population, lower percentages are not surprising. The survey data also indicated that the display of a PSA on a DMS does not seem to cause travelers to slow down to read a message, with 18 percent of respondents reporting that they or others seem to slow down as they pass by these DMS messages. Two of the opinion hypotheses were supported: a high proportion of respondents believed that the safety awareness and PSA message posted at each site was appropriate (90 percent) and raised their awareness of the safety issue (71 percent). A small percentage of respondents (6 percent) indicated that only traffic-related messages should be shown on DMSs and most travelers considered DMS as the best way of communicating safety-related information to the public, which did not support the two related opinions hypotheses.
Further analyses were conducted to examine the differences between traveler types (infrequent travelers, frequent travelers, and truckers). In most sites, infrequent travelers have the highest level of awareness, followed by frequent travelers.
| Evaluation Area | Hypotheses | Results | Detail |
|---|---|---|---|
| Awareness | A significant percentage of travelers are aware that safety messages and PSAs are included on DMS | Supported | 77% of travelers encountered by the survey team had seen a DMS. |
| Awareness | A significant percentage of travelers have observed an actual safety message and/or PSA on a DMS | Supported | 79% of travelers from the four sites reported that they observed at least one of the safety-related messages. In most sites, infrequent travelers had the highest level of awareness, followed by frequent travelers and then truckers. |
| Understanding | Drivers can understand the messages on the DMS | Supported | 79% of travelers interpreted the message correctly: truckers in Nevada had a significantly lower understanding level than other travelers, and infrequent travelers in Missouri had significantly lower understanding than frequent travelers. 92% of travelers agreed or strongly agreed that the message is understandable; Kansas and Nevada infrequent travelers were more likely than other travelers to consider the message as understandable. |
| Behavior Changes | The display of a PSA on a DMS does not cause traffic to slow down or other congestion | Partially Supported | 18% of travelers thought that they "slow down" or are slowed down by other traffic because of these DMS messages. Minnesota/Wisconsin and Nevada infrequent travelers were significantly less likely to respond that the safety-related DMS messages cause them to slow down to read the message than frequent travelers and truckers. Infrequent travelers at most sites were significantly less likely to change their driving behavior due to the safety-related DMS messages. Young travelers and female travelers in Kansas were more likely to change their driving because of the DMS messages. |
| Behavior Changes | The contents of the PSA cause a change in behavior by the travelers (e.g., more aware, looking for license plates for AMBER alerts, etc.) | Supported | 23% of travelers indicated that they changed their behavior after seeing the specific identified messages in the corridor. 54% of travelers indicated that seeing safety campaign messages on DMSs had caused them to change their driving in the past. Given high compliance rates (e.g., seat belt usage), lower percentages were expected. |
| Opinions | Travelers believe that DMS for safety awareness and PSA messages are appropriate | Supported | 90% of travelers agreed or strongly agreed that the specified safety message posted at each site was appropriate. Younger travelers were significantly less likely to consider the messages to be appropriate than older travelers in Kansas, Minnesota/ Wisconsin and Missouri, while the opposite was found in Nevada. |
| Opinions | Travelers believe that DMS should only be used for traffic-related messages | Not supported | 6% of travelers thought that only transportation-related message should be displayed on DMSs. Impact by traveler type was not statistically significant; younger travelers tended to be more likely to think the DMS should only display traffic message and these differences were statistically significant in both Kansas and Missouri. |
| Opinions | Travelers believe that it would be more effective and/or less distracting to motorists to disseminate safety awareness messages and PSAs via other means | Not supported | 73% of travelers indicated that DMS is the best way of communicating safety-related information. Only in Minnesota/Wisconsin were significant impacts observed: infrequent travelers had a significantly higher probability of thinking DMS was the best way to communicate safety-related information than truckers. |
| Opinions | Travelers perceive a value of safety awareness and PSA messages on DMS | Supported | 71% of travelers agreed or strongly agreed that the specified DMS message at each site raised their awareness of the issue. There was no significant difference by traveler type; only in Kansas was a significant difference found for females and also for travelers seeing DMS frequently to be more likely to think the messages raise their awareness of the issue. |
Recommendations
The analysis presented above supports displaying public service announcements and safety messages on DMS in rural areas. Overall, 73 percent of surveyed travelers in rural areas support the use of DMS to display PSAs and safety-related information, and 73 percent think DMS are the best way to communicate that information. About 54 percent of respondents had changed their behavior due to a safety message being posted on DMS, which should enhance overall safety. In addition, few respondents felt that the specified PSAs and safety-related information were displayed too often. As such, this evaluation can generally validate current agency practices in the survey corridors for displaying safety messages and PSAs on rural DMS. However, on rural corridors with higher volumes, agencies may want to examine potential mobility and safety impacts caused by travelers slowing down to read DMS messages, given that a full 18 percent of respondents reported this occurring.
These findings also suggest that displaying safety messages and PSAs more frequently would generally not be detrimental. About 23 percent of survey respondents reported behavior changes after reading the safety message on the DMS, however given high compliance rates with seatbelt use, for example, a relatively low number is not surprising. Even a small percentage of travelers changing their behavior could result in a positive influence on highway safety. About 54 percent of survey respondents indicated that they had changed their behavior in the past after reading a safety message on a DMS. In addition, many travelers who responded that they did not change their behavior anecdotally responded that reading the safety message made them more conscious of driving in a safer manner.
More research is also needed to examine the benefits of displaying catchy messages versus traditional messages. Catchy messages were only displayed in one of the four survey corridors for the duration of the survey in that location, however insufficient data and other bias did not allow for a comprehensive assessment. Anecdotally, catchy messages were commented on by travelers surveyed in other States displaying traditional messages; most remembered those messages in a positive manner. However, catchy messages could also influence the negative comments about DMS being a distraction.