Public Perception of Safety Messages and Public Service Announcements on Dynamic Message Signs in Rural Areas
Chapter 2. Survey Design Methodology
A Survey Design and Execution Plan was developed in January 2015 to describe the methodology for experimental design and conduct of traveler intercept surveys. The purpose of the Survey Design and Execution Plan was to describe the following elements, which are also presented in separate sections below:
- Experimental Design.
- Survey Design and Sample Frame.
- Data Collection and Survey Procedures.
- Design and Testing of the Survey Instrument(s).
Experimental Design
The overall concept of the experimental design for assessing the public perception of safety messages and public safety announcements (PSAs) on dynamic message signs (DMS) in rural areas was to employ a "short recall," "event-based," experimental design combined with a traditional retrospective recall survey method. Travelers on different highways were asked general questions regarding safety messages and PSAs on DMS that could be answered based upon their cumulative history of experiences and observations of these types of messages. These same travelers were also asked about specific messages that were presented to them as they traveled down the highway of interest. This design provided a mechanism to estimate the visibility, awareness, and comprehension separately from overall opinions of these types of messages. Each traveler provided information that could be used to calibrate the survey responses based upon their immediate experiences as opposed to those formed over a longer time under unknown conditions.
Survey Design and Sample Frame
The focus of this study was to gather information from all types of travelers regarding their awareness and perceptions of messages on DMS on predominantly rural highways. The population of interest was all travelers of the highways including tourists, local travelers and commuters, and commercial operators.
One of the key components to a statistically based survey design is determining the appropriate sampling frame from which to draw "samples" or respondents. In this project, responses across all aspects of the population of travelers were desired, which would imply that the ideal sampling frame would be a list of all persons who (or previously) traveled on the highways of interest.
This project employed an intercept survey to identify travelers and operators of motor vehicles along the highways of interest. The intercept survey's sampling frame consisted of all vehicles that were traveling along the highways of interest during the data collection window. It relied upon the assumption that the vehicles observed during the data collection period were representative of all vehicles/travelers on the highway segments. A proportion of the true sampling frame would not stop at any of the proposed intercept locations, or even at all, and was therefore not available to survey. The potential bias if this portion of the sampling frame has systematically different views of DMS was a limitation of the intercept survey that had to be tolerated. The other potential biases due to the locations, timing and types of travelers intercepted can be mitigated through management of the data collection periods, number of travelers intercepted, and the avoidance of unique travel events such as peak holiday travel periods.
Generally, it was expected that surveys were going to be conducted at rest areas, truck stops, and high-volume exits to intercept local travelers, tourists, and commercial operators. State department of transportation (DOT) representatives recommended specific locations to intercept travelers for conducting the survey. More information about the corridor and survey locations is described in the Site Descriptions subsection regarding Traveler Intercept Survey Data Collection.
Sample size calculations were performed to quantify the exact number of travelers that need to be intercepted and surveyed for desired statistical power. In total, it was assumed that a total of 1,920 completed extended questionnaires would be collected across the four corridors.
Table 1 shows an analysis of sample size requirements for detecting specified differences in the true population proportions of two groups of travelers (e.g., comparing the percentage of travelers on I-44 who "strongly agree" that PSAs on DMS are not distracting to those travelers on I-70 that "strongly agree" to the same question). The expected number of 480 completed extended questionnaires per corridor would be sufficient to detect differences as small as 10 percent in the opinions of travelers between any two of the corridors being studied with at least 80 percent statistical power. Statistical power is the probability that the specified difference in populations, if such a difference truly exists, will generate a survey response that correctly concludes a difference between the two populations. The power calculations here were performed in StatXact and are based on a two-sample fisher's exact test comparison of proportions with a Type 1 error rate of 5 percent (probability of erroneously rejecting a hypothesis of difference). The analysis was completed around the most conservative assumption that the two proportions being compared averaged 0.5. This analysis provides assurance that the number of surveys is adequate to statistically identify reasonably modest population response differences (i.e., 10 percent+). If ability to detect smaller differences were important, larger sample sizes would be required. Smaller sample sizes would permit the identification of only very large population differences.
| Statistical Power | Sample Size in Each Group Required to Detect Difference of: 10% | Sample Size in Each Group Required to Detect Difference of: 12.5% | Sample Size in Each Group Required to Detect Difference of: 15% |
|---|---|---|---|
| 80% | 416 | 265 | 191 |
| 90% | 546 | 346 | 244 |
| 95% | 664 | 428 | 296 |
Data Collection Methodology
A qualified team of interviewers was deployed to intercept the required variety and number of travelers at each site, according to the Survey Design and Execution Plan. Each data collection team employed a six-step process to survey travelers:
- Intercept;
- Determine eligibility;
- Recruit;
- Complete the main questionnaire;
- On-site review of data quality;
- Distribute incentives.
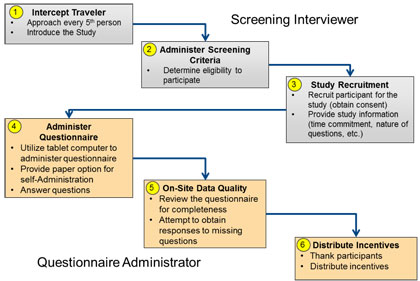
The two team members each conducted two primary responsibilities. First, the team member served as a "screening interviewer" to intercept travelers, determine eligibility, and recruit travelers. After confirming eligibility, the team member served as "questionnaire administrator" to oversee the completion of the main questionnaire, perform on-site data quality procedures, and distribute the incentives. These specific responsibilities are illustrated in Figure 2 and described in greater detail below.
The screening role included the "intercept" and initial recruitment of travelers, i.e., approaching and holding the initial contact with potential participants. Based upon the actual, very low sampling conditions at the rural corridor locations, team members approached every person of driving age as a potential survey participant. Upon approaching a potential participant, the screening interviewer introduced himself or herself, gave a brief explanation of the study, and asked the traveler if he or she had seen a DMS on the corridor, while showing the traveler a picture of a DMS. Generally, travelers were eligible to complete the main questionnaire if they drove along the corridor and had the potential to observe a safety message/PSA. Travelers that had not recently seen a DMS on the corridor with a posted message were deemed ineligible. However, language issues, deafness, or other difficulties that would prohibit the completion of the main questionnaire resulted in ineligibility. Regardless of the eligibility determination, a "disposition" code was entered onto each form to indicate the results of the screening. Examples of disposition codes include (ineligible, eligible, language barrier, etc.).
If the traveler met the eligibility requirement described above, he or she was recruited to complete the main questionnaire. In general, this was not a scripted dialog, but the team member covered these key elements. The key elements included: additional details on the study, an estimated time for completion (the main questionnaire took about three to five minutes to complete), and mention of the incentives.
If successful in recruiting the traveler, the traveler was provided an iPad, which had the questionnaire loaded, using the QuickTap Survey application. The team member assisted the traveler completing the questionnaire on the iPad and was available for answering questions from participants in the process of completing a questionnaire.
After completion of the questionnaire, the questionnaire administrator reviewed the questionnaire on the iPad for completeness. The participant was unable to skip questions given the design of the survey in the QuickTap Survey application, but some participants might have thought they were finished before completing the survey. The review was conducted to ensure that the respondent did not inadvertently skip remaining survey questions. If skipped questions were identified, the team member would attempt to question the respondent to obtain the response.
To encourage a high response rate from travelers, the survey administrators remained professional and courteous at all times. Interviewers dressed appropriate for the weather in clothing that was not offensive to others. Appropriate measures and procedures were followed to assure the safety and security of survey administrators. The use of incentives was determined with input from both Federal Highway Administration (FHWA) and the local agency staff. The incentives given included candy, chips, and bottled water and soda. Following the successful completion of a main questionnaire and subsequent review, the questionnaire administrator was responsible for distributing the appropriate incentives.
Design and Testing of the Survey Instruments
Information was collected from travelers using two different survey instruments: a screening instrument (screening questionnaires) and a more extensive questionnaire (main questionnaire). The screening questionnaire was very brief, interviewer administered, and completed by a larger portion of travelers. The main questionnaire was self-administered using the QuickTap Survey application on an iPad, collected more information, but given only to a subset of travelers. The objective of the screening questionnaire was to assess eligibility, which was determined by the traveler's awareness of an upstream DMS displaying a message. The objective of the main questionnaire was to capture more in-depth observations and opinions on the types of PSAs, the readability, the observed traffic impact, etc.
Defined study hypotheses and measures of effectiveness (see Table 2) guided the development of survey instruments. The screening instrument was a paper form and the main questionnaire resided in the QuickTap Survey application on an iPad. Importantly, the execution of the survey coincided with the posting of planned messages on the DMS. Showing travelers a static image of a DMS from the area facilitated the visual association between the message sign.
| Evaluation Area | Hypotheses | Evaluation Measures |
|---|---|---|
| Awareness | A significant percentage of travelers are aware that safety messages and PSAs are included on DMS | Percentage of respondents aware of PSAs posted on DMS |
| Awareness | A significant percentage of travelers have observed an actual safety message and/or PSA on a DMS | Percentage of respondents reporting seeing a PSA on the traveled corridor |
| Understanding | Drivers can understand the messages on the DMS |
|
| Understanding | Drivers understand the difference between a PSA and a “normal” message | Percentage of respondents that can identify "normal" DMS messages from PSA messages |
| Behavior Changes | The display of a PSA on a DMS does not cause traffic to slow down or other congestion | Percentage of respondents who indicate that they "slow down" or are slowed down by other traffic to read the DMS |
| Behavior Changes | The contents of the PSA cause a change in behavior by the travelers (e.g., more aware, looking for an AMBER alert license plate, etc.) | Percentage of respondents that indicate that they "Agree" or "Strongly Agree" that they have changed their behavior as a result of observing the PSA |
| Opinions | Travelers believe that DMS for safety awareness and PSA messages is appropriate | Percentage of respondents that indicate that they "Agree" or "Strongly Agree" that DMS for safety awareness and PSA messages is appropriate |
| Opinions | Travelers believe that DMS should only be used for traffic-related messages | Percentage of respondents that indicate that they "Agree" or "Strongly Agree" that DMS should be only used for transportation-related messages |
| Opinions | Travelers believe that it would be more effective and/or less distracting to motorists to disseminate safety awareness messages and PSAs via other means | Percentage of respondents that indicate that they "Agree" or "Strongly Agree" that other methods would be more effective and/or less distracting |
| Opinions | Travelers perceive a value of safety awareness and PSA messages on DMS | Percentage of respondents that indicate that they "Agree" or "Strongly Agree" that they see value in including safety awareness and PSA messages on DMS |
The survey instruments were developed in multiple waves: First, a rough draft of the concepts and layout of the survey instruments were developed. Second, a draft version of the survey instruments was prepared within the QuickTap Survey application. A small pre-test of the survey instruments was conducted to identify timing issues, flow of the survey, understanding and comprehensibility, etc. on eight individuals. Following this pretesting of the questionnaire and prior to the data collection initiation, all messages and other corridor-specific information were updated to reflect that site's posted messages, etc.