Guide to Project Coordination for Minimizing Work Zone Mobility Impacts
CHAPTER 4. EXAMPLES OF USEFUL TOOLS TO FACILITATE PROJECT COORDINATION
INTRODUCTION
Good Project Coordination (PC) requires (1) the collection and sharing of timely, accurate project data, (2) an understanding of the potential impacts of each project, and (3) a defined and well thought-out coordination process that is followed by the stakeholders to accomplish PC objectives and thus minimize work zone safety and delay impacts. Project data includes basic information about the location, schedule, scope, cost, and project manager contact information. Quantifying the impact of a project on traffic mobility is more complex and often requires specialized software or skills. While sharing project data and understanding project impacts are both critical elements for good PC, agencies must take the third and final step of developing processes for coordinating projects based on the shared information. Without this final step, true PC does not occur.
TOOLS FOR COLLECTING AND SHARING PROJECT DATA
Collecting and sharing project data (locations, durations, expected impacts upon traffic conditions, and changes to those parameters as a project progresses) is an important element of Project Coordination (PC). Project data of this type is typically readily available within the agency responsible for the work at the beginning of a project, but often deviates somewhat from the initial plan due to various external events. Furthermore, these data from individual projects are not always collected or consolidated across a corridor or region.
Some agencies use consolidated databases which help them track project data across different regions or districts. These databases may be developed internally or purchased from a commercial vendor. In many cases, this information is used for internal coordination and may not be as readily available to stakeholders outside of the agency. In other cases, multiple agencies may share a single database which allows them to upload their project data and view project data from other organizations. One of the biggest challenges to agencies is to identify the proper framework or tool for sharing project data. Maintaining the data in such a database so that it continues to be viewed as relevant (and thus useful) is another challenge. Regular meetings with participants can reinforce the purpose of such a tool and thereby increase its effectiveness.
The following examples are presented to demonstrate the methods by which project data can be shared.
Internet Databases
Internet databases use a web browser interface to access project data. Some databases may be password protected while others are freely available to the public.
Florida Department of Transportation Utility Coordination Website
District 4 of the Florida Department of Transportation (FDOT) maintains a utility coordination web site for three regions within the district: Broward County, Palm Beach County, and Treasure Coast (Indian River, Martin, and St. Lucie counties). (33) Utility conflicts are determined for each project and listed according to the responsible utility company under the Contractor-DOT tab. As shown in Figure 15, the shared data includes the project number, project name, utility company name, conflict location (station & offset), and a work description. Contact information for the utility company is provided on a separate page. (34) Once the utility conflict is resolved, the line item is deleted from the website. This information is freely available to the public and allows all of the different utility companies to access information about other work required on each project. Presently, the impacts of each work effort are not known or tracked, nor is any formal coordination process defined that allows the utilities to work together to reduce those impacts. However, such processes could be established more easily with this type of database than would otherwise be possible.
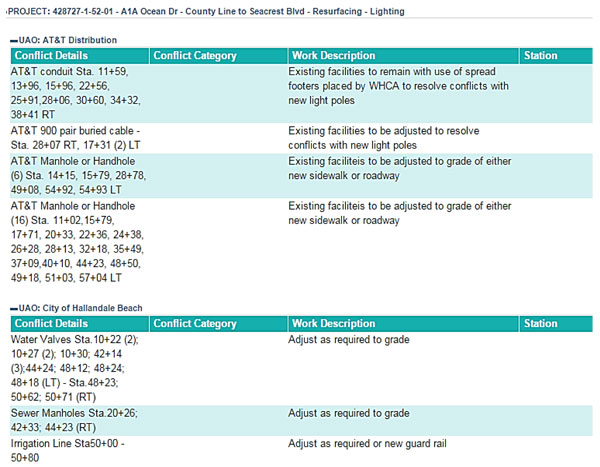
Figure 15. Screen Capture. Florida Department of Transportation District 4 Utility Coordination Information for Project 428727 in Broward County. (35)
Internet Geographic Information System (GIS) Databases
Geographic Information System (GIS) databases are similar in structure to the simpler internet databases described above, but with the ability to allow users to visualize project locations on a base map. This is particularly useful when considering the relative position of projects and their potential impacts to traffic flow. Several cities are using GIS-based software to track projects and reduce the number of pavement cuts required for planned utility work.
City of Baltimore
To encourage better coordination and communication for infrastructure projects, the City of Baltimore implemented a software-based PC system to track all capital and maintenance activities. The system selected by Baltimore to coordinate right-of-way activities was implemented over a two year period. It provides real-time information on infrastructure projects across the City via a web-based system accessible to all of the stakeholder groups. Each project is mapped via GIS data points. A clickable map provides key details such as location, timeline, scope, schedule, cost, and points of contact for each project, similar to the example shown in Figure 16.
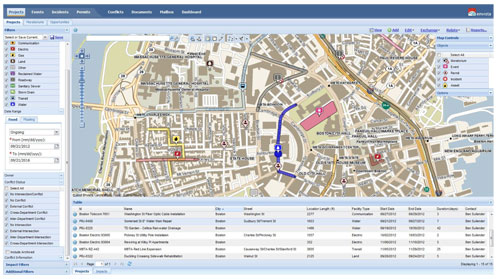
Figure 16. Screen Capture. Geographic Information System-based Project Data Sharing. (36)
While other similar software tools may be available, the City of Baltimore uses a proprietary cloud-based enterprise suite of programs that consolidate and streamline data sharing. For a subscription fee, agencies can access project data planned by others and contribute their planned project data. Agencies who share information include:
- City of Baltimore Department of Public Works.
- City of Baltimore Department of Transportation.
- City of Baltimore Department of General Services.
- Baltimore Gas & Electric (BGE).
- Veolia Energy (provides business district heating and cooling services).
- Verizon (provides telecommunications services). (37)
The City of Baltimore has recognized numerous benefits with the system:
- Improved stakeholder engagement.
- Enhanced traffic management plans and earlier awareness of project impacts.
- Enriched data quality by having up-to-date information about planned work activities.
- Lengthened pavement life due to scheduling utility maintenance activities to occur prior to City resurfacing projects. (38)
Certainly, the availability of such a system could be coupled with traffic analytical tools to allow cumulative effects upon travel conditions to be estimated. Stakeholders could also work together to establish their set of business rules to follow in the event that project conflicts that exceed agreed-upon thresholds are encountered.
District of Columbia Department of Transportation (DDOT)
Similar to the City of Baltimore, the District of Columbia Department of Transportation (DDOT) is also using proprietary software to coordinate road projects—specifically to reduce pavement cuts. Agencies who share information in this user group include:
- DDOT.
- Potomac Electric Power Company (PEPCO).
- Washington Gas.
- District of Columbia Water and Sewer Authority (DC Water). (39)
DDOT created an ordinance in September 2010 requiring all utilities operating in the public right-of-way to use the online map-based service. (40)
City of Palo Alto
A 2006 audit of the City of Palo Alto, California street maintenance program found that street excavations degrade and shorten the life of the City streets. (41) The City Auditor determined that the City’s Public Works Department and the (mostly city-run) utilities did not have cross-departmental information about project schedules and the moratorium status of streets. In addition, operations crews lacked access to GIS data to review, monitor, or record repair and maintenance work. As a result, there was no coordination between departments, resulting in operational conflicts and inefficiencies. One of the auditor’s recommendations was that all departments that cut city streets use a GIS to coordinate their projects and summarize work completed in a timely manner.
In response to the audit, the Public Works Department developed an in-house, GIS-based program to coordinate right-of-way construction. Public Works and utility staff input construction schedules, routinely update project status, and check for conflicting work on street segments. The map, shown in Figure 17, displays pavement and storm drain construction projects that are active or planned within 14 days. (42) The map also shows projects planned for the next four years. As with the other examples in this section, access to current and upcoming project work that may conflict or cause excessive delays and motorist frustration, if performed simultaneously, provides the department with a good opportunity to enact processes that will develop estimates of project impacts and business rules that will guide coordination efforts should proposed project schedules result in estimates of excessive impacts to travelers.
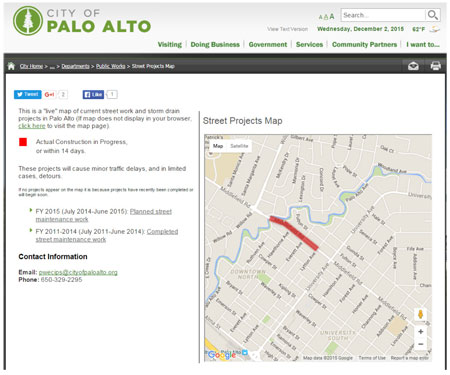
Figure 17. Screen Capture. City of Palo Alto Geographic Information System-based Project Map. (42)
TOOLS FOR ASSESSING WORK ZONE MOBILITY IMPACTS
As suggested earlier in this report, the ability to reasonably estimate the impacts of projects individually, as well as their cumulative effect upon a corridor or region, is an important tool for PC efforts. The ability to identify if and when excessive delays are likely to occur, either individually or collectively due to project activities, provides the impetus to initiate the business processes in place that drive the coordination actions. These tools can also provide ammunition for justifying the required coordination actions, demonstrating the expected mobility and/or safety benefits that are likely to be achieved if the coordination efforts are successful.
A variety of tools are available for assessing work zone mobility impacts. Tools can be simple input-output type or may consist of more complex modeling. FHWA has compiled this information online in a series of Traffic Analysis Toolbox volumes. (43) Several of these documents focus on analysis of work zones. (44,45) A few examples of some additional tools not in the FHWA toolbox are summarized below.
Oregon Department of Transportation
Oregon DOT developed the Work Zone Traffic Analysis (WZTA) tool as a GIS-based data repository for project data with an analytical component that allows for traffic impact assessment. The WZTA was originally developed as a spreadsheet that combined ODOT’s lane restriction methodologies with traffic microsimulation analyses regressed to fit exponential curves. The spreadsheet required minimal input from the analyst to develop lane closure restrictions and estimated project delay. The spreadsheet was later transformed to allow online access and GIS mapping of projects.
The basic steps of Work Zone Traffic Analysis concepts are straightforward:
- Establish the volume of vehicles expected on the highway.
- Determine the appropriate traffic volume threshold for the roadway type, location, and proposed work zone staging strategy.
- Recommend the time windows during which the proposed lane restrictions can be safely applied if the volume is larger than the threshold.
- Estimate the delay based on the staging strategy to be applied and the traffic volumes expected during work hours.
This process results in two outputs:
- Lane restrictions, which are written into the project’s special provisions.
- Estimated delay, which is coordinated with the leaders of other projects on the highway corridor, the Region Mobility Liaison, and/or the Region Mobility Committee. (46)
ODOT’s Work Zone Traffic Analysis tool is available online upon request. The tool is unique in that it shares information about upcoming projects and estimates the traffic impacts of the projects. The framework for the PC process has been established on a statewide basis under the ODOT Mobility Procedures Manual. (28)
Work Zone Impacts and Strategies Estimator (WISE) Software
The Work Zone Impacts and Strategies Estimator (WISE) software tool was developed through the SHRP2 program to evaluate the impacts of various highway projects and compare alternatives. It is open-source software that is available from FHWA. (47) Software support includes a user’s guide. (18) The WISE software analyzes the impacts on road users of multiple, concurrent work zones across a network or complex corridor. This tool is intended to help agencies actually optimize the sequencing of renewal projects and analyze the cost-effectiveness of strategies for the minimization, management, and mitigation of road user costs from safety or operational perspectives. The WISE tool can be used at a planning level as well as the operational level. WISE software provides an integrated framework for users to evaluate planning decisions and operational strategies, eliminating the need to use separate software for model-building. With the integrated framework, planning-level decisions can be based on network- and corridor-level impacts. Users can import traffic networks from existing travel demand models. In addition, the tool has an optimization routine that will recommend efficient staging strategies. WISE can evaluate the impact of changes in route choice behavior, as well as impacts from intelligent transportation systems. (48)
Previous | Next