Guide to Project Coordination for Minimizing Work Zone Mobility Impacts
CHAPTER 3. CASE STUDIES OF PROJECT COORDINATION
Case studies are an effective way of illustrating promising examples of successful Project Coordination (PC) and of highlighting the benefits, lessons learned, and best practices (where applicable) of PC. In this chapter, two PC case studies are described in detail:
- The Texas Department of Transportation (TxDOT) PC efforts during construction to minimize delays along the I-35 corridor.
- The Oregon Department of Transportation (ODOT) PC efforts during project planning and design of a major bridge replacement effort to minimize delays and better accommodate freight trucking crossing the state.
The case studies focus on the actions and strategies that were implemented to achieve the safety and mobility impact reductions desired of PC efforts, methodologies and business processes that were enacted. Key lessons learned are also summarized to aid others who desire to initiate or improve their PC efforts within their jurisdictions.
TEXAS CASE STUDY
Background and Project Coordination Objectives
Within Texas, Interstate 35 (I-35) is a major corridor stretching from the City of Laredo on the international border with Mexico to the Oklahoma state line. Over 30 million travelers per year use the corridor, including large trucks, which typically compose 25 to 35 percent of the traffic volume. Truck traffic volumes can be as high as 80 percent at night.
Starting in 2011, the Texas Department of Transportation embarked on a $2.1 billion project to widen I-35 to six lanes from Hillsboro to a location just south of Salado. This 96-mile segment (shown in Figure 3) consisted of 17 different projects located in the Waco District. Traffic volumes range from 55,000 to 111,000 vehicles per day along the segment, with approximately two thirds of the traffic being thru traffic, meaning that both the origin and destination of these vehicles are located outside of the segment. Construction is ongoing and, at the time of this writing, is expected to continue through 2018. With numerous lane closures and freeway closures anticipated for the widening and related reconstruction of bridges, TxDOT assumed a proactive role in terms of managing construction impacts along the corridor. This construction management plan includes mitigation of lane closure mobility impacts during the operational phase of the project. Many types of lane closures are restricted to nighttime hours. However, with multiple projects occurring simultaneously, drivers traversing the corridor could be exposed to multiple individual lane closures on a single trip. While the impacts from a single lane closure may be tolerable, the cumulative delay from multiple closures could become intolerable. Thus, a means of evaluating corridor delay for individual trips was needed, as well as a mechanism for mitigating the cumulative impacts when multiple, simultaneous lane closures were expected to cause unacceptable impacts to travel times.
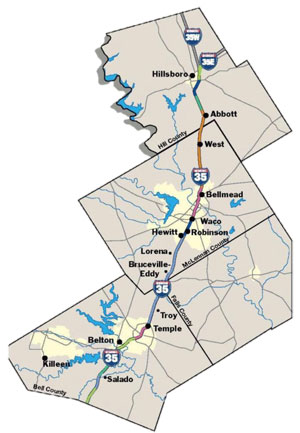
Figure 3. Map. I-35 Construction Limits.
Project Coordination Efforts
To better coordinate project activities and reduce potential traffic impacts along this corridor, TxDOT employed mobility coordinators whose primary function was to watch for potential traffic mobility issues and find ways to resolve those issues before they actually occurred. Much of the coordinators’ job duties involved door-to-door communication with local residents and businesses about upcoming project tasks that would affect access. However, another key job duty was to monitor upcoming lane closure activities planned in the corridor, and work with the contractors if expected traffic impacts on a given night or weekend would likely exceed what was deemed tolerable by TxDOT.
To accomplish this, a system was established for contractors to submit advance notification of plans to close one or more freeway lanes. An overall Construction Traveler Information System (CTIS) was designed and implemented for this construction effort. It included a subsystem (termed the Planned Closure Notification System) that allowed contractors, TxDOT staff, and mobility coordinators to enter lane closure information into a database. Contractors were encouraged to submit advance notification of closures at least seven days prior to the closures. Lane closures were not permitted during daytime hours, so contractor lane closures were limited to the period from 7:00 pm to 7:00 am. The database stores all details of the closures, such as proposed time, date, duration, location, length, etc. Entries could be flagged for immediate publication on a project website or remain private until after certain analyses were performed. Once per minute, the database published an updated data stream which is then polled by other subsystems to perform specialized analyses/functions.
For each lane closure submitted, the CTIS performed an analysis of expected traffic impacts. This occurred within a subsystem termed the Lane Closure Assessment System (LCAS). The LCAS was used to forecast queues and delays for each main lane closure, based on recent traffic volumes acquired through non-intrusive traffic volume and speed sensors located at strategic locations throughout the corridor. The LCAS applied an input-output analysis of expected hourly traffic demands to the estimated work zone capacity of each requested lane closure. When demands exceeded capacity, a queue was predicted, the length of which was estimated based on the number of vehicles estimated to be stored in queue each hour. A traffic flow relationship was used to estimate delays caused by the queue.
For each lane closure in the database, an LCAS report was generated. As shown in Figure 4, the LCAS output included expected queue lengths and delays for individual lane closures. In this case, the LCAS showed that the queue from this closure was expected to reach 1.3 miles in length during the 9:00 pm hour and that the expected delay would be approximately 10.8 minutes per vehicle during that same hour. Because traffic volumes and work zone capacity can vary from expected values on a given day, a “worse-case” scenario was also computed using a 10 percent increase in traffic volume and a 10 percent decrease in work zone capacity. This provided an indication of the possible range of impacts that might be expected. In this example, worse-case queues could possibly be as long as 3.7 miles and worse-case delays may exceed 30 minutes. The impacts of any other lane closures anticipated each night were calculated in a similar manner.
Personnel at the Texas A&M Transportation Institute (TTI) developed an automated system to calculate corridor travel time by direction for various departure points and times each day or night. The system took into account the travel time between lane closures and estimated the expected delay associated with each lane closure corresponding to the calculated arrival times. A segment from mile marker 370 to mile marker 270 was used based on the location of sensors and ease of calculations. Assuming a 60 mph travel speed, the typical corridor travel time was 100 minutes when no lane closures were present.
Figure 5 shows how the system computed cumulative travel times for southbound drivers over the 100 mile segment on April 1, 2015 through four successive lane closures (located at mile markers 336, 297, 293, and 285) scheduled that night. For a trip beginning at 8:00 pm, the estimated corridor travel time was 131.1 minutes which represents a total cumulative delay of 31.1 minutes.
A threshold value of 30 minutes was selected for the maximum allowable corridor delay. Any time that corridor delays in excess of 30 minutes were forecast, mitigation plans were explored. Mitigation plans typically included requesting one contractor to begin work later in the evening or rescheduling for another night when corridor mobility impacts would be reduced. When several different lane closures were requested, consideration is given to the type of work planned, the duration of the work, the distance between the closures, the impacts relative to other requests, the critical nature or priority of the planned work, and the order in which the lane closure requests were received.
Once a mitigation plan was developed and agreed upon, the individual lane closure request was modified and the corridor delay report was regenerated to confirm that the changes would, in fact, reduce predicted motorist delay below 30 minutes. For the example shown in Figure 4, the contractor who requested lane closure number 2822 was asked to delay their lane closure from a 7:00 pm start time to 9:00 pm, when anticipated traffic volumes would be lower, reducing the cumulative delays and trip times directly contributed by this lane closure. Upon agreement by the contractor, TTI personnel regenerated the LCAS Report, shown in Figure 6. In this example, the time shift resulted in a reduction of expected delay for this closure throughout the evening (as compared to Figure 4).
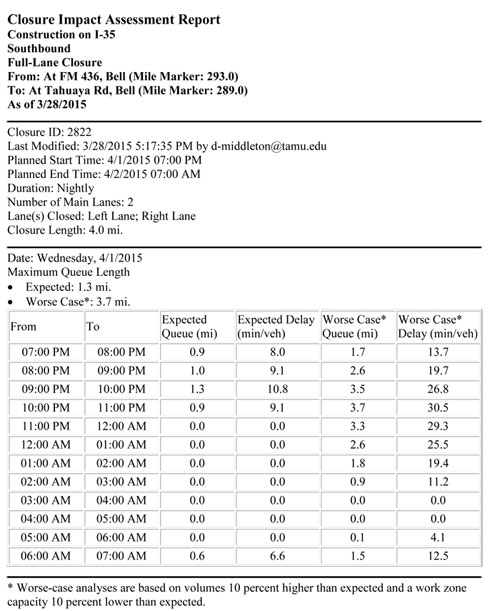
Figure 4. Report. Lane Closure Assessment System Report for Lane Closure 2822 on April 1, 2015.
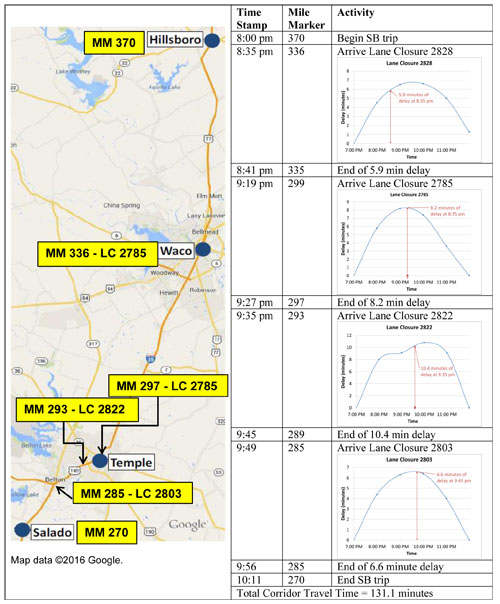
Figure 5. Chart. Southbound Corridor Travel Time Calculation for 8 pm Departure without Coordination.
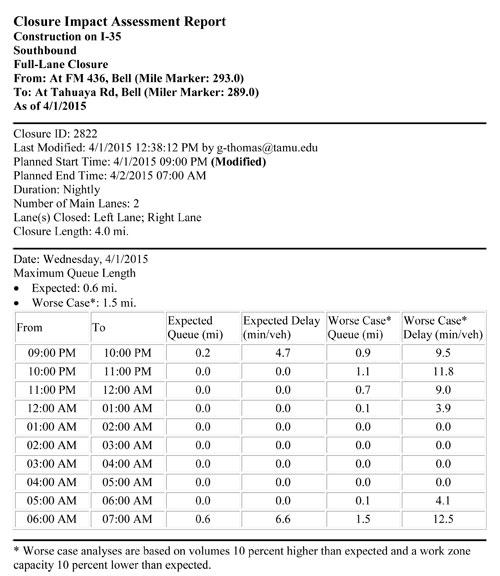
Figure 6. Report. Modified Lane Closure Assessment System Report for Lane Closure 2822 on April 1, 2015.
The corridor travel time was also recomputed and is shown in Figure 7. As expected, shifting the start time of just one of the four planned lane closures resulted in a reduction of expected delay for the entire corridor.
The corridor is well covered with sensors that read and registered timestamps from wireless device signals. By matching signal pairs, speed and travel time data were calculated and stored in a database. For the example on April 1, delays computed from the wireless device data were compared to the expected delays with and without PC for various southbound trip departure times. The results are shown in Figure 8.
The blue line represents the amount of delay expected without any PC at various departure times from Hillsboro in the southbound direction. The maximum delay of 31 minutes was expected for departures beginning between the 8:00 pm and 9:00 pm timeframe. The red line shows the expected delay after delaying one lane closure by two hours (9:00 pm instead of 7:00 pm). Under these conditions, a maximum delay of 24 minutes was expected for vehicles departing just after 8:00 pm. The green line shows the actual delay derived from measured travel times. The net effect of the adjusted start time for one lane closure was a significant reduction in delay. In addition, there was a shift in the peak delay to a time when traffic volumes were lower.
Using this approach, TXDOT had a tool to better manage traffic operations through multiple lane closures and to take corrective measures when projected delays exceed acceptable thresholds. The frequency with which this type of scenario occurred was not well documented, but estimated to be approximately once per month during the construction period. One of the main reasons that this more formalized level of coordination did not have to occur more frequently was because a significant amount of verbal coordination was continually occurring throughout the project. For example, reports of upcoming lane closures were emailed to the contractors on a daily basis. If several lane closures were already planned for a particular night, a contractor may decide not to make his or her request for the same night. In addition, project mobility coordinators attended regular construction meetings and could often avert closure requests for the same night through those conversations. These proactive measures tended to reduce the frequency with which the corridor delay became a more significant issue. Overall, the mobility monitoring program was an effective means of fostering PC between many different projects on I-35 and reducing delay to motorists.
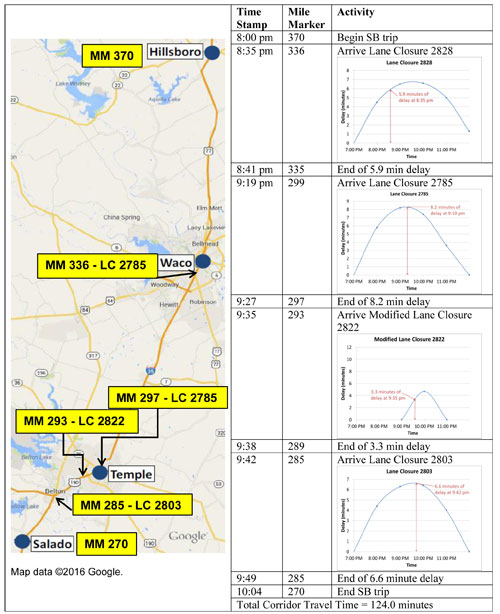
Figure 7. Chart. Southbound Corridor Travel Time Calculation for 8 pm Departure with Coordination.
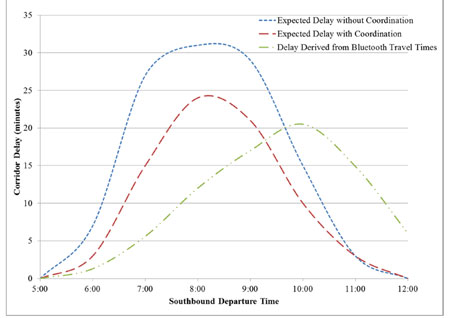
Figure 8. Graph. Southbound Corridor Travel Times on April 1, 2015.
Summary
The Texas case study provides an excellent example of PC strategies that other agencies can adopt and/or adapt to meet their needs. One can see how the various actions undertaken fall into the five basic steps described in Figure 2 to establish a PC process for minimizing delay, as shown below.
Establishing the Project Coordination Vision
TxDOT’s support of PC was apparent when upper management gave directives to manage cumulative impacts to through traffic, as well as impacts to local residents and businesses. A cumulative delay threshold of 30 minutes was established for through traffic.
Developing Details of How Coordination Will Occur
To meet the coordination goals of the project, mobility coordinator positions were created. In addition, processes were established to collect and analyze the data needed to estimate anticipated cumulative mobility impacts. Contractor coordination was to be facilitated through the mobility coordinators.
Educating and Informing Internal and External Stakeholders
The mobility coordinators participated in weekly project meetings to address potential issues not already resolved a lower levels. In addition, the mobility coordinators maintained communication with local communities and key stakeholder groups.
Implementing the Project Coordination Process
The mobility coordinators made regular presentations to city councils, shipping companies, local businesses and residents to keep them informed of upcoming events in the corridor, address concerns, and receive information that may influence traffic control decisions. The coordinators individually contacted business owners prior to major access disruptions. Throughout construction, the mobility coordinators maintained cooperative resolution of multiple lane closure nights when excessive cumulative delays were anticipated.
Refining the Process
There was initially some hesitation by contractors to coordinate their lane closures. However, cooperation levels increased as trust between mobility coordinators and contractors increased.
OREGON CASE STUDY
Background and Project Coordination Objectives
Under the Oregon Transportation Investment Act (OTIA) III State Bridge Delivery Program, the Oregon Department of Transportation (ODOT) planned to repair or replace over 300 bridges throughout the state over a span of eight years and at a cost of over $1.3 billion. (21,22) The Bridge Delivery Program began in 2004. (23) The planned projects are shown in Figure 9.
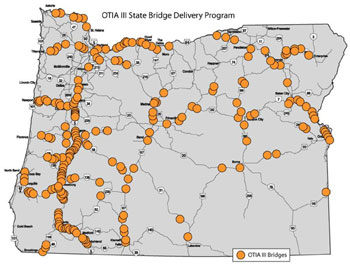
Figure 9. Map. Location of Bridges in the State Bridge Delivery Program. (21, 22)
Due to the age and weight limits of Oregon’s older bridges, freight mobility would be significantly impacted if the sequencing of these projects were not coordinated in some fashion. To avoid major economic impacts of these mobility issues, the Oregon Bridge Delivery Partners (OBDP), a private management firm, was formed to manage mobility. OBDP worked closely with ODOT and other stakeholders to address mobility impacts through Project Coordination (PC) strategies. The structure of ODOT is divided into five main geographical regions. These regions are shown in Figure 10. While Region 1 is the smallest geographically, it is the most urbanized of the five regions and serves the Port of Portland. Maintaining mobility in this region was critical for freight routes. ODOT’s goal was to maintain at least one major north-south and, at least, one major east-west corridor unrestricted for the freight industry and the traveling public. Regions 2 and 3 both include the I-5 corridor and the state’s coastal highways. Regions 4 and 5 are more rural in nature, but both provide alternate routes for freight to move across the state from Portland. In order to keep traffic moving during the bridge projects, statewide, corridor, and regional mobility coordination would all be required.
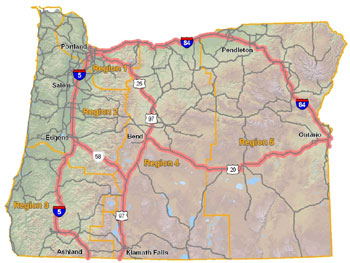
Figure 10. Map. Oregon DOT Regions. (22)
Project Coordination Efforts
OBDP took a two-fold approach to Project Coordination (PC) which included maximizing mobility from the standpoint of an assessment of physical restrictions (primarily for freight) and from a traffic delay standpoint (for the traveling public).
In order to maximize mobility from a physical restriction standpoint, the capacity of each network segment to handle permit loads (i.e., overweight, overwidth, overheight and overlength trucks) was required. In some cases, the terrain naturally limited viable detours, but the goal was to accommodate freight along corridors by identifying the significance of physical restrictions to each segment required by the necessary bridge projects.
In order to maximize mobility from a traffic delay standpoint, OBDP broke the roadway network into corridors and segments. With known pre-construction travel times, they calculated and aggregated the estimated delays anticipated during construction. The results of the delay analyses were used to make decisions about the choice of construction staging strategies and the construction schedule. The key corridors were divided into smaller segments. Delay and travel time thresholds were established for each segment. These thresholds were enforced 24 hours per day, 365 days per year.
Physical Restriction Analysis
Most freight movement (approximately 75 percent) in Oregon is by truck. With limited options for detours, keeping existing roads open in order to minimize impacts to freight was very important. Freight impacts could be caused by restrictions on the height, width, length or weight of vehicles that would be allowed to traverse the roadway through a particular project. ODOT wanted to ensure that freight movement was not cut off from entire sections of the state and that through freight traffic would still have a continuous route across the state during the construction effort. Collaboration with the trucking industry was critical during project development to ensure the design and staging solutions met the needs of the trucking industry and ODOT. (24)
Based on a detailed analysis of the aging bridges in Oregon, a prioritization strategy was recommended by the ODOT Economic and Bridge Options Team. The team strongly supported the concept of staging the bridge projects by starting with freight corridor alternatives in central and eastern Oregon and leaving the interstates for later. (25) The resulting construction staging map is shown in Figure 11. Stage 1 routes depict the alternate routes for I-5 and I-84 that were recommended to be completed first so that they could serve as alternate freight routes during the majority of the construction. The resultant route staging served as a basis for organizing the sequence of work. However, decisions still had to be made regarding the coordination of projects within each key corridor.
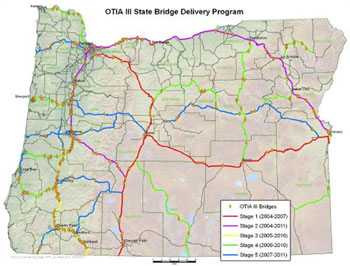
Figure 11. Map. Oregon Bridge Delivery Partners Construction Stages for Corridors. (26)
Within specific areas, the construction routing stages had some overlap. Therefore, ODOT’s Motor Carrier Transport Division (MCTD) had to develop a means of tracking the unrestricted routes throughout the duration of all of the bridge projects. This tracking was accomplished with a freight mobility map, shown in Figure 12. The color-coded map was created to aid planners and other ODOT staff in keeping freight moving through and around work zones. The map displays routes and dimensions authorized by most over-dimension permits, display restricted routes, and aides in determining viable detour routes. Using this map, the MCTD could examine all oversize permit applications received, and quickly determine if the proposed route had physical restrictions that would not allow it to accommodate the load. An alternative route could also quickly be identified and provided back to the permit requestor.
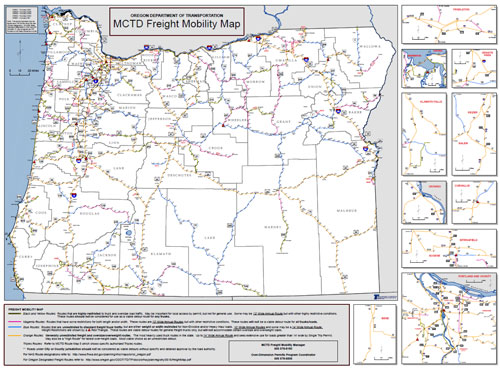
Figure 12. Map. Motor Carrier Transport Division Freight Mobility Map. (27)
Traffic Delay Analysis
In order to address the multi-level mobility coordination needs, ODOT established the position of Statewide Traffic Mobility Manager to oversee all of the mobility activities and processes throughout the state. This position is also responsible for resolving issues between parties within ODOT and with outside stakeholders at the statewide level. The processes established for maintaining mobility were developed and published in a document now known as the Mobility Procedures Manual. (28) The Manual explains how delays and physical restrictions are addressed statewide and provides a reference for traffic control designers to understand the requirements in each key corridor. Chapter 2 of the Mobility Procedures Manual defines how communication is to occur when addressing mobility issues, describes roles and responsibilities of the parties, and outlines a process for resolving mobility issues. (28)
For each key corridor, a Corridor Mobility Committee was formed. Chaired by the ODOT Statewide Traffic Mobility Manager, each committee included OBDP representatives and ODOT representatives from each region traversed by the corridor. Monthly meetings (or more frequently as needed) were used to focus on corridor-level mobility issues and inter-regional coordination. These committees were responsible for managing delay along each corridor through the use of delay thresholds established for each corridor. (22)
Region Mobility Liaisons were responsible for ensuring collaboration among the stakeholders within each of the five ODOT regions. Decisions regarding project scheduling were often dependent upon funding windows, the priority of the work needed, and contractor resources. Approximately 80 to 90 percent of delay conflicts were resolved at this level. (29)
Delay was defined as the additional time required to travel from one point to another as a result of work zones activities. (21) Establishing the delay thresholds in the early stages of the projects was important because the designers were required to consider them when developing the staging of their projects. (22) To accomplish this, the corridors were broken into segments and each segment was assigned a delay threshold. The delay thresholds were to be continuously enforced unless a delay exception was requested and granted by the ODOT Statewide Traffic Mobility Manager. Delay exceptions were requested as a last resort. Thus, over the entire eight years of the bridge program, exceptions were only requested about once per month. (29) The key corridors were divided into shorter travel segments ranging in length from six to 116 miles, but most were 40-70 miles in length. These corridors and segments are shown in Figure 13.
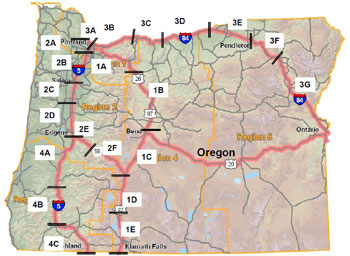
Figure 13. Map. Corridor Segments. (30)
Delay thresholds were established for each segment. These delays were based on factors such as the length of the segment and whether the area was urban, suburban, or rural. The goal was to keep the total delay along key corridors down to a tolerable level. The first step was to use the segment length and speed limits to calculate off-peak travel times for each segment. Next, travel times for peak travel conditions were estimated by increasing the off-peak travel times by particular percentages: 45 percent for urban areas, 30 percent for semi-urban (suburban), and ten percent for all other areas. The delay thresholds were then calculated to be ten percent of the peak travel times. For example, Segment 4C is located on the I-5 corridor and extends from U.S. Highway 199 to the California state line. The length of this segment is 55 miles. The assumed travel speed (in this case, the posted speed limit) is 65 mph. This segment is classified as semi-urban. During the peak commuting time with no construction, the travel time is 51 minutes. The estimated peak travel time is calculated to be 67 minutes (30 percent more than off-peak). Using a maximum allowable delay of ten percent, the calculated delay threshold was 6.7 minutes, which was rounded up to seven minutes. This delay threshold was a constant value held throughout the day. If multiple active work zones were scheduled in the segment, the cumulative delay for all could not exceed seven minutes. Corridor Level TMPs were developed for each corridor and documented the tabulated delay thresholds for each segment.
In the highly urbanized Region 1, which includes the Portland metropolitan area, roadway work is limited to overnight hours under almost all circumstances. Region 1 is unique because the traffic patterns are heavily influenced by commuters and congestion levels are much higher than anywhere else in the state. The ten percent delay maximum would be almost impossible to meet, even at night. Commuters in this area expect and tolerate more significant impacts to travel time than elsewhere in the state. Thus, a different threshold method was used for Region 1: maximum allowable travel time threshold. The maximum allowable travel time threshold was equal to the peak commuter travel time. Using travel time as the threshold for the purposes of mobility management was still restrictive enough to prohibit lane closures during peak hours while allowing additional flexibility during off-peak hours. (31)
Each region has a Region Mobility and Operations Committee that focuses on mobility issues of their projects and shares information with OBDP representatives. This includes their knowledge of maintenance projects that also need to be coordinated with the bridge projects. Project delays were estimated in the regions and then compared to the delay thresholds to determine how the projects would be scheduled. The expected segment delay was computed by aggregating the individual delays for all active projects within that segment. For example, Figure 14 shows three bridge projects scheduled during the same stage in segment 4A on I-5. The Corridor Level TMP for this segment shows that the calculated delay threshold for this segment is seven minutes. (32)
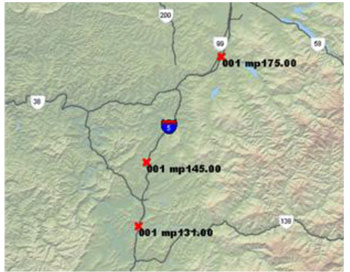
Figure 14. Map. Three Bridge Projects in Segment 4A. (32)
For each of the three projects, the expected delay was computed using ODOT’s Work Zone Traffic Analysis (WZTA) tool. The tool is pre-loaded with roadway data such as route numbers, mile points, area type, related jurisdictions, roadway type, terrain, posted speed limit, number of lanes, paved surface width, and functional class. Traffic data includes Annual Average Daily Traffic (AADT) volumes, historic truck percentages, and horizontal and vertical grade information. The tool also has a Geographic Information System (GIS) interface that allows users to access data collected by and computed from nearby Automatic Traffic Recorders (ATRs), including seasonal trend data. The tool makes easy work of gathering the information required for calculating expected delay. For each of the three bridge projects, the individual delay was not expected to exceed three minutes. However, cumulatively, the predicted delay was estimated at around eight minutes, which exceeded the seven minute delay threshold.
Each project was assessed to determine if changes to the schedule were possible. In this case, potential conflicts with a limited, in-water work window would have been created, so a schedule shift was not possible. The remaining options included:
- Design change to maintain two lanes in each direction during construction.
- Construction of a temporary diversion structure in the median to maintain all lanes.
- Request of a delay exception.
After careful consideration, a diversion structure in the median was the chosen solution. All three projects were reconsidered to determine which project could more readily accommodate the temporary diversion structure, and that outcome was incorporated into the construction plans for that project. The result was that the expected cumulative delay under the new scenario would be less than seven minutes.
Overall the Oregon Bridge Delivery Program was a successful example of good PC. ODOT recognizes the benefits of their coordination efforts, including:
- Minimizing cumulative delays to individual travelers through multiple projects.
- Improving evaluations of the mobility trade-offs between project alternatives.
- Coordinating maintenance and construction work on parallel routes.
- Enhancing communication of delays and restrictions to the trucking industry and general public.
- Collaborating with the freight industry to address mobility issues was improved. (26)
Summary
The Oregon case study provides excellent examples that other agencies can adopt and/or adapt into their own systems. ODOT followed the steps described in Figure 2 to establish a PC process for minimizing delay and enhancing freight mobility.
Establishing the Project Coordination Vision
Oregon DOT’s support of Project Coordination (PC) was clear in directives originating from the Director of ODOT, which included designation of an MCTD Mobility Coordinator to work with the trucking industry to address their concerns. A coordination committee was established, consisting of decision-makers from multiple divisions of the department (design, contracting, construction, maintenance, traffic, public information, etc.). The committee and established subcommittees worked to develop guidance on the overall coordination approach to be followed and required memorandums of understanding.
During the bridge projects, keeping traffic and freight moving was one of the top priorities of the Governor, Legislature, and the Director. The budget note to House Bill 2041 (OTIA III legislation) directed ODOT to develop a strategy that maximized the ease of traffic and freight movement throughout the state.
ODOT developed a statewide traffic mobility program which has been successfully responsible in coordinating efforts, forecasting potential conflicts, and resolving issues. In the ODOT Mobility Procedures Manual, specific notification requirements and communication processes are well-defined. In addition, roles and responsibilities are defined for the ODOT Mobility Policy Committee, the ODOT MCTD, each ODOT region mobility liaison and mobility committee, area managers, district managers, project managers, project staff, and consultants, etc.
Developing Details of How Coordination Will Occur
OBDP determined what data needed to be obtained and collected to support project coordination efforts, and developed a spreadsheet-based work zone delay analysis tool which served as the basis for development of the WZTA software currently in use by ODOT statewide. Most of the data needed to compute cumulative delay from multiple bridge projects could now be preloaded into the WZTA database to speed the calculation process. The MCTD Freight Mobility Map also proved to be an essential tool for maintaining freight routes statewide.
ODOT establish a decision-making process for how PC would be achieved amongst stakeholders by coordinating on three levels: At the program level, mobility coordinators were to maintain an unrestricted freight route for north-south and east-west traffic through Oregon. At the corridor-level, they monitored each corridor and didn’t let delays exceed maximum limits. They also determined how many projects could be under way concurrently. At the project-level, coordinators ensured that each project observed the minimum mobility requirements for maintaining unrestricted freight routes.
Educating and Informing Internal and External Stakeholders
The primary reasons provided for minimizing delay and keeping freight moving were related to Oregon’s economy. Because trucking is Oregon’s dominant mode for freight transportation, maintaining mobility was focused on ensuring access to jobs, services, and markets. Efforts were made to ensure that agency staff understood what was expected of them relative to project coordination, and what they needed to do to ensure that coordination did occur. Staff were re-trained periodically as changes in procedures occurred and/or turnover in staffing occurred.
Staff actively addresses mobility early in the planning, design, and construction processes. The Mobility Policy Committee (MPC) of senior management was established to set process and policy direction. This committee consists of the administrators of Motor Carrier, Highway, and Transportation Development, as well as the Deputy Director for Operations. If issues were not resolved at lower levels within ODOT, the MPC would step in to resolve them.
Implementing the Project Coordination Process
A number of tools were developed to implement the coordination process, ranging from delay analyses to lane closure scheduling restrictions. Coordination meetings were held regularly to share information about what was planned and what was occurring. Any updates to the coordination process were also shared and vetted during these meetings. Potential conflicts (if any) were identified, and efforts taken as necessary (and as previously outlined in the coordination procedures) to resolve them. If the conflicts could not be resolved, a specific escalation process (also previously identified in the procedures) was initiated to be addressed at higher levels within the affected agencies and organizations.
Projects were tracked and incorporated into analyses at various levels of detail depending on where they were in the project development and delivery cycle. Projects several years out were incorporated based on general traffic impact expectations and schedule to the extent known. As project letting got closer, analyses were updated to consider the refined project staging and schedule to better estimate expected traffic impacts. Once the project was let and work was underway, efforts focused more on monitoring current construction activities and coordinating daily activities as needed between projects.
Refining the Process
The coordination committee reviewed and updated the coordination procedures several times during the early phases of implementation. Some necessary adjustments were identified during early reviews of the procedures, whereas others were uncovered during training and education efforts undertaken in step 3. Once these initial refinements were accomplished, updates or changes became less frequent, usually in response to an unusual conflict or challenge that arose.
Previous | Next