Office of Operations
21st Century Operations Using 21st Century Technologies

Next Generation Traveler Information System: A Five Year Outlook

CHAPTER 3. TECHNOLOGY ROADMAP (2014-2020)

The Technology Roadmap provides a snapshot of today's technology landscape, and projects likely evolution based on emerging technologies, as well as the lifecycles and adoption of existing and new solutions. Questions considered include:

  • What are the most popular ways for travelers to obtain information, pre-trip and en route?
  • What are the back-end data issues with managing large data volumes?
  • What is the latest on data quality standards and improvements?
  • What likely impacts will technology advances have on current information delivery technology? For example, how will advances in cloud-based services and in-vehicle devices with innovative voice-based transactions and heads-up displays impact traveler information dissemination? Also, what about connected vehicles?
  • Will Interactive Voice Response (IVR), Highway Advisory Radio (HAR) and 511 still be viable delivery methods in the future?
  • Will social media meet the need? Will there be gaps to be filled and how?

This chapter includes:

  • Offerings and Offering Trends.
  • Technology and Deployment Trends.

3.1 OFFERINGS AND OFFERING TRENDS

3.1.1 Today's Offerings

The list of ways for travelers to get traveler information continues to grow, as dozens of permutations of new solutions, such as apps and social media, are added. Currently available platforms include:

  • FM and AM radio, including highway advisory radio (HAR) and Radio Data System – Traffic Message Channel (RDS-TMC).
  • Broadcast TV.
  • In-vehicle infotainment systems (built-in and aftermarket).
  • Cellphones.
  • Smartphones and other smart devices (tablets, etc.).
  • Desktop computers.
  • Infrastructure signage such as Dynamic Message Signs (DMS) and real-time transit information signs.

While growth in newer solutions has been explosive, studies show that the more traditional means of accessing information still receive substantial use. In particular, some studies show TV, radio, and non-mobile websites are still being used the majority of the time for pre-trip review (Robinson, Jacobs, Frankle, Serulle, & Pack, 2012). En route, the leading source of information remains radio, with DMS coming in second.

Newer solutions such as mobile sites and apps are now running third for pre-trip and en route use according to several recent studies. It is reasonable to expect that growth of these tools will continue.

However, it remains critical to carefully track both actual usage and the impact of that usage on behavior in order to determine the correct timing for phasing in traveler information solutions appropriate to both key user communities and overall transportation goals. Each type of social media has its pros and cons for different operational situations. For example, when communicating transit information to users, social media may be much more helpful for services which operate every hour (or less) than those which have lower service frequencies. One detailed example of considering the potential impact on user behavior is shown in Figure 12 below (Pender, 2014). In this example, transportation system characteristics (network context, system characteristics) are mapped to social media application.

Illustration of transportation system characteristics (network context, system characteristics) mapped to social media application.
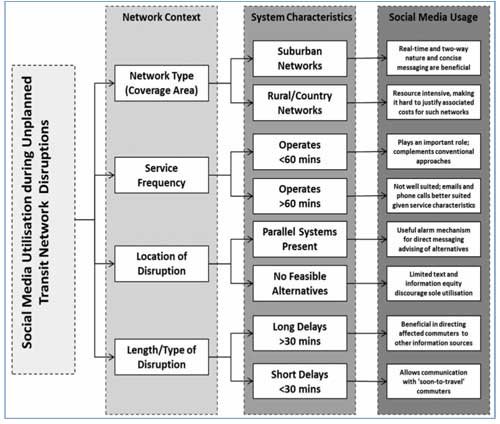
Figure 12. Chart. Impact of Social Media in Multiple Operational Contexts (Pender, 2014)

3.1.2 Offering Trends

The trend in new traveler information offerings follows the information need characteristics discussed above, as providers strive to provide functionality which supports anytime/anywhere availability, contextualized data, and machine-useable ambient data.

A few recently announced examples include:

  • INRIX now offers an app that provides a "driver-friendly user interface" on certain Samsung phones. It is specifically described as making it easier to get traffic information with best routes, travel times, and estimated times of arrival (ETAs), as well as real-time en route voice alerts about incidents, nearby parking locations, and best price gas stations (INRIX, 2015 ).
  • Google Maps now offers a "faster route" alert solution for Android and iOS (see Figure 13), which lets users know when a better route becomes available (Protalinski, 2014).
  • TomTom provides real-time "Jam Ahead" warnings, to make consumers aware that they are nearing the tail of a traffic jam queue. This solution is described as a safety offering, helping travelers slow down before encountering slowed or stopped traffic (TomTom, 2013).
Two pictures of Google Maps new faster route feature on smart phones.
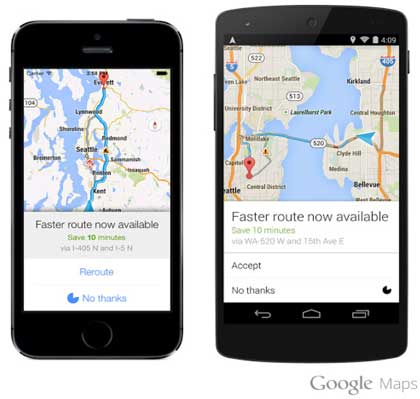
Figure 13. Photo. Google Maps "Faster Route" Feature (Google.com)

Google and the Google logo are registered trademarks of Google Inc., used with permission.

3.1.3 Offering Gap Analysis

When determining appropriate NGTIS offerings, it is helpful to generate a baseline by considering both the overall goals of the agencies involved and the specific needs of the major traveler segments to be served. A gap analysis involves comparing existing offering functionality with this baseline to identify unmet needs, i.e., gaps. For example, if provision of high quality traffic-responsive routing is required, then arterial data availability may become a key gap to address. As is shown in Figure 14 arterial agencies are less likely to disseminate various types of traveler information.

This analysis will vary by locality, but there are some items which have been consistently identified as gaps and may serve as a useful starting point for these considerations:

  • Data type issues.
    • Are the available data sets sufficient to support desired functionality?
  • Coverage issues.
    • Is the available geographic, modal, and road classification coverage enough to enable needed capabilities?
  • Integration issues.
    • Is there sufficient cross-jurisdictional integration to support inter-regional and intermodal travel?
    • Are various types of traveler information siloed within departments and agencies, reducing potential functionality?
    • Is the NGTIS offering suite fragmented across platforms, making it difficult to promote availability and value to consumers?
Graph showing the percentage of information types disseminated by freeway and arterial agencies with freeways.  On all traveler information types, freeways report a higher percentage.
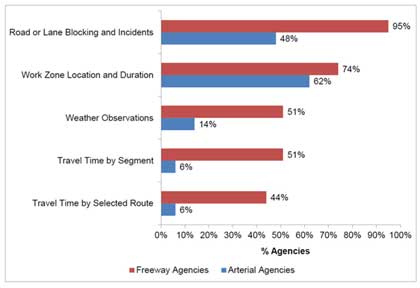
Figure 14. Graph. Information Types Disseminated by Freeway and Arterial Agencies
(Gordon & Trombly, 2014)

3.2 TECHNOLOGY AND DEPLOYMENT TRENDS

Building, operating, and enhancing an NGTIS requires an increasingly complex suite of technologies, including:

  • Collection. Solutions in this area may include everything from traditional loop detectors to modern probe and crowdsourcing.
  • Aggregation and Analysis. Once data are collected, a rapidly expanding array of capabilities is available to combine large sets of similar and related data for transformation into high value information for use throughout the transportation management system.
  • Delivery. A variety of mechanisms exist for transporting traveler information from sources to users, including radio, TV, and the internet, as well as providing a means for travelers to interact with NGTIS information, including websites, IVRs, apps, etc.

Each of these areas is currently quite dynamic, with new solutions emerging and costs dropping at an unprecedented rate. This section will take a look at highlights for each area.

3.2.1 Collection Technologies

Data collection has historically been based on static sensors placed at or in the roadside, such as loop detectors, cameras, toll tag readers, and more recently, Bluetooth readers which register passing cellphones. Significant deployments of these technologies are in operation, and further ones are planned. At the same time, there is a new emphasis on mobile sensors which can be rapidly and broadly deployed. These solutions include:

  • GPS probes installed in various fleets.
  • Anonymous or opt-in collection of consumer smartphone data.
  • Anonymous or opt-in collection of consumer vehicle data.
  • Citizen reporting via voice or automated tools.

These mobile solutions are particularly appealing because they have no right-of-way restrictions, and may not require that traffic collectors deploy much physical infrastructure beyond the back-end processing needed to handle the data. In fact, these solutions have done so well that some industry commenters have started to consider a future in which mobile sensors become the exclusive source of traffic data. It is unclear that such a change is feasible at this stage, but the possibility is certainly one that should be monitored closely over time using consistent metrics such as quality, reliability, and cost. A summary view of traffic data collection technologies is shown below in Figure 15.

As a result of the addition of new probe capabilities, more traffic and traveler data streams are becoming widely available. Basic issues, like cross-source location referencing and overall data security, have not gone away, but the number of real-time data points to be managed on a daily basis has soared into the billions. Particularly in the case of probe data, this significantly increases the complexity of managing this information.

Illustration showing a summary view of traffic data collection technologies for flow and incident issues.
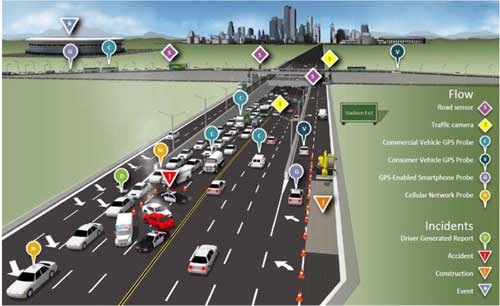
Figure 15. Illustration. Traffic Data Collection Technologies (INRIX.com)

Detailed state of the practice summaries of arterial and rural solutions can be found in Travel Time on Arterials and Rural Highways: State-of-the-Practice Synthesis on Arterial Data Collection Technology (Singer, Robinson, Krueger, Atkinson, & Myers, 2013).

3.2.1.1 Data Quality Standards

The Real-Time System Management Information Program (RTSMIP) provides a baseline for traffic quality levels, as shown in Table 2 below. There is ongoing work to provide consensus standards for measuring this quality. The American Society for Testing and Materials (ASTM) in particular has a number of activities in this area:

  • ASTM WK27028 New Test Methods for Evaluating Travel Time Data Quality.
  • ASTM WK35821 New Specification for / Guide for Highway Classification Systems with User Requirements and Test Methods.
  • ASTM WK35917 New Specification for Archiving Traffic Incident Characteristics and Management Data.

Older standards in this space include ASTM's series of E-standards and Federal Geographic Data Committee (FGDC) International Organization for Standardization (ISO) and Department of Defense (DOD) guidelines:

  • ASTM E2759-10 Standard Practice for Highway Traffic Monitoring Truth-in-Data.
  • ASTM E2259 Guide for Archiving and Retrieving Intelligent Transportation Systems-Generated Data.
  • ASTM E2468 Practice for Metadata to Support Archived Data Management Systems.
  • ASTM E2532 Test Methods for Evaluating Performance of Highway Traffic Monitoring Devices.
  • ASTM E2665 Specification for Archiving ITS-Generated Traffic Monitoring Data.
  • ASTM E2667 Practice for Acquiring Intersection Turning Movement Traffic Data.
  • FGDC-STD-001-1998 and ISO DIS 19115 (metadata) guidelines for quality advanced traveler information system (ATIS) data (ITS America 2000).
  • DOD Guidelines on Data Quality Management.
Table 2. RTSMIP Minimum Quality Levels (Title 23 CFR Part 511)
Category of Information Timelines – Interstate Highways (Statewide) Timelines – Limited Access Roadways In Metropolitan Areas Availability Accuracy
Construction Activities 20 minutes 10 minutes 90% 85%
Roadway or lane-blocking incidents 20 minutes 10 minutes 90% 85%
Roadway weather observations 20 minutes 20 minutes 90% 85%
Travel time/speed information N/A 10 minutes 90% 85%

3.2.1.2 Data Quality Improvements

Public and private sector data managers are continuously working to improve data quality. One recent example is the focus on sub-TMC granularity. At a January 2015 conference, three major traffic data vendors reported that they are now able to offer sub-TMC link level data. This is a relatively new offering, and discussions are underway about access and effective operational use of this information. (Hamedi, 2015)

3.2.2 Aggregation and Analysis Technologies

The largest trend in data aggregation is the rapidly increasing ability to fuse and analyze data sets for improved NGTIS end product functionality. One area which illustrates this trend particularly well is predictive traffic.

Travel time prediction has been a major focus of advanced traveler information systems in recent years. Travelers can use travel time if accurately predicted to make informed decision both pre-trip and en route. Predicted travel time information can also be used as inputs to optimize network capacity and reduce bottlenecks using various active transportation and demand management (ATDM) strategies.

Several travel time prediction techniques have been developed. These techniques can be categorized into two approaches: (a) regression-based methods and (b) machine learning methods. The travel time data can come from various sources including toll tags, fixed sensors, and Bluetooth probes. Research also captures the effect of weather on the predicted travel time using toll tag readings as a data source (Faouzi, Billot, & Bouzebda, 2010). Specific examples include:

  • TomTom claims to be the first company to use real-time weather information to calculate routes and arrival times commercially (TomTom, 2014).
  • IBM's "Smarter Traveler" traffic prediction tool, developed with the help of University of California Berkeley's Mobile Millennium project team and the California Department of Transportation (Caltrans). The tool relies on predictive analytics software, crowd-sourced GPS monitoring, and permanent infrastructure sensors. The predictive system is built upon a control theory and machine learning methods. The system can offer alerts and build a custom model for each individual's commuter route (Melanson, 2011).
  • Microsoft's Clearflow project focused on applying machine learning to learn how to predict the flows on all street segments of a greater city area. The algorithm is based on crowdsourcing of GPS data from volunteers, buses, and paratransit vehicles for over five years. The data was used to identify dependencies among flows based on various attributes of road network and topology in order to build predictive models. Clearflow traffic-sensitive directions were first available in the spring of 2008 and have been integrated into Bing Directions (Predictive Analytics for Traffic, n.d.).
  • The Daily Commute app compiles the individual traveler's data from previous commutes to predict how long the travel time will be on a daily basis, and lets the user know how much time he/she should budget before embarking on the trip. The application builds a custom model using average values on a weekly and yearly basis and becomes more intelligent with frequent use (Commute, n.d.).

3.2.3 Delivery Technologies

Delivery technologies span a wide range of solution types and technologies. Deployment of many of these solutions has reached very high levels among freeway agencies, with transit agencies focusing primarily on web-based solutions (Figure 16 and Figure 17).

Graph of the different media types used by transit agencies for static messages such as transit routes, schedules and fares versus dynamic messages such as real-time schedule adherence.
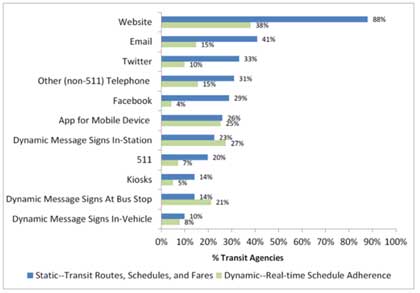
Figure 16. Graph. Media Used by Transit Agencies (Gordon & Trombly, 2014)

Graph of the traveler information distribution methods by freeway and arterial agencies.
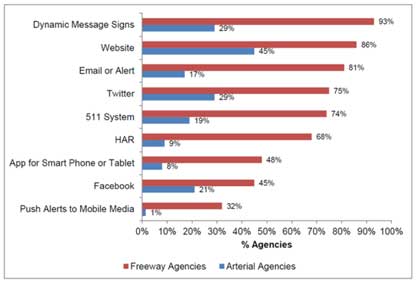
Figure 17. Graph. Traveler Information Distribution Methods –
Freeway and Arterial Agencies (Gordon & Trombly, 2014)

In order to properly assess delivery options, it is helpful to organize current and emerging technologies into three categories – communications channels, hardware platforms, and presentation software – as shown in Table 3. Table 3 also highlights the relative momentum of key technologies. Further detail about these technologies is provided in the subsections below.

Table 3. Traveler Information Delivery Technology Categories (SCG)
Communications Channels Hardware Platforms Presentation Software Offering Notes
Radio (AM, FM, & Radio Data System - Traffic Message Channel)
Broadcast TV
Green circle = High momentum Cellular
Landline telephone
Cable/fiber
Blue triangle = Declining In-vehicle infotainment
In-vehicle connected safety
Green circle = High momentum Smartphones
Cellphones
Smart Devices
Wireless roadside devices (e.g., DMS)
Desk phone
Desktop
Wired roadside devices
TV sets
Blue triangle = Declining Vehicle-based applications
Green circle = High momentum Mobile applications
Green circle = High momentum Networked applications (e.g., social media, crowdsource)
Interactive Voice Response (IVR)
Website
Red square = Emerging Highway Advisory Radio (HAR) is AM version of this
511 as brand (vs. technology)
Red square = Emerging 511 (traditional landline phone-based)
Green circle = High momentum High momentum
Red square = Emerging Emerging
Blue triangle = Declining Declining

3.2.3.1 Communications Channels

Looking at national trends, FM radio, TV, and landline telephone use are all declining overall, in favor of mobile device options. However, usage of these traditional media for traveler information is still quite strong, as shown in the section 3.1.1 titled "Today's Offerings" earlier in this chapter.

HAR is a more challenging area. Some studies show a user base of between 15-20 percent, but there is little recent data (Robinson, Jacobs, Frankle, Serulle, & Pack, 2012). Anecdotal reports trend towards a belief that HAR usage is steadily declining (CTC & Associates LLC, 2011). It seems reasonable to project a continued downward trend for this technology overall.

HAR is, however, a reliable emergency backup to mobile networks for certain geographic regions and traveler populations, and as such, should be carefully considered as an option in the overall NGTIS communication mix. In May 2015, for example, the Tennessee DOT reported removing HAR in urban areas, and relocating it to rural areas where clear benefits can be identified, such as areas with high crash rates, winter weather issues, etc.

3.2.3.2 Hardware Platforms

Key hardware platforms for the dissemination of traveler information include:

  • Mobile devices have unquestionably become a key platform for the distribution of traveler information. Smartphones, cellphones, and smart devices are all enjoying rapid and widespread consumer adoption. The more advanced solutions, however, are not yet in use by all populations in all locations. Over 30 percent of American adults do not yet have smartphones (Pew Internet Project, n.d.).
  • In-vehicle infotainment platforms are growing in availability. Car manufacturers now offer these systems in a wide range of makes and models. There are, however, ongoing issues with usability, as the rush to provide complex functionality has outstripped ease of use considerations. It remains to be seen how quickly consumers will adopt these solutions as they update their vehicles. It is also not clear exactly how often consumers are actually using these platforms to access traveler information.
  • Smartphone integration solutions are also starting to emerge, as car manufacturers seek to manage the disparity between automotive and consumer electronics life cycles by enabling the use of the smartphone to host or connect apps for use in the vehicle. Mirrorlink, Google Android Auto and Apple Carplay solutions are now making their way into the market, although overall penetration and availability are still fairly low at this time (Connected World, 2015).
  • In-vehicle connected safety systems are not yet available, although at least one automaker has targeted 2017 as an initial commercial release date (GM, 2014). There is significant federal government interest in accelerating the rapid deployment of these solutions, but standards and business models are still under discussion and projected timing of a potential broad deployment is not yet clear. This is an area to watch, but is unlikely to have a significant impact within the five-year timeframe of this study.

3.2.3.3 Presentation Software

From the traveler's perspective, the software used to present the information is what matters, as it controls the user experience and hopefully ensures safe en route operation. This software can reside in various places – on the vehicle, on mobile devices – and operate either individually or as part of a social network.

Within the vehicle, an increasing range of traveler information applications are now packaged as part of in-vehicle infotainment systems, or available through smartphone integration. Private sector traffic providers have now taken their place on the dashboard, as evidenced by announcements such as the INRIX / Audi offering first shown at CES 2015 (INRIX, 2015).

On the mobile side, the majority of state DOTs now support mobile platforms (80 percent). In addition, many offer mobile applications with a primary focus on traffic and traveler information (55 percent). These apps may also provide safety messages (15 percent), project updates and notifications (23 percent), and general DOT information (34 percent). A significant percentage of these apps are developed by DOT staff (more than 1-in-4) (Brown, 2014).

These public sector offerings are joined by a broad array of private sector apps and mobile websites. A summary of some widely-used traveler information applications is provided in Table 4. As can be seen from this sample set, the private sector is actively investing in traveler information offerings which draw on the latest data and data collection approaches to provide a comprehensive set of capabilities.

Table 4. Traveler Information Apps (Brydia R. E., 2015)
empty cell Waze INRIX Google Maps Sigalert Trapster* Scout GPS VZ Navigator AT&T Navigator MapQuest
Real-time Traffic Information Yes Yes Yes Yes Yes Yes Yes Yes Yes
Pre-Trip Information Yes Yes Yes Yes Yes Yes Yes Yes Yes
En Route Information Yes Yes Yes Yes Yes Yes Yes Yes Yes
Crowd Sourcing Yes Yes Yes Yes Yes No No No No
Sensor/Probe Information Partial Yes Yes Partial Partial Yes Yes Yes Yes
Prediction Algorithm No Yes Yes No No No No No No
Personalized Information Partial Yes Yes Yes Yes Yes Yes Yes Yes
Number of Users High High High Low Med Med Low Low High
Review Rating 1 4+ 3 4 2.5 NA 3.0 3.0 2.5 3.0
Traffic Yes Yes Yes Yes Yes Yes Yes Yes Yes
Regional Traffic No Yes No Yes Yes No No No No
Alerts Push Push Push Email Push Push Push Push Push
Alerts Weather No Yes No Yes Yes No No No No
Alerts Police Yes No No Yes Yes Yes No No No
Alerts Gas Station Yes Yes No No Yes Yes No No Yes
Alerts Accidents Yes Yes Yes Yes Yes Yes Yes Yes Yes
Alerts Road Hazard Yes No No Yes Yes Yes No No No
Key: Yes – Yes; No – No; Partial – Partial

Social media has been the recipient of enormous hype. State agencies have quickly added this tool to their arsenal of traveler information delivery tools (see Figure 18), and anecdotal evidence shows that the interactive, measurable nature of this technology is yielding benefits (Brown, 2014). However, it is difficult to tell exactly how highly to place social media in the overall traveler information solution set, as there is little usage data showing how much of the overall user base interacts with traveler information in this way. Total costs are also an area for further research, as initial capital outlay is quite low but operational staffing demands must also be managed over time (AASHTO, 2014).

Graph of the social media adoption by State DOTs for the years 2010 through 2014.
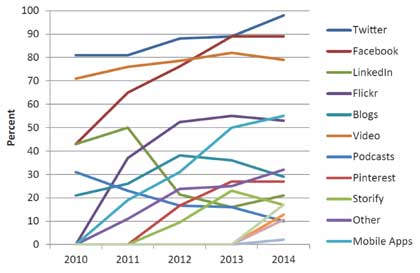
Figure 18. Graph. State DOT Social Media Adoption (AASHTO, 2014)

As new solutions become available, the overall traveler information delivery mix must be re-evaluated. What platforms are best for sharing specific types of data? Which new solutions should be deployed? Which older ones have run their course? This is a particularly critical question for older web- and IVR-based solutions. These have often been packaged under the overall brand of 511, although there is no consistent standard for what is included in a 511 offering, making it difficult to clearly assess them. For the purposes of this report, we note the following highlights:

  • Some populations are still relying on IVR systems. Tennessee DOT, for example, reports that they are tracking 2000 calls/day on average.
  • Overall, however, the 511 offering should be assessed, as there are some data indicating low awareness and use of such offerings. In an extensive 2012 survey, 511 ranks significantly lower than other sources for pre-trip and en route usage. A snapshot of this assessment is shown in Figure 19 (Robinson, Jacobs, Frankle, Serulle, & Pack, 2012).
  • Anecdotal evidence also suggests that state DOTs are expecting changes away from 511 solutions. For example, as of May 2015, Utah and Tennessee DOTs report that they expect an eventual phase out of 511 systems.
Graph of responses from a 2012 survey of pre-trip information usage used to make trip change decisions.
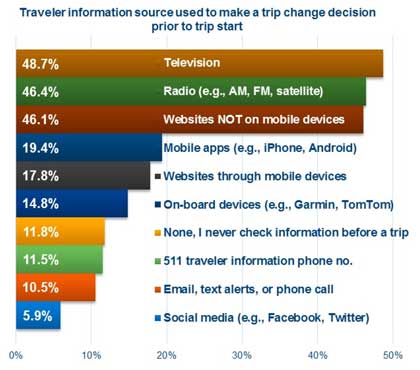
Figure 19. Graph. Pre-Trip Information Usage (Robinson, Jacobs, Frankle, Serulle, & Pack, 2012)

Given this general direction and the quickly growing use of alternatives, it appears that 511/IVR is a technology which is starting to shift into the later phases of its lifecycle. Like all technology transitions, the exact timing is uncertain and decisions about changes will need to be made on a case-by-case basis in response to the needs of key traveler populations. This makes it critical to closely both track performance and determine quantifiable milestones for making any needed changes (e.g., phasing out 511/IVR in favor of solutions which have become more effective). A tracking framework might include the items shown in Figure 20:

checkmark Identify the user segments using 511 phone solutions and understanding their relationship to the overall population
checkmark Determine whether they are using 511/IVR exclusively
checkmark Determine the actual impact of information from this source on traveler behavior (in addition to tracking usage statistics)
checkmark Determine whether known user segments are likely to effectively transition to other solutions if offered
checkmark Plot 511/IVR usage and impact trends against similar technologies (e.g., smartphone apps)
Figure 20. Chart. 511/IVR Tracking Framework (SCG)

This framework will help public agencies conduct a cost/benefit analysis of this technology and allow its projected lifecycle to be mapped.

3.2.4 International Trends

This section considers highlights of recent trends and activities related to NGTIS occurring around the world.

3.2.4.1 Global Case Studies

There are a variety of global activities which can serve as valuable sources of lessons learned for U.S. agencies. The following is a list of selected programs to consider, sorted by key traveler information topic:

  • Integration of public and private sector data and functionality. These temporary public/private partnerships in support of real-time operational events might be adapted to similar situations in the U.S.:
    • Japan Probe Coordination. In response to the 2011 tsunami, Japanese automakers partnered with the public sector to generate a nationwide database of probe data from all equipped vehicles in the consumer fleet. This was a temporary partnership to help with the emergency. There are efforts to build a more permanent solution, at least in the context of disaster response.
    • In Brazil, public agencies partnered with Waze and Moovit for transportation management during the World Cup (Olson, 2014). Rio de Janeiro uses Waze data as part of its traffic management program, and will likely rely on specific assistance from Waze during the upcoming Olympics (Ungerleider, 2015).
  • Public sector access to probe data. Private sector companies have established massive mobile probe data networks, but the public sector has had less access to this information to date. It is still early in this area, but an important one to track. The following examples of foreign agencies leveraging private information may have applicability in the U.S.:
    • Cooperative ITS Corridor. Holland, Germany, and Austria are partnering to establish a connected car corridor which will include some basic probe data capture based on messages sent out for safety reasons. The exact details of these systems are still in the works. (Ross, 2014).
    • Japan's ITS Spot system roadside infrastructure which is capable of capturing vehicle probe data from equipped vehicles has now been broadly deployed. Implementers are now working to increase the penetration rates for equipped consumer vehicles.
    • Volvo, the Swedish Transport Administration, and the Norwegian Public Roads Administration are partnering in an experiment to allow cellular-based probe data sharing via a cloud-based solution. Initial plans are to share road condition data both among drivers and with road authorities (Crowe, 2015).
    • Indonesian toll authorities are implementing probe-based traffic information collection based on Fujitsu's SPATIOWL platform. This system includes software which is put on smartphones to collect vehicle location, time and speed, and then develops information usable by TMCs (Benzinga, 2014).

3.2.4.2 European Commission Highlights

In December 2012, the European Commission funded a study regarding the provision of European Union-wide Real Time Traveler Information (RTTI) services. As this study is focused on very similar topics as this report, a summary is included here to demonstrate the global nature of the trends which are occurring in this space. Observations and findings for European Union traveler information services from this report that have implications for the U.S. market include (van de Ven & Wedlock, July 2014):

  • Technological advances have changed the traveler information service landscape by enabling new ways of collecting more road and traffic data through platforms such as smartphones and personal navigation devices. Big data analytics have been instrumental to cost-efficient data processing and enrichment of available data.
  • Similar to the progress of connected vehicles in the United States, technology that connects vehicles to the Internet (Connected Car), to each other, and to roadside equipment (Cooperative Technology) are expected to lead to a significant increase in available traveler information data at much lower costs.
  • As more driving tasks are automated, the need for human-comprehensible traffic information will decrease, while the demand for machine-readable road and traffic data will increase. Automated vehicles will in particular require RTTI to provide them with full forward awareness of potential traffic queues and hazardous traffic situations downstream, as opposed to only within the range of vehicles' sensors and cooperative range.
  • Roles in the traveler information value chain will likely change in the future. Private traffic data providers have the technology to process large volumes of new traffic data and develop profitable business models. Public authorities will, however, retain a key role in assuring societal interests in the value chain.
  • Until now, most safety-related traffic information (SRTI) have been collected by public authorities. It is expected that car manufacturers, their suppliers, and/or service providers will be a primary collector of SRTI in the near future, for example, through messages from cooperative vehicles or the CAN-bus.
  • It is recognized that data privacy and service liability will become key issues for increasing amounts of data originating from vehicles and communities.

1 This rating reflects user reviews of the applications, as gathered by app stores providing these apps.

< Previous | Next >
Office of Operations