Transportation Systems Management and Operations Benefit-Cost Analysis CompendiumCHAPTER 8. TRANSIT OPERATIONS
Case Study 8.1 – Transit Signal Priority, Portland Tri-Met
Note: Chapters 2, 3, and 4 of this Compendium contain a discussion of the fundamentals of benefit-cost analyses (BCA) and an introduction to BCA modeling tools. These sections also contain additional BCA references. Project Technology or StrategyThe Tri-County Metropolitan Transportation District of Oregon (Tri-Met) is one of many metropolitan transit agencies that have deployed both automatic vehicle location (AVL) and automatic passenger counter (APC) systems. These technologies are important components of the agency's automated bus dispatching system (BDS). The AVL and APC systems at Tri-Met recover comprehensive operations and passenger activity data at the bus stop level that is archived for later analysis. With its AVL and APC systems, Tri-Met is now automatically collecting and archiving over 500,000 stop and event data records per day. Offline analysis of this data supports a wide array of agency activities. The success of these technologies allowed the installation of Transit Signal Priority (TSP) on key bus routes. Project Goals and ObjectivesThe intended goal was that TriMet would recoup its investment through running time saved by streamlining—in other words, if four or five peak buses could be saved, the bus operating cost savings would offset the investment in transit preferential treatments paid for through TriMet's contributions to the overall program. The goals of the TSP implementation included:
All of the streamlined routes are also Frequent Service routes, operating at 15-minute or better headways throughout the day, each day of the week. Time saved through more efficient routings and through transit signal priority reduces passengers' overall trip times. Transit signal priority also helps maintain schedule reliability. Data RequirementsArchived AVL and APC data support a variety of regular reporting activities at Tri-Met. The data are also used to support analysis of specific needs and problems that relate to both short and long term planning, scheduling, and operations. Analysis of archived AVL data is also undertaken in response to specific issues that arise related to service design, delivery and use. Capital, Operations and Maintenance CostsThe cost of implementation for the TriMet TSP system was $5.8M. (Year 2000 $). Cost of maintenance is estimated by TriMet to be 0.2 full time equivalent (FTE) staff (650 buses) for 5 years. There was no additional cost for signal maintenance. The following is a summary of the streamlining impacts that can be quantified to date:
Improved Service Increases Ridership 12,000 additional weekday passengers × 250 weekdays per year = 3 million additional annual bus boardings per year Increased Ridership Increases Revenue Corresponding fare revenue increase = approximately $1.7 million. Benefit AnalysisKey investments on the City's part were the installation of transit signal priority at 275 intersections and installation of signal priority emitters on nearly the entire TriMet bus fleet. The evaluation of the Streamline program focused on four key MOEs: ridership changes, additional fare revenue, on-time performance, and round trip time savings. On average, the 12 streamlined routes operated 0.8 minutes faster per round trip in 2005 than in 2000, while 7 comparative non-streamlined Portland routes operated 1.3 minutes slower. The difference is 2.1 minutes per trip. The City of Portland/TriMet's Streamline program reported positive results. According to the Journal of Public Transportation (2006), long term saving are estimated at approximately $13.4 million for TriMet. The time saved by streamlining comes from two main sources: running time savings and recovery time savings. Transit signal priority, curb extensions, and queue jump lanes help a bus travel its route faster than it otherwise would have. Signal priority also helps reduce the variability in the time buses take to make a trip from one end of a route to the other, allowing schedulers to reduce the amount of recovery time provided between trips. Recovery time is an allowance for late trips, ensuring that a bus can depart on time for its next trip. On the 12 routes where Streamline is in use, round trip operations averaged 0.8 minutes faster in 2005 than in 2000. Comparing that to seven other routes, where round trip operations averaged 1.3 minutes slower in 2005 than in 2000, there is an overall estimated improvement of 2.1 minutes per route. The variability of route times was also reduced over the course of the day, leading to more predictability for passengers. Through the implementation of the Streamline program (along with other complimentary transit improvements such as exclusive bus lanes, queue jumps, and stop improvements), TriMet buses improved in efficiency and reduced their fuel usage. As noted previously, buses on Streamlined routes averaged 0.8 minutes faster on route overall (Kittleson & Associates, 2009). Even this small savings has significant implications for transit operations over the course of an operating day in terms of on-time performance, fuel usage, and emissions. Streamline eliminated the need to add eight buses to TriMet's fleet, which deferred the release of an additional 3,600 lbs. of carbon emissions daily, as well as eliminated the need for 165 additional gallons of fuel daily. According to Kittleson & Associates (2009), 92 percent of the 12,000 new transit trips (11,055 trips) generated through the implementation of the Streamline Program, would shift from driving a personal vehicle; a net reduction of 8,189 vehicles (based on a 1.35 persons per vehicle occupancy). From this reduction in daily vehicle trips in 2005, approximately 1,900 gallons of fuel were not consumed. Additionally 36,000 pounds of daily carbon emissions were avoided. Benefit Cost EvaluationTOPS-BC, BCA.net, IDAS and other benefit-cost analysis tools provide systematic organization of BCA input and output to support decision making. Most models also provide input defaults for most variables that would be used in the evaluation of a bus operations streamlining program. If a planner was looking at a bus operating improvement project similar to the Portland TriMet example, he could use the TOPS-BC defaults, or generate new data to make the example as realistic as possible by applying local data which can be applied in place of the defaults. The following steps can be taken in TOPS-BC to generate a BCA.
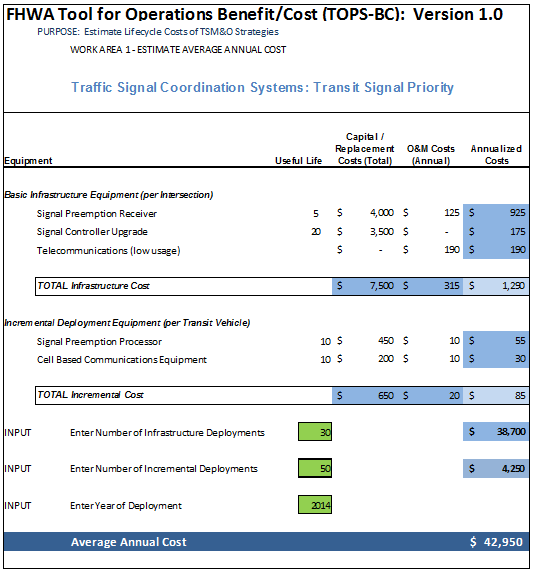
Now we will move on to the Benefit Page. TOPS-BC does not at this time have a unique benefit calculation algorithm. New material is constantly being added to TOPS-BC, so be sure to check if there has been an update in this area. If not, you can still use TOPS-BC and the cost information you have already input to provide a computational tool for calculating the annual benefits and comparing them to the annual costs. You can modify an existing benefit page to meet your needs or you can estimate the benefits outside the model and input them into a User Entered Benefit (Annual $'s) cell on any benefit page. See for example Figure 39. Recall that for the City of Portland/TriMet's streamlining program, on average, the 12 streamlined routes operated 0.8 minutes faster per round trip in 2005 than in 2000, while 7 comparative non-streamlined Portland routes operated 1.3 minutes slower. The difference is 2.1 minutes per trip. If this allowed for four fewer buses to be run per day, operating cost could be reduced be $140,000 per bus or $700,000. Of course there could be other benefits such a quicker and more reliable service saving commuters time and adding reliability. For this example, let us just start with the $700,000 in annual cost avoidance and enter that value into TOPS-BC. So, from the cost page we just completed:
 Source: FHWA TOPS-BC Figure 39. Screenshot. Tool for Operations Benefit-Cost Analysis Lifecycle Signal Priority Cost Page. 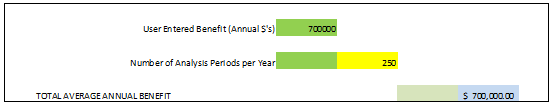 Source: FHWA TOPS-BC Figure 40. Screenshot. Partial View of the Tool for Operations Benefit-Cost Analysis Benefit Estimation Page. This also allows the user to test the impact of changes in selected input data. For example, the analysis can be carried out for examples that highlight local or recent information for your project using different technology costs, boardings, wait times, route times etc. Now we will see what TOPS-BC has done with the input cost and benefit data. 1. On the navigation column, or on the page tabs below the Excel sheet, click on My Deployments. If you were considering several project deployments, each can be displayed on this summary of the BCA. Figure 41 displays a portion of the Summary page containing the user estimated benefits and TOPS-BC estimated annual cost. Other portions of this page contain annual costs and benefits. 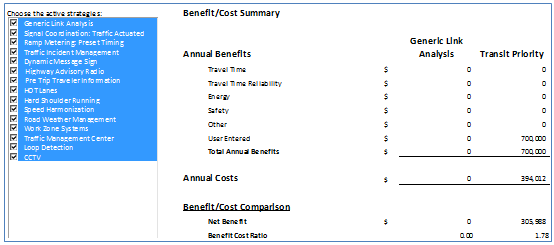 Source: FHWA TOPS-BC Figure 41. Screenshot. Partial View of the Tool for Operations Benefit-Cost Analysis Transit Priority Benefit-Cost Summary Page. Key ObservationsOperation of a bus rapid transit system in a major city is complex. Developing ways to improve system operations can be even more challenging. What Portland TriMet learned was that system improvement required an advanced data collection system that would provide researchers the information necessary to identify if new technology investments and system operations translated into improvements in key MOEs. With the assistance of BCA tools, changes in MOEs can be used to estimate the dollar benefits of these changes. These dollar benefits can then be compared to the added cost to the transit property for capital equipment, labor, maintenance and other costs.Case Study 8.2 – Transit Signal Priority, Los Angeles DOT/ MTA
Note: Chapters 2, 3, and 4 of this Compendium contain a discussion of the fundamentals of benefit-cost analyses (BCA) and an introduction to BCA modeling tools. These sections also contain additional BCA references. Project Technology or StrategyThe City of Los Angeles Department of Transportation (LADOT), in collaboration with the Los Angeles County Metropolitan Transportation Authority (MTA), has successfully implemented an advanced Traffic Signal Priority (TSP) system along several major transit corridors in the Los Angeles Region. Using loop detector technology and state of the art transit management software, the LADOT Traffic Signal Priority has received several awards for creativity and innovation from prominent transportation industry organizations nationwide. The LADOT TSP is currently active on four of the busiest transit corridors in Los Angeles: Ventura Boulevard, Wilshire/Whittier Boulevards, Vermont Avenue, and Broadway. The Ventura Boulevard Corridor, consisting of 89 signalized intersections and 16-miles of roadway, connects the Metro Red Line Station at Universal City to the Warner Center, a major commercial and business center in the West San Fernando Valley. The Wilshire/Whittier Boulevard Corridor, consisting of 123 signalized intersections and 14-miles of roadway, traverses through the central part of the Los Angeles Basin and connects East Los Angeles with the Central Business District, and the Cities of Beverly Hills and Santa Monica. Wilshire Boulevard is a prime business district with extensive commercial office buildings, museums and retail stores. Whittier Boulevard serves as a major East-West arterial in East Los Angeles and is fronted by a mixture of retail stores and residential area. These two streets are connected by the one-way street couplet of Fifth and Sixth Streets in the downtown Central Business District. The Vermont Avenue Corridor, consisting of 67 signalized intersections and 13 miles of roadway, connects the Metro Green Line Vermont Avenue Station to the Metro Red Line Sunset Boulevard Station. The Broadway Corridor, consisting of 79 signalized intersections and 11 miles of roadway, connects the Metro Green Line Harbor Freeway Station with the Downtown Central Business District and the Metro Gateway Plaza at Union Station. Automated Traffic Surveillance and Control and Transit Priority Manager System OperationEach signalized intersection in the project area is equipped with loop detectors that serve as Automatic Vehicle Identification (AVI) sensors. These sensors embedded in the pavement receive a radio-frequency code from a small transponder installed on the underside of a vehicle. Buses equipped with unique transponders are detected when traveling over the loop detectors. These loops are connected to a sensor unit within the traffic signal controller at each intersection, which transmits the bus identification number to the Transit Priority Manager (TPM) computer in the City's Automated Traffic Surveillance and Control (ATSAC) Center at City Hall East for tracking and schedule comparison. Once the bus identification and location are received by the TPM, the computer makes a determination of the need for traffic signal priority. If the bus is early or ahead of the scheduled headway, no traffic signal priority treatment is provided. However, if the bus is late or beyond the scheduled headway, then the downstream traffic signal controller will provide signal priority to help the buses catch up with the scheduled headway. In addition, real-time data links from the MTA dispatch center to the ATSAC center is used to obtain the daily bus assignment for schedule comparison. Types of Priority
Project Goals and Objectives:The TSP is a critical element of the Metro Rapid Bus (MRB) Demonstration Program that was jointly developed by LADOT and MTA. The initial phase of the Metro Rapid Bus was deployed on June 24, 2000, when the Metro Red Line subway was extended to the North Hollywood Stations in the San Fernando Valley. The purpose of the Metro Rapid Bus Demonstration Program is to offer rail-type frequent and high quality transit services connecting the terminus of the Red Line to major destinations in the outlining areas. The TSP serves to improve the on-time performance of the Metro Rapid Bus by adjusting the signal timing at intersections for buses as their approach is detected. The TSP is also used to provide real-time next bus arrival information to passengers waiting at bus stations and assist bus fleet management by recording the travel time for each bus run. Data RequirementsBefore and After Study of Bus Travel Times and Travel Speeds.A detailed evaluation of the Traffic Signal Priority System was undertaken three months after the beginning of the Metro Rapid Bus service. This allowed time for bus operators, passengers and general automotive traffic to become aware of the system. The first part of the evaluation ensures the effectiveness of the system in terms of overall travel time savings along the route and the reduction of time transit vehicles spent waiting at red traffic signals. The second part of the evaluation measures the impacts to general automotive traffic from the implementation of the Traffic Signal Priority System. Data for each evaluation was collected independently, and the results of these are presented below. Previous Bus Delay StudyIn the spring of 1998, LADOT staff conducted a manual data collection program along Wilshire and Ventura Boulevards to analyze the major causes of bus delay and operating inefficiency. The findings of that study indicated that the overall bus delays can be attributed to two major factors: buses stopped for red traffic signals, and buses delayed at bus stops loading and unloading passengers. Approximately 20 percent of the total bus running time was spent waiting at traffic signals, and another 25 percent of the total bus running time was due to bus loading delays at bus stops. These combined delays represent 45 percent of the total bus running time. Before and After Study MethodologyThe Traffic Signal Priority System records the time and date each transponder-equipped bus passes over a loop detector in the system. This provides a complete record of each bus trip made along the Rapid Bus route. From this detailed recorded data, it is possible to determine exactly the running times of the buses. For the period September 5, 2000 through September 14, 2000, a total of 13 Rapid Buses (seven assigned to the Wilshire/Whittier Boulevard route and six assigned to the Ventura Boulevard route) were not given priority at any of the traffic signals. All of the remaining 99 Rapid Buses operated with priority. Ventura Boulevard Travel Time AnalysisData collected along Ventura Boulevard was used to determine the amount of time saved between local buses and Rapid Buses both with and without priority. This information shows how much of the travel time savings is due to the Traffic Signal Priority System as compared to the Rapid Buses alone. The combined effects of the Rapid Bus service and the Traffic Signal Priority System have reduced the average running times along Ventura Boulevard by 23 percent, of which 33 percent is due to TSP, and 67 percent due to the Rapid Buses. The average travel speed for local buses was 15 miles-per-hour. Wilshire/Whittier Boulevard Travel Time AnalysisSimilar analysis based on the data collected along Wilshire/Whittier Boulevards determined the amount of time saved between local buses and Rapid buses both with and without priority, and how much of the travel time savings was due to the Traffic Signal Priority System, as compared to the Rapid Buses alone. The combined effects of the Rapid Bus service and the Traffic Signal Priority System have reduced the average running times along Wilshire/Whittier Boulevards by 28 percent, of which 27 percent is due to the signal priority system, and 73 percent due to the Rapid Buses. The average speed for local buses was 11 miles-per-hour. Summary of Findings about Travel Time SavingThe evaluation of the results show that the combined benefits of traffic signal priority and the limited stop Rapid Bus led to a net travel time saving of 28 percent on Wilshire/Whittier Boulevards and 23 percent on Ventura Boulevard. Based on further analysis, LADOT estimated the following results in the four TSP selected corridors:
Benefit Cost EvaluationThe LADOT used this information to conduct a preliminary benefit-cost analysis. Attribution of cost and the resulting benefits to specific technologies or strategies is a challenging exercise. Engineers can test the system by using a sample of buses operating without the TSP operating and compare travel times for buses with and without technology buses as was done in the Los Angeles study. Cost EstimationThe results of this evaluation analysis can be used to estimate the cost saving obtained from the Traffic Signal Priority System. The MTA indicates that the current system average cost of operating a bus is $98 per hour. With a traffic signal delay reduction of 4.5 minutes per hour, this translates into a cost saving of approximately $7.35 per hour per bus. For a bus operating along these routes for 15 hours per day, the cost saving would be approximately $110.25 per day. Some additional capital cost should be allocated to the TSP system. A centrally controlled or adaptive signal system was required along with the loop detectors and on board transponders. The latter may be directly attributable to the TSP and a portion of the traffic management system may also be attributed to the TSP to develop a full understanding of the system costs. The Traffic Signal Priority System cost almost $3 million to install along both Ventura Boulevard and Wilshire/Whittier Boulevards, including the cost of the software development. A total of 211 signalized intersections are outfitted with the Traffic Signal Priority System, at an average intersection cost of $15,000 per intersection. Benefit QuantificationAssuming 100 buses per day for an average of 300 days per calendar year in the two corridors, this translates into approximately $3.3 million annual operating cost saving for the MTA. This saving does not include the added benefit of travel time saving to the Rapid Bus passengers. TOPS-BC can be used to provide a sketch planning analysis of the benefits and costs of TSP when MOEs are available. Within TOPS-BC, TSP can be found on the navigation column under Estimated Costs and the Traffic Signal Coordination Systems group. TOPS-BC provides defaults data on the value of travel time savings which can be combined with travel time MOEs calculate dollar benefits that can be added to the system savings produced by the operating efficiencies. Using TOPS-BC the analyst can use available data from current operations to evaluate future signal priority systems. Currently TOPS-BC offers a cost estimation sheet for Transit Signal Priority, but no benefit page dedicated to TSP. The user can calculate benefits outside the model and enter the calculated benefit values, taking advantage of the TOPS-BC defaults and system architecture. Let us use TOPC-BC to evaluate the Ventura Boulevard and Wilshire/Whittier Boulevards TSP systems.
LAMTA reported that the full cost of the TSP on these two routs was $15,000 for each of 211 intersections or $3,165,000. Assume 20 percent of this was software related and we have $633,000 for software and $2,532,000 for hardware and installation or $12,000 per intersection. For this case we will assume these costs are equally divided between the Signal Preemption Received and the Signal Controller Upgrade. So enter the unit costs at $6,000 for each under the Basic Infrastructure Equipment (per Intersection) cell. We will use the TOPS-BC estimate for the signal infrastructure O&M. We will also use the TOPS-BC estimate for the on-board technology installation. For number of buses to be equipped with on-board systems, we will assume 30 miles of served roadway with one quarter mile headway between buses or 120 buses to be equipped. Figure 41 displays the cost page with our entries. TOPS-BC has calculated the average annual system cost based on an assumed discount rate of 7 percent and 20 year project life to get to the cost of $393,165 per year. This results in a net present value cost of $3,766,521 in 2014 in 2010 dollars, as shown in Figure 42. TOPS-BC uses 2010 as the default year for the definition of the dollars. However, the user can change this to any other year on the TOPS-BC Parameters Page. The user can also select alternatives to the Discount Rate, to the deployment year and to the base year dollars. Now that we have estimates of cost, we can move on to the benefit calculation. TOPS-BC does not have at this time a benefit calculation sheet for TSP. We can calculate benefits of TSP outside the model and enter the results. TOPS-BC will then utilize the costs and benefits calculated and provided to generate the BCA and a Summary page. LA MTC reports that the bus operation costs are $98 per hour. There are 120 buses estimated to save 4.5 minutes per hour for a saving of $110.25 per day per bus. Total savings are: Total Annual Savings = 120 buses at $110.25 per day for 300 days per year = $3,969,000 savings per year We take the following steps:
Figure 42 shows the BCA summary for this case study. 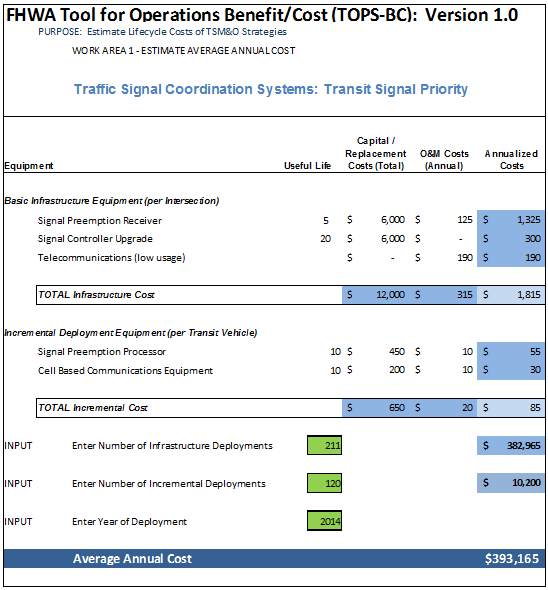 Source: FHWA TOPS-BC Figure 42. Screenshot. Tool for Operations Benefit-Cost Analysis of Transit Signal Priority Costs. Note: TOPS-BC carries out the annual cost series for the specified analysis period. 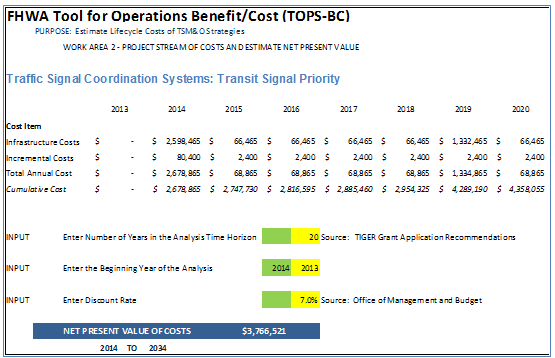 Source: FHWA TOPS-BC Figure 43. Screenshot. Tool for Operations Benefit-Cost Analysis Annual and Net Present Value of Cost. 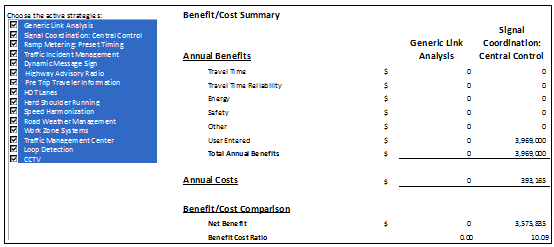
Source: FHWA TOPS-BC Figure 44. Screenshot. Tool for Operations Benefit-Cost Analysis Benefit-Cost Summary The analysis indicates that for each dollar in cost spent, the TSP investments will return over $10 in benefits. Recall also that we only estimated cost savings to the agency and adding consumer benefits would increase the Benefit-Cost Ratio (BCR). Key ObservationsMajor urban centers like Los Angeles are seeking every efficiency advantage in the operations of their Major Arterial networks. Transportation planners in LA realized that heavy congestion and signaled intersections were adding to the travel time on several major corridors. They selected four such major arterials, each about 15 miles in length and with 70 to 120 signalized intersections.. By installing Transit Signal Priority Service for buses on these corridors, planners were able to improve operating efficiency thus reducing the number of buses required and reduced travel time providing additional benefits to the bus riders. Planners tested the impact of the TSP system in two corridors by selecting a sample of about ten percent of the operating buses and running them without the TSP technology in place. By measuring transit times for busses with and without the technology they were able to estimate the effectiveness of the TSP technology in improving system operations. In this case we used the TOPS-BC cost sheets populated with information from the LA MTC case and estimated benefits on the realized agency cost savings. These data were use within TOPS-BC to estimate a BCR that was very similar to the value estimated by MTA staff. | |||||||||||||||||||||||||||||||||||||
|
United States Department of Transportation - Federal Highway Administration |
||