Transportation Systems Management and Operations Benefit-Cost Analysis CompendiumCHAPTER 9. TRAVELER INFORMATION
Case Study 9.1 – Oregon’s Automated Wind Warning System
Note: Chapters 2, 3, and 4 of this Compendium contain a discussion of the fundamentals of benefit-cost analyses (BCA) and an introduction to BCA modeling tools. These sections also contain additional BCA references. Project Technology or StrategyTo address localized high cross-wind challenges, the Oregon and California Departments of Transportation (ODOT and Caltrans, respectively) have used intelligent transportation system (ITS) installations to alert motorists of dangerously windy conditions automatically. Such a system is known as an Automated Wind Warning Systems (AWWS). ODOT designed its AWWS to send warning messages to drivers at locations where they can either stop and wait until conditions have improved or opt to take an alternate route. ODOT has deployed two such systems in the rural California/Oregon Advanced Transportation Systems (COATS) study area, at the following locations:
The two systems had similar components and are being observed by both departments of transportation to evaluate future AWWS deployments in their respective States. Wind gauges (anemometers) were connected to roadside static message signs and flashers were activated when average wind speeds reached predetermined threshold levels. The system automatically recorded the severity of the cross winds and notified traffic operators of the system’s status. Once wind conditions were verified by the Traffic Operations Center, additional warnings were posted on the Oregon DOT TripChek Web site. The warning messages were deactivated when wind speeds dropped below threshold levels. Project Goals and ObjectivesUS Route 101 is a very important corridor for the movement of freight and tourists, so it is critical to keep this highway open. Therefore, ODOT ITS Unit designed and deployed automated wind warning systems (AWWS) to reduce the number of road closures on US Route 101 and improve efficiency. As part of this process, ODOT performed BCA of these systems to evaluate their effectiveness in meeting their objectives. In order to provide comparable benefits and costs within the analysis, ODOT carefully selected key measures of effectiveness (MOEs) as the focus of this analysis. These measures included:
MethodologyThis analysis measured MOE 1 (Safety) through an analysis of crash data for the years 1997-2003, reviewed MOEs 2 through 5 (Efficiency, Customer Satisfaction, Reliability and Productivity) in the motorist survey results, and quantified MOE 6 (Operational Cost Savings) through the operational assessment. Table 45 summarizes the objectives and MOEs proposed for this evaluation.
Source: Oregon DOT
BenefitsThe direct benefits of the AWWS result from labor and equipment cost savings realized through avoiding road closures and the need to manually monitor conditions (on-site) during high-wind events at regular intervals. In both locations, annual savings are a function of the number of high-wind events observed at each site. As shown in Table 46, labor and equipment cost savings were calculated using average durations of road closures for two systems - South Coast and the Yaquina Bay Bridge systems. The study compiled data on the number of annual closure incidents, the average distances between the maintenance yards and the system locations, the average labor and vehicle costs per closure and for an average year. The labor rates were calculated from prevailing wage rates published by the Oregon Bureau of Labor and Industries.
The study also calculated the benefits of two types of delay savings realized from the AWWS. First, road closures are not automatically enacted when high winds occur, which means that delay will be reduced for motorists when the road can be kept open. Second, for those occasions when a road closure is required, the automated system allows for quicker removal of the closure when winds subside. In both cases, the estimated delay associated with road closures is based on traffic characteristics associated with each location. Traffic volumes were used to estimate delay savings. Traffic volumes were estimated based on average duration wind events (6 hours for South Coast, 3 1/2 hours for Yaquina Bay). Two volume scenarios are presented: an average volume scenario which assumes the closure may happen at any time of the day, and a high volume scenario, which includes the 30th highest hour volume as the volume during one hour of the closure. It is possible that a certain percentage of motorists choose to take an alternate route during high-wind events. An estimation of the percentage of drivers that may choose to take an alternate route was performed based on the responses to the motorist survey conducted for the two systems. As shown in Table 47, these traffic volume scenarios were then combined with value of time factors from the FHWA HERS model to calculate the average delay costs per road closure for passenger vehicles and heavy trucks.
Source: Oregon DOT
CostsThe implementation costs were estimated to be approximately $90,000 for the combined systems. The annual maintenance costs of the South Coast and Yaquina Bay Bridge systems are expected to be $3,000 and $3,500 per year, respectively. These costs were estimated as the systems were designed, built and installed by ODOT, and numerous State resources were used in the process that was not readily traceable. Maintenance cost estimates are based on another COATS Showcase study on maintenance costs of field elements in rural areas. Benefit-Cost RatioThe benefit-cost ratios were estimated based on the following assumptions:
Model Run ResultsAccounting for motorist delay reduction as well as other benefits such as improved safety for motorists (and maintenance personnel) during high wind events, the benefit-to-cost ratios for the South Coast system and Yaquina Bay Bridge system were 4.13:1 and 22.80:1, respectively. The Yaquina Bay Bridge system had a higher benefit-to-cost ratio reflecting the higher frequency of cross winds in the area and heavier traffic volumes compared to the South Coast system. The analyses assumed the system would reduce delay by approximately 20 percent as a result of prompt deactivation of wind warnings. The benefit-cost ratio calculations, and the number of years until the benefits exceed the costs (break even analysis), are shown in Table 48.
1 "Average" scenario includes average number of wind events and average traffic volumes.
2 "High" Scenario includes high number of wind events and high traffic volumes. 3 Benefit-cost ratio is calculated based on “average” benefits. Source: Oregon DOT The estimated benefit-cost ratios indicate that the direct benefits from the two AWWS systems in Oregon would exceed their installation, operational and maintenance costs between seven years for the Yaquina Bay Bridge system and twelve years for the South Coast system after installation, depending on the frequency of road closures related to high wind events and the traffic volume through these locations. If delay reductions to the motorists are considered, the benefits of the system pay for the system installation and maintenance costs within three years for the South Coast system and one year for the Yaquina Bay Bridge system. These benefit-cost ratio estimates did not include any indirect benefits such as improved safety for maintenance personnel and improved safety for the motorists during high wind events. A positive benefit-cost ratio was achieved counting only the motorist delay reduction benefits. The continued deployment of these systems will provide more information about the safety benefits to workers and drivers in the future. As this study was completed with only 1-2 deployment history, statistically reliable crash reduction estimates could not be developed at this time. The results of the BCA showed rural AWWS deployments to be an extremely efficient investment. The potential benefits included reduced travel time delay, crash reduction during adverse weather, and operating cost savings through more efficient use of winter maintenance resources. The results, made more relevant by the fact that they were generated through a valid and systematic process, were extremely valuable in making the case for investment in improved AWWS in the regions. Key ObservationsThis case evaluated AWWS in Oregon rural highway corridors. From the BCA results, AWWS deployments offered significant cost savings to drivers as well as ODOT. These systems also allow more prompt high wind notifications to the drivers thus reducing exposure of the driving public to high cross winds along US Route 101. Overall, this case showed that weather management costs decreased with increased use of weather information and with improved accuracy. Therefore, agencies should consider expanding the use of current resources and investing in improving the accuracy of their weather information to realize cost savings. The use of low and high traffic volumes can be used for a break-even analysis. It is also important to consider both direct and indirect benefits of your deployments. Care must be taken not to double count benefits as many indirect benefits may already be embodied in the direct benefits. This is the difference between BCA and Impact analysis. In impact analysis, all economic changes, positive or negative, direct or indirect, are accounted for. Case Study 9.2 – Hypothetical Truck Tip-Over Warning System
Note: Chapters 2, 3, and 4 of this Compendium contain a discussion of the fundamentals of benefit-cost analyses (BCA) and an introduction to BCA modeling tools. These sections also contain additional BCA references. Project Technology or StrategyCurve speed warning systems use roadside detectors and electronic warning signs to warn drivers, typically those in commercial trucks and other heavy vehicles, of potentially dangerous speeds in approach to curves on highways. Project Goals and ObjectivesIn Colorado, the State DOT deployed a Truck Tip-Over Warning System I-70 eastbound just outside Idaho Springs to help prevent rollover crashes on sharp curves. The system consisted of two piezo weigh-in-motion (WIM) devices, traffic detectors, four fiber optic message signs, computer processing equipment and associated software, and a controller cabinet. When the system detects vehicles exceeding the maximum safe speed for their weight category, the warning system activates and the roadside message signs display messages on otherwise blanked-out screens. Data RequirementsThe system helps prevent rollover accidents on sharp curves. The system consists of two weigh in motion sensors and loop detectors to detect vehicle speed, vehicle axles, and vehicle weight. System electronics process information from the sensors in real time, just milliseconds after the vehicle has passed over the sensor configuration. A maximum safe speed is determined specifically for the curve and vehicle weight category. System electronics then match this information with the vehicle speed record. If the actual speed of the vehicle exceeds the calculated maximum safe speed, a roadside blank out sign illuminates a warning message.The low bid for the project was $446,687 in 2002. Table 49 presents the equipment list of the major components identified in the bid tabulation. The project description did not provide maintenance costs or service lives for the system components.
Source: "In Oregon and Colorado, Downhill Speed Warning Systems Decreased Truck Crashes up to 13 Percent at Problem Sites," Intelligent Transportation Systems Joint Programs Office, U.S. DOT. Available at: http://www.itsbenefits.its.gov/ITS/benecost.nsf/ID/3E417EC229AF6288852573DA00578A60?OpenDocument&Query=Home
A conference presentation at the 12th Annual ITS Forum, Wisconsin Chapter of ITS America in October 2006 provided an overview of several ITS technologies that improve safety for commercial vehicles operating in rural areas. This overview noted, “Several years of safety data collected at multiple sites show that road geometry warning systems can eliminate rollover crashes and the impacts are sustainable. Downhill speed warning systems have proven effective at mitigating risk to large trucks in areas with steep terrain. At problem sites in Oregon and Colorado, these systems have decreased truck crashes by up to 13 percent.” Benefit Cost EvaluationPlanners and traffic engineers can use data on the costs and benefits of projects such as speed warning systems to evaluate whether such systems provide a positive return on public investment. In this case, the data presented in the previous section provide many of the data required to perform such a benefit-cost analysis. This case study illustrates how a TOPS-BC user can add a cost worksheet for a Truck Tip-over project and add the cost data that Table 49 provides. Model Run ResultsTOPS-BC maintains a blank cost estimation worksheet that can be used to create cost estimation capabilities for new strategies that may not currently be included. A hidden sheet titled COST TEMPLATE, shown as Figure 44, provides a blank cost estimation worksheet. This worksheet has all the analysis capabilities present in all other strategy worksheets, but lacks any default equipment or cost data. 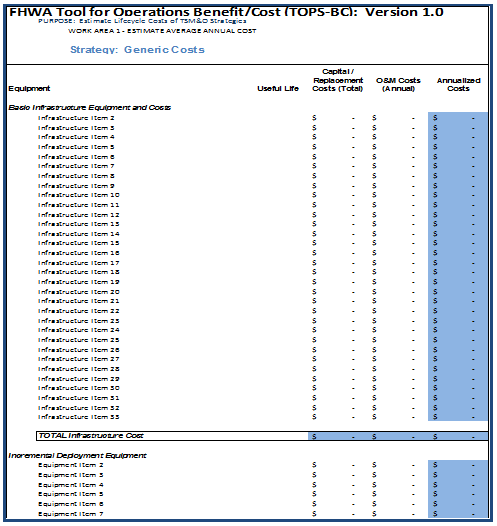 Source: FHWA TOPS-BC Source: FHWA TOPS-BCFigure 45. Screenshot. Partial View of the Tool for Operations Benefit-Cost Analysis Blank Cost Template Worksheet. Unhiding the Cost Template in TOPS-BC To unhide the COST TEMPLATE sheet, put your mouse over the worksheet tabs, left click, select “unhide” in the popup menu, select the worksheet COST TEMPLATE, and click “OK” Rename and populate the new worksheet with customized defined equipment and cost data to create new strategies. To rename the COST TEMPLATE sheet, put your mouse over the COST TEMPLATE worksheet tab, right click, select “rename” and then type in the new name. In addition, type in the new Strategy name in cell K6. TOPS-BC assumes that user enters the new data in the same format (e.g., equipment name, capital cost, useful life, annual O&M costs).Figure 45 shows a Partial Screen View of a new TRUCK TIP-OVER cost worksheet. The user has added costs from Table 49.
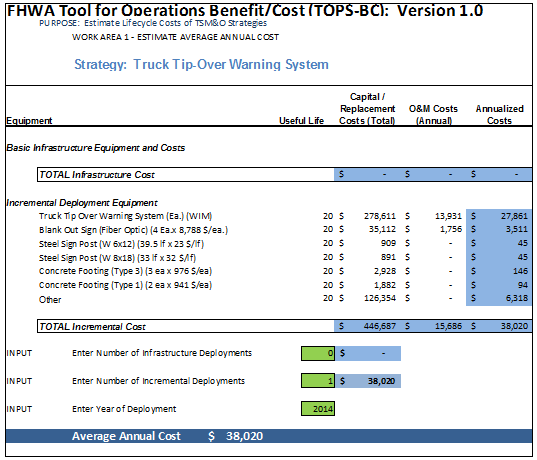 Source: FHWA TOPS-BC Figure 46. Screenshot. Partial View of a Tool for Operations Benefit-Cost Analysis New Truck Tip-Over Cost Worksheet. The TOPS-BC user will also need to modify the navigation capabilities manually and link the new worksheet to the SUMMARY sheet or other worksheets where they intend to use the output cost data. TOPS-BC maintains a common Navigation Menu that it uses on nearly all sheets in the workbook. This Navigation Menu automatically regenerates on each page when the user opens the sheet. Therefore, the user cannot directly edit it on the individual sheets, as TOPS-BC would overwrite any changes the next time the user opens the sheet. 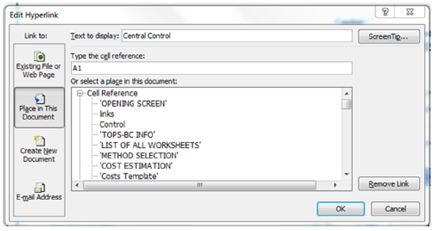 Source: FHWA TOPS-BC Figure 47. Screenshot. Creating a New Hyperlink in the Master Navigation Menu. The TOPS-BC user will also need to link the new worksheet to the COSTS SUMMARY and MY DEPLOYMENTS sheets if they intend to use the output cost data together with other benefits or costs. This case study does not cover these techniques, as they require advanced Excel skills. Modifying the Navigation Menu in TOPS-BC TOPS-BC maintains The Master Navigation Menu on a hidden worksheet named “links.” To modify the navigation menu:
Key ObservationsThis case study identifies the evaluation of a truck tip-over warning system on a freeway. Curve speed warning or truck tip-over warning systems use roadside detectors and electronic warning signs to warn drivers, typically those in commercial trucks and other heavy vehicles, of potentially dangerous speeds in approach to curves on highways. This case highlights data collected on the cost of such a system and presents some general data on the subsequent reduction in crashes that similar systems have experienced. A TOPS-BC user can employ these types of data points to conduct a benefit-cost analysis. This case study also illustrates how a TOPS-BC user can add a cost worksheet for a truck tip-over project, add cost data specific to the project, and add the new cost worksheet to the Master Navigation Menu. This allows the user to employ their Microsoft Excel skills to create a structured custom benefit-cost analysis. Case Study 9.3 – Freight: Truck Over-Height Warning System
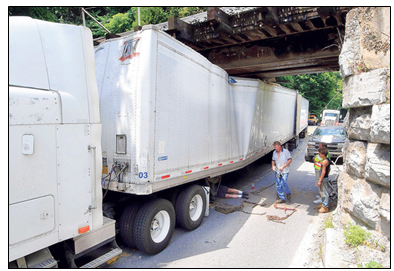
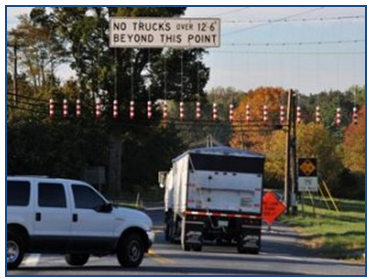
Note: Chapters 2, 3, and 4 of this Compendium contain a discussion of the fundamentals of benefit-cost analyses (BCA) and an introduction to BCA modeling tools. These sections also contain additional BCA references. Project Technology or StrategyOver-height/0ver-width warning systems use roadside detectors and electronic warning signs to warn drivers of vehicles that are too tall or wide to pass under bridges or through tunnels. Project Goals and ObjectivesWhen a new Costco distribution center opened in January 2010 near the MD 75/Baldwin Road intersection, it led to increased truck traffic on nearby roadways. When drivers of high profile vehicles continue along southbound MD 75 south of Baldwin Road, they encounter a low clearance bridge at the CSX railroad crossing. This has resulted in truck bridge collisions. In order to avoid a collision, drivers must place their vehicles in reverse and proceed backwards on MD 75, as there are no areas to turn around large vehicles. This has in disabled trucks in the roadway and significant backups and delays for other traffic. Figure 48 provides a picture of a truck that collided with the MD 75 Bridge. In October 2010, the Maryland State Highway Administration (MDSHA) installed the first phase of a $146,000 over-height warning system on both sides of the bridge. Reflective tubes strung between two 30-foot steel poles strike any vehicle too high to pass under the bridge, acting as an audible alert. In February, the SHA installed Phase 2, the addition of steel poles with infrared height detectors on the eastbound and westbound approaches to the MD 75 and Baldwin Road intersection.
Data RequirementsThe MDSHA reports that the number of tractor-trailer incidents has decreased by 75 percent (from an average of nine per month to three each month) since the project was completed. A tractor-trailer has not struck the bridge since MDSHA completed the permanent system. The number of tractor-trailers that have become stuck due to the lack of a turnaround at the MD 75 Bridge in Monrovia has also declined since the installation of the truck warning system. BCA Steps
Benefit Cost EvaluationPlanners and traffic engineers can use data on the costs and benefits of projects such as over-height warning systems to evaluate whether such systems provide a positive return on public investment. In this case, the data presented in the previous section provide many of the data required to perform such a benefit-cost analysis. This case study discusses how a planner or traffic engineers can conduct a benefit-cost analysis for an over-height warning system The first step would be for the BC analyst to collect data on the costs of the project. This should include construction costs as well as operating and maintenance charges that will occur in each year for the lifetime of the project. The second step would be to calculate the benefits of the system. In this case, the benefits are of two types. The first type is reduced accidents, as trucks do not collide with the bridge. The analysis should calculate the number and costs of accidents before and after the installation of the warning system. The second is reductions in lost time and travel. If trucks collide with the bridge or cannot turnaround, this causes delays for both the trucks and for other vehicles. The analysis should calculate the lost time and extra travel time before and after the installation of the warning system. The delays can result in extra travel time for highway users. This additional cost can be estimated using estimates of vehicle operating costs and the value of time estimates for autos and trucks. The benefits are the reduction in accident and time/travel costs with the warning system in place. This analysis should forecast the values of these reductions over the lifetime of the system. The third step in the analysis would be to compare the ratio of net present value of benefits to net present value of costs. The analysis will require the selection of a discount rate. While TOPS-BC does not address this technology, users can develop their own spreadsheets and may be able to borrow some components of TOPS-BC to assist in the development. Key ObservationsThis case identifies the evaluation of an over-height warning system for trucks on an arterial. Over-height warning systems use roadside detectors and electronic warning signs to warn drivers of vehicles that are too tall to pass under bridges or through tunnels. This case highlights data collected on the cost of such a system and presents some general data on the subsequent reduction in crashes and delays that occurred in this deployment. A TOPS-BC user can employ these types of data points to conduct a benefit-cost analysis. | |||||||||||||||||||||||||||||||||||||||||||||||||||||||||||||||||||||||||||||||||||||||||||||||||||||||||||||||||||||||||||||||||||||||||||||||||||||||||||||||||||||||||||||||||||||||||||||||||||||||||||||||||||||||||||||||||||||||||||||||||||||||||||||||||||||||||||||||||||||||||||||||
|
United States Department of Transportation - Federal Highway Administration |
||