Active Traffic Management Feasibility and Screening GuideChapter 6. Estimate Benefits and CostsAs a result of the screening activities performed as described in the previous chapters, practitioners will have identified a series of strategies and associated roadway segments and links where ATM may be deployed so as to meet one or more regional goals and improve the mobility, reliability, and/or safety of the transportation system. The next and final step of the screening process is to estimate the benefits and costs of these initial recommendations, further refining and prioritizing them accordingly. A benefit/cost analysis is also an important consideration within the broader "Objectives- Driven, Performance-Based Approach for Metropolitan Planning for Operations" and CMP, as shown in Figure 2. Due to the current transportation improvement funding environment, transportation planners and operations personnel will likely need to compare more traditional infrastructure projects (e.g., widening, bottleneck removal) and TSM&O-oriented strategies, including ATM. Because both of these different types of projects are often competing for the same funds, a benefit/cost analysis provides a framework for prioritizing and ranking widely varying improvement types. 6.1 Consider Key ATM Cost FactorsAs noted in the FHWA Operations Benefit/Cost Analysis Tool (TOPS-BC) (23), estimating the life-cycle costs of TSM&O strategies (such as ATM) is often complex. Compared with more traditional infrastructure improvements, TSM&O improvements typically incur a greater proportion of their costs as continuing operations and maintenance costs, as opposed to upfront capital costs. Much of the equipment associated with TSM&O strategies also typically has a much shorter anticipated useful life than many traditional improvements, and must be replaced as it reaches obsolescence. Planners and operations practitioners must fully consider and account for all the costs of TSM&O strategies when evaluating and developing deployment and operations and maintenance plans. Failure to recognize and accurately forecast these costs may result in future funding or resource shortfalls, or worse, the inability to properly operate and maintain deployed TSM&O improvements.(23) TOPS-BC recommends the following structure for organizing cost data:
TOPS-BC further recommends that, due to the complexity of many TSM&O deployments, these cost figures may be further segmented to ensure their usefulness. Within each of the capital, operations and maintenance, and annualized cost estimates, costs should be further disaggregated to show the infrastructure and incremental costs. These are defined as follows:
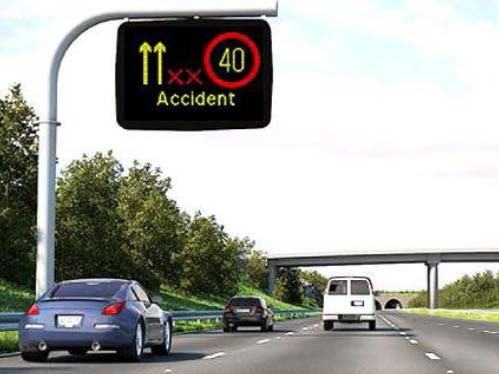
Structuring the cost data in this framework provides the ability to readily scale the cost estimates to the size of potential deployments. Infrastructure costs would be incurred for any new technology deployment such as ATM strategies. Incremental costs would be multiplied with the unit (e.g., number of intersections equipped, number of ramps equipped, miles of shoulder prepared for use as travel lane, and number of ATM gantry locations) and added to the infrastructure costs to determine the total estimated deployment cost. Presenting the costs in this scalable format provides the opportunity to easily estimate the costs of expanding or contracting the size of the deployment and allows the cost data to be reutilized for evaluating other corridors. 6.1.1 Capital CostsAlthough not as expensive as constructing a new lane, the funding requirements for ATM can be high. This is particularly the case for dynamic speed limits and dynamic lane control, which can require installing numerous large gantries with over-the-lane signs, and for dynamic shoulder lanes, which require overhead lane (i.e., shoulder) control signing as a minimum, and possibly construction to strengthen or otherwise prepare the shoulder to carry traffic, to minimize any clear zone issues (e.g., install and relocate guiderails) and to provide emergency refuge areas. . Example costs for systems incorporating dynamic speed limits and dynamic lane assignment, plus dynamic shoulder lanes in some cases, are provided in Table 13 along with the dates of the costs. Additional cost information for all the ATM strategies addressed herein may be found in ITS Joint Programs Office Knowledge Resources web site (including benefit and cost databases) at http://www.itsknowledgeresources.its.dot.gov/. (8) Note: This sample cost information should be used with some degree of caution. They vary quite a bit—and may not be applicable to one's own application—due to a number of factors, such as gantry spacing, gantry design, need for new supporting infrastructure (e.g., communications, detection), any enhancements to the shoulder lanes, and software costs). The costs per directional mile vary widely. Of course, each ATM deployment will be different in terms of signage, support structures, and the extent to which new supporting infrastructure (e.g., communications, detection, power) is needed. Also, the literature is not always clear about what these cost figures actually include. For example, the M42 costs(32) and the highest per mile costs identified in the Table 13 (in part due to the inclusion of DShL and close spacing of gantries) include "outturn costs, covering the total cost of all the design, development, delivery, construction, infrastructure and support costs from inception to maintenance handover." The Washington state I-5 costs do not include software, because this development was performed in-house by WSDOT staff. Other costs shown only address the sign structures, DMS, and communications. Another consideration is the ability to piggy back the ATM elements onto a roadway construction project, as was the case for Minnesota I-35W, which offered the opportunity to "capture significant cost savings."(43) As discussed in previous chapters, because of these high costs, roadway links and segments that experience significant recurring congestion (i.e., the traffic volumes exceed capacity during peak periods), and where the crash rates are much higher than the region or statewide average, are generally the best suitable candidates for ATM implementation, because benefits will be greater on these segments rather than roadways where congestion is held to a relatively small period during the peak period. In developing the preliminary capital costs as part of the screening process, remembering and including all the likely elements of the ATM system as summarized in Table 14 are important. 6.1.2 Gantries and Sign Supports for Dynamic Speed Limits, Dynamic Lane Assignments, and Dynamic Shoulder LanesEstimating capital costs will require some decisions, or at least informed assumptions, in several areas. One area in this regard involves gantries for freeway ATM strategies, particularly for DSpL, DLA, and DShL. The number and type of sign gantries can represent a major capital cost. Initial deployments of dynamic speed limits and dynamic lane assignment in the United Kingdom and in the United States used gantries spanning the entire roadway with DMS (for displaying speed limits and lane control) over each and every lane, with larger DMS to the side for queue warning messages and other information. Moreover, these gantries were spaced such that the driver was presented with a "continuum of information with 'intervisibility' of signs on successive gantries for the driver."(33) This resulted in gantry spacing of between 600 meters (0.37 miles) to 1,000 meters (0.62 miles). On the M42 in the United Kingdom, the gantry spacing is 500 and 800 meters (nominally .33 to 0.5 mile). The concern was that compliance would be less if gantries were spaced too far apart. The spacing of gantries for the Washington State and Minnesota systems followed suit and are located at roughly 0.5-mile intervals on average. Costs saving approaches are continuously being evaluated, including the tradeoffs of increasing the spacing between gantries, detectors, and emergency refuge areas. In England, the earlier ATM implementations are now considered conservative, and experience indicates that greater spacing may be appropriate. The current philosophy is that spacing needs to be sufficient so that drivers know they are still on a controlled roadway. The U.K. Highways Agency18analyzed a new application of the Managed Motorways toolkit, with the overall aim of delivering "schemes that will provide comparable benefits to those expected of current Managed Motorways schemes, but at a reduced cost and with shorter timescales for implementation."(45) Their findings suggested that there was a relationship between the spacing of information update points and the speed of individual drivers; mean speed and spot speed under gantries were higher when gantries were spaced further apart, and participants exhibited a greater degree of "surfing" behavior as gantry spacing increased. Through the use of visualization and response monitoring software, a driving-simulator trial, and questionnaires, equivalent options for verge (i.e., side-) and gantry-mounted information provision, in general, were determined to be comprehended equally well. Within the driving- simulator trial, participant driving behavior was comparable in response to either signin option. Moreover, the findings also indicated that presenting several information elements on a single side-mounted sign had a minimal impact on driver comprehension. The overall results suggested that side-mounted signing is equal to gantry-mounted signing at instructing drivers to move out of a particular lane. An example of the verge-mounted sign display, as seen from a "driver's eye" perspective, is shown in Figure 26. FIGURE 26. PHOTOGRAPH. CONCEPTUAL VERGE (SIDE)-MOUNTED SIGN FOR ACTIVE TRAFFIC MANAGEMENT (ATM) AS STUDIED IN THE UNITED KINGDOM (46) (Source: UK Highways Agency) Reference 46 from the United Kingdom lays out the Highways Agency latest design concepts for DSpL, DLA, and QW. The general layout is shown in Figure 27. The design concept consists of the following:
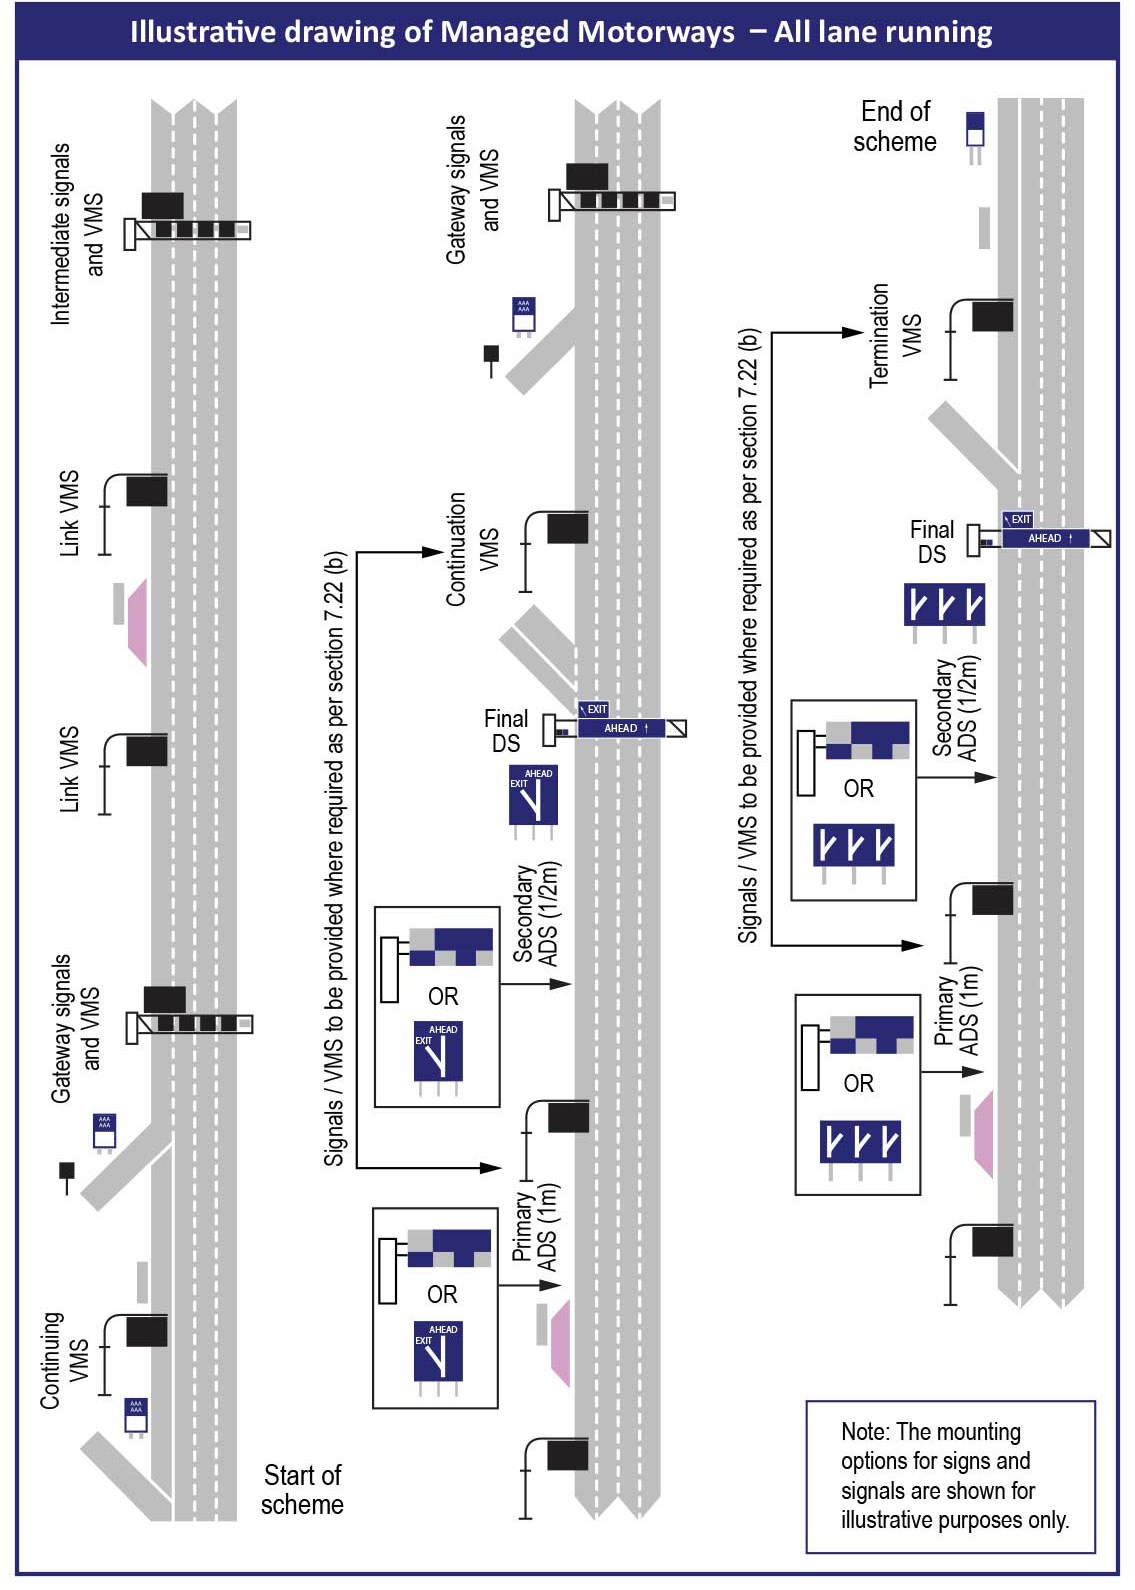
How such a signing approach might work in the United States depends on several factors, including the number of lanes in the directional cross-section (the U.K. study was based on a four-lane cross-section in a single direction), driver perception of such a diagrammatic concept (and the need for outreach and education), and conformance to the MUTCD. A similar hybrid arrangement has also been proposed for PennDOT District 6 (in the Philadelphia area). One of the ATM design concepts involved coordinating gantry locations with fixed signage and eliminating conflicting or redundant static signage where possible. FIGURE 27. DIAGRAM. CURRENT MANAGED MOTORWAYS CONCEPT (Adapted for UK Highways Agency -46) One concern was to not overwhelm the driver with various visual stimuli. In particular, this meant placing the ATM gantries no closer than 600 feet, and preferably 800 feet in accordance with the MUTCD, from an existing or planned fixed-guide sign assembly. Based on plan and field reviews, this criterion was determined to preclude installing ATM gantries every 0.5 mile in accordance with the Pennsylvania code (that permits variable speed limits, but requires that they be placed at a maximum spacing of every 0.5-mile). Accordingly, a hybrid layout was developed with the following nominal spacing:
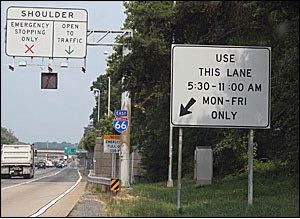
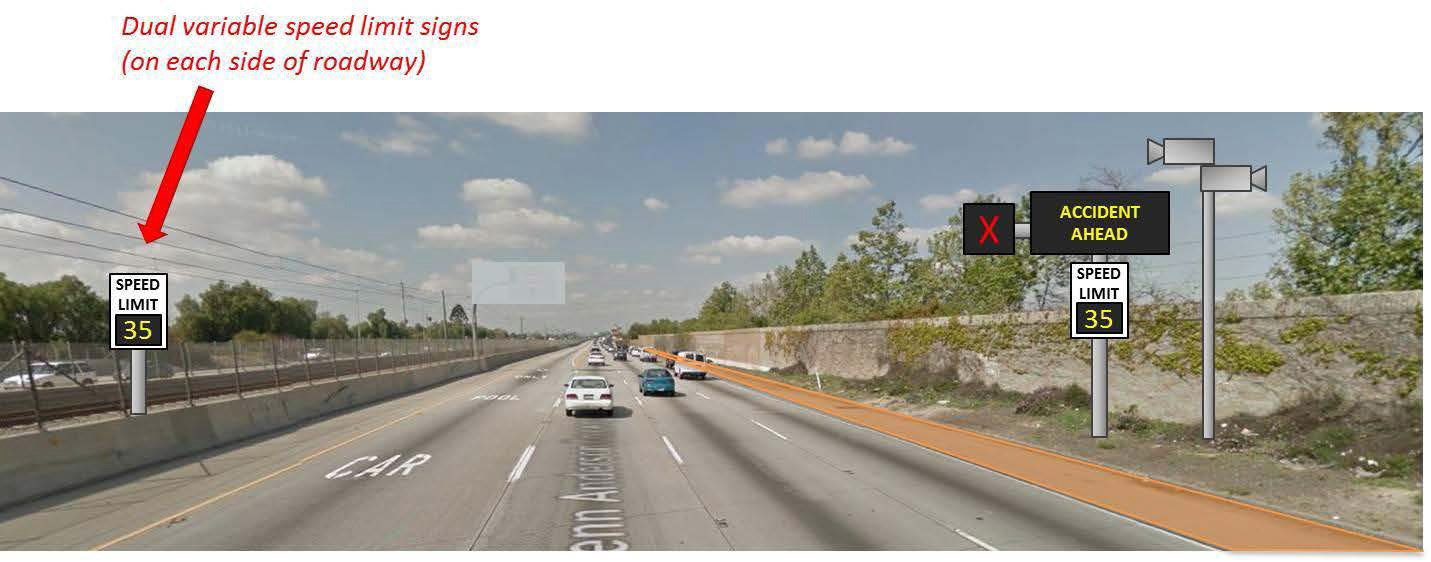
Signage decisions for DShL should also be assumed as part of the cost analysis. As a minimum, lane control signs should be installed over the shoulder to indicate when the shoulder lane is open or closed (as shown in Figure 28) to permit dynamic operations of DShL. FIGURE 28. PHOTOGRAPH. DYNAMIC SHOULDER LANE (DShL) SIGNAGE IN NORTHERN VIRGINIA (Source: Virginia DOT) As previously noted, the general approach in Europe is to deploy DSpL and DLA signage across all lanes (including the shoulder) as part of the DShL strategy. In this manner, roadway operations can be fully optimized to provide measurable benefits to the motoring public. Examples in this regard include the ability to reduce speed limits and/or advisories across all lanes as may be appropriate when shoulder lanes are in operation and the ability to close any running lane to facilitate emergency vehicle access should a crash occur. Another possible approach is to use lane control signage only over the shoulder and supplement this with queue warning DMS and side-mounted dynamic speed limit signs as shown in Figure 29. FIGURE 29. PHOTOGRAPH. CONCEPTUAL DYNAMIC SHOULDER LANE (DShL), DYNAMIC SPEED LIMIT (DSpL), AND QUEUE WARNING (QW) SIGNAGE FOR LOS ANGELES AREA (27) (Source: Caltrans) 6.1.3 Operations and Maintenance CostsLike any other investment that involves the application of advanced technology, ATM should only be implemented if agency budgets can support effective and continual operations. In other words, if agency budgets cannot support continued, effective, and safe operation, then ATM strategies should likely be deemed not feasible until such time that funding is available. As discussed in Chapter 3, Section 3.3, having the appropriate institutional framework in place to support ongoing ATM operations and maintenance is viewed as a necessary condition for moving forward with the ATM screening process and any subsequent design and deployment. Operations costs include the following:
Maintenance costs represent another on-going cost. Implementing ATM strategies will result in significant additions to existing ITS inventories; and this will require a consistent and continuing program of preventive and reactive maintenance. This may require additional maintenance staff, spare parts, and ongoing training. In some cases, this cost may include additional hardware and software to track maintenance activities such as those associated with a maintenance decision support system. Roadway maintenance procedures (e.g., pothole repair, sweeping, snow removal) may also need to be expanded or changed to for shoulder lanes. While implementing ATM can be expected to improve the operational performance of the traffic network, it is important to bear in mind that, regardless of what strategies are selected, a considerable level of ongoing commitment and expertise will be required to realize the full potential of the system. This is not a "set and forget" process. If agency budgets cannot support the ongoing operations and maintenance needs of ATM, then ATM strategies should not be deployed. 6.2 Perform High-Level Estimates of Benefits and Costs Using Available ToolsQuantifying the life-cycle benefits and costs of the selected ATM strategies at an order of magnitude level of analysis, and by roadway and/or roadway segment, will help decision- makers compute a preliminary benefit-cost ratio for a project. Available tools and approaches are briefly discussed below. 6.2.1 Benefit QuantificationIn addition to making assumptions on several key cost factors (or including various cost alternatives in the analysis), identifying which ATM measures of effectiveness will be used, how these will be estimated, and how the resulting benefits will be monetized is important. As discussed in earlier chapters, estimated benefits may be expressed in terms of reduced travel times and/or delay, reduced delays, reduced number of crashes, and reduced emissions. Improved reliability is also an emerging measure of effectiveness that might be considered for ATM. Converting the estimated benefits into dollar values, using estimated values of time, fuel, crashes (including property damage, injury, and fatality), emissions, and reliability, among others, will then be necessary. The state DOT may have such conversion values, or national averages may be used, such as those found in TOPS-BC (23). Another critical aspect of monetizing benefits is to annualize them and then estimate the total dollar value of the benefits over the life-cycle of the system. This life-cycle period must be the same as the analysis period used for the estimating costs, as discussed below. 6.2.2 Analysis PeriodIt is essential that the analyses utilize a common period of time — the "analysis period" — to assess life-cycle costs and benefits, and to compare the resulting benefit-cost ratios for different alternatives and scenarios. The analysis period should be long enough to include the initial construction up to (and possibly beyond) the point where it becomes necessary to replace many of the system components (e.g., DMS, controllers). This period should also capture the comprehensive benefits that flow as a result of an improvement over the life cycle of the deployment (i.e., a practitioner would not want to compare the total costs for a strategy with a single-year estimate of benefits.) The purpose of this approach is to spread out both the benefits and costs over an appropriate timeframe to allow for a meaningful analysis. For ATM strategies, a 10, 15, or 20 year time horizon should be considered. A related issue in any kind of evaluation, including life-cycle benefit- cost analysis, is the difficulty of making value comparisons among projects that are not measured in equal units. Even when values are stated in monetary units such as dollars, the values still may not be comparable, for at least two reasons:
Analytically, adjusting for inflation and discounting are entirely separate concerns, and they should not be confused by attempting to calculate both at once. Instead, future costs and benefits of a project should be expressed in constant dollars and then discounted to the present at a discount rate that reflects only the opportunity value of time (known as a real discount rate). This is because public sector project benefits should be dependent only upon real gains (cost savings or expanded output), rather than purely price effects. Through the use of a real discount rate, the following transformations can be performed to facilitate comparison of the constant dollar costs of alternative transportation projects:
6.2.3 Sketch Planning
Conceptual capital costs can be roughly estimated using a variety of sources, including costs A planning-level estimate of the potential benefits of an ATM deployment can be derived using the documented benefits from other implemented ATM systems, in the United States and in Europe as may be appropriate. For example:
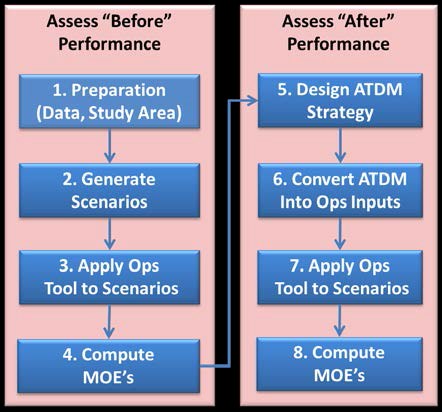
This sketch planning approach lends itself to the use of one or more spreadsheets. As a general rule, values smaller than the observed safety and operations benefits from other systems should be assumed, thereby providing a conservative benefit-cost ratio. This is particularly true if basing the safety benefits on European systems, where drivers' long-term experience with ATM systems and the existence of automated speed enforcement likely improves overall compliance as compared to the U.S. systems. 6.2.4 Highway Capacity ManualThe Highway Capacity Manual (53) recently adopted Chapter 35 dedicated to ATDM strategies.(47) The ATDM analysis methodology is designed to provide estimates of the effects of ATDM strategies on a facility in terms of throughput, travel time, speed, delay, and travel time reliability. The analysis considers a "before" case before the ATDM strategies are implemented and an "after" case with the ATDM strategies implemented. The approach provides a conceptual analysis framework, recommended measures of effectiveness, and an initial set of recommended methodologies for evaluating the impacts of ATDM strategies on highway and street system demand, capacity, and performance. As ATDM is currently farther advanced on freeways than on urban streets, the new chapter focuses on the analysis of freeway facilities.(47) FIGURE 30. FLOWCHART. ACTIVE TRANSPORTATION AND DEMAND MANAGEMENT (ATDM) ANALYSIS FOR THE HIGHWAY CAPACITY MANUAL (HCM) (47) The ATDM analysis framework (Figure 30) is designed to provide estimates of the effects of ATDM strategies on person throughput, mean facility or system travel time (and therefore delay), and facility or system travel time reliability for two conditions: (1) before implementation of ATDM strategy and (2) on opening day of implementation of the ATDM strategy. The ATDM analysis method is designed to address the following menu of ATDM strategies, several of which are the ATM strategies discussed in the guidance:
6.2.5 Tool for Operations Benefit/CostThe TOPS-BC (23) tool is a spreadsheet-based tool designed to assist practitioners in conducting benefit-cost analysis of operations strategies by providing four key capabilities, including the following:
A desk reference19 was developed in parallel with the tool. TSM&O strategies covered in the TOPS-BC tool are identified in Table 15.
Notes: Although TOPS-BC does not specifically model all ATM strategies, if users have an understanding of the various cost elements associated with a particular ATM strategy (or combination of strategies), coupled with information from other sources on the range of likely ATM impacts and costs, TOPS-BC can provide the framework for structuring project-specific ATM costs and benefits, TOPS-BC can also annualize these costs and benefits to compute a benefit/cost ratio. Moreover, TOPS-BC is being updated by FHWA to reflect lessons learned from the user experience to date. 6.2.6 SummaryUsing any of the methodologies noted above should allow the practitioner to refine and prioritize the ATM recommendations by roadway segment based on benefit-cost ratio, benefits from an initial deployment, available funding, or some combination. Including additional links to provide more continuity and consistency of service to the road user should also be considered. Another approach, particularly if the proposed ATM strategies are new to the region, may be to select a few ATM strategies and roadway segments that show the greatest benefit relative to costs, and then make this a demonstration/pilot project to test and evaluate ATM and to build trust. This approach serves three different purposes. First, it allows the technical systems and equipment to be tested to ensure that they are meeting their functional requirements. Second, it provides a basis for measuring the benefits and impacts of applying ATM. Finally, it provides a way to test ATM on a limited basis and, thereby, allay the concerns from DOT staff and operators, decision-makers, and the driving public. This, in turn, can help build a level of mutual trust that will enable further implementation of ATM across a region. With the information in hand from initial ATM screening activities, agencies should be able to define ATM projects, including roadway segments and ATM strategies and the associated estimated benefits and costs, to be incorporated into the metropolitan transportation planning process for subsequent funding. If funding has already been provided as a general DOT budget item, then the screening information will provide an excellent starting point for developing a Concept of Operations and the associated more detailed analysis efforts as part of the systems engineering and broader project development process. 18 On April 1, 2015, the Highway Agency was replaced by Highways England, a government-owned company responsible for England's motorways and major A roads. 19 https://ops.fhwa.dot.gov/publications/fhwahop12028/index.htm |
|
United States Department of Transportation - Federal Highway Administration |
||