Active Traffic Management Feasibility and Screening GuideChapter 5. Analyze and Prioritize Individual Roadway Links and Active Traffic Management StrategiesIn this step of the process, individual "links," interchanges, and ramps that make up the longer roadway segments selected in the previous step are analyzed in greater detail, prioritized, and the appropriate ATM strategies selected. The term "link" is used herein to define a one-way, continuous stretch of a roadway between two (often adjacent) interchanges or intersections, or on an individual milepost basis, with multiple links comprising one of the aforementioned segments. How a "link" is defined will depend on the geocoding of the available data, or it may be based on interchange to interchange, the TMC standards,10 or mileposts. 5.1 Analyze and Prioritize Individual Roadway LinksA quantitative approach for identifying and ranking roadway links as to their overall suitability for ATM strategies can take many forms, including the following:
5.1.1 Example of a Detailed Quantitative Analysis of Freeway Links forAs part of the PennDOT I-95 Corridor Program, a Transportation Operations Innovative Strategies Group was formed to look at the wide range of TSM&O strategies for deployment, including ATM, along the 51-mile I-95 corridor between the Delaware and New Jersey state lines. A quantitative assessment was performed to rank the targeted sites in terms of greatest need for ATM-type measures. This was accomplished by ranking the safety and congestion problems in terms of the severity of the problems that could be addressed by ATM. 5.1.1.1 Safety AnalysisFigure 11 is a plot of the total crashes per 0.5 mile for a segment of the I-95 corridor. The X axis shows the location as mile post, and the Y- axis total crashes over a 5-year period per 0.5 mile. These are then categorized into bands of low, medium, and high. A visual analysis of the graph shows three distinct areas: below 20, between 20 and 40, and above 40. This is a comparative analysis between different locations; thus, the need to set boundaries between the categories of low, medium, and high in relative terms. This process can be performed for total crashes, rear-end crashes, and side-swipe and angle crashes (depending on the categories given in the data; some data may not have all of the separate categories). Each 0.5-mile (or 1 mile or greater distance, depending on the granularity of the data) is then given a combined safety score in accordance with which band and/or level the segment fall into, for example:
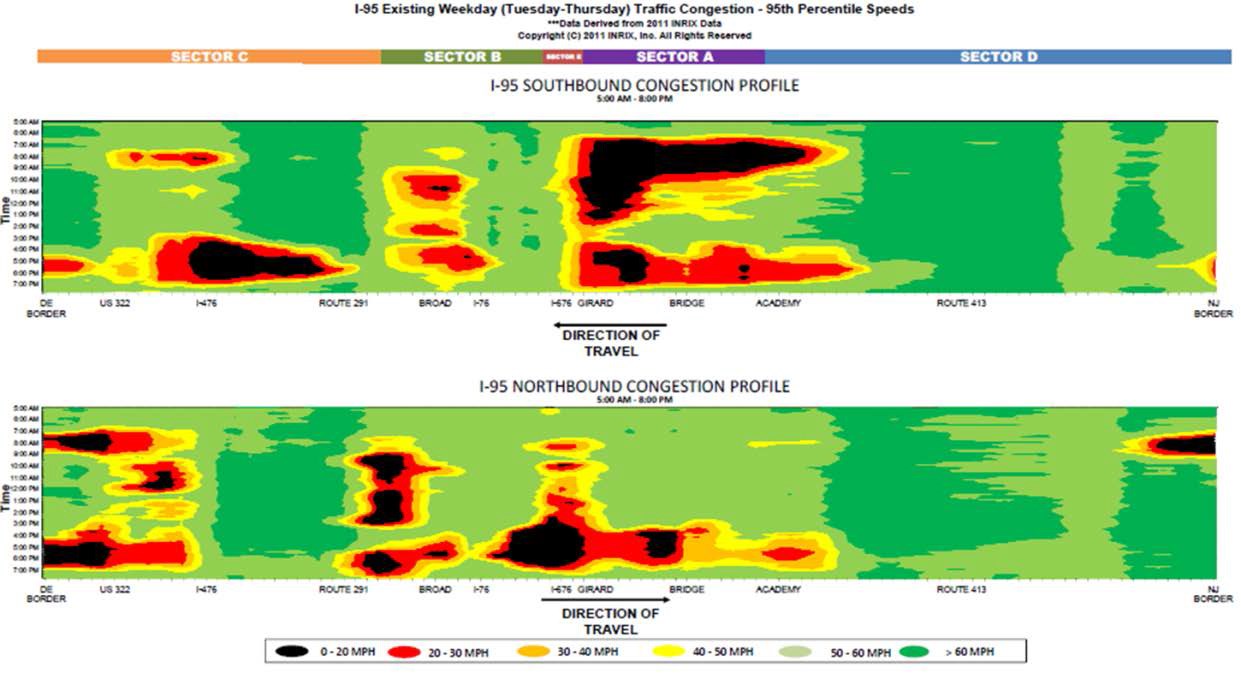
FIGURE 11. PLOT. INTERSTATE 95 (I-95) CRASHES BY MILE (29) 5.1.1.2 Congestion AnalysisSpeed and congestion data were processed to produce average speeds and the 95th percentile speeds for each location as shown in Figure 12. The speeds were then categorized into three levels of congestion as follows based on the lowest speed11:
The output of this step is an average congestion score for each location. A simple average congestion score for each location could take the following form:
FIGURE 12. PLOT. 95TH PERCENTILE SPEEDS ALONG INTERSTATE 95 (I-95) (29) For roadway links where special events are a frequent cause of congestion, the average and 95th percentile speeds can be used for these locations for event and nonevent days, and a more complex scoring paradigm used as follows:
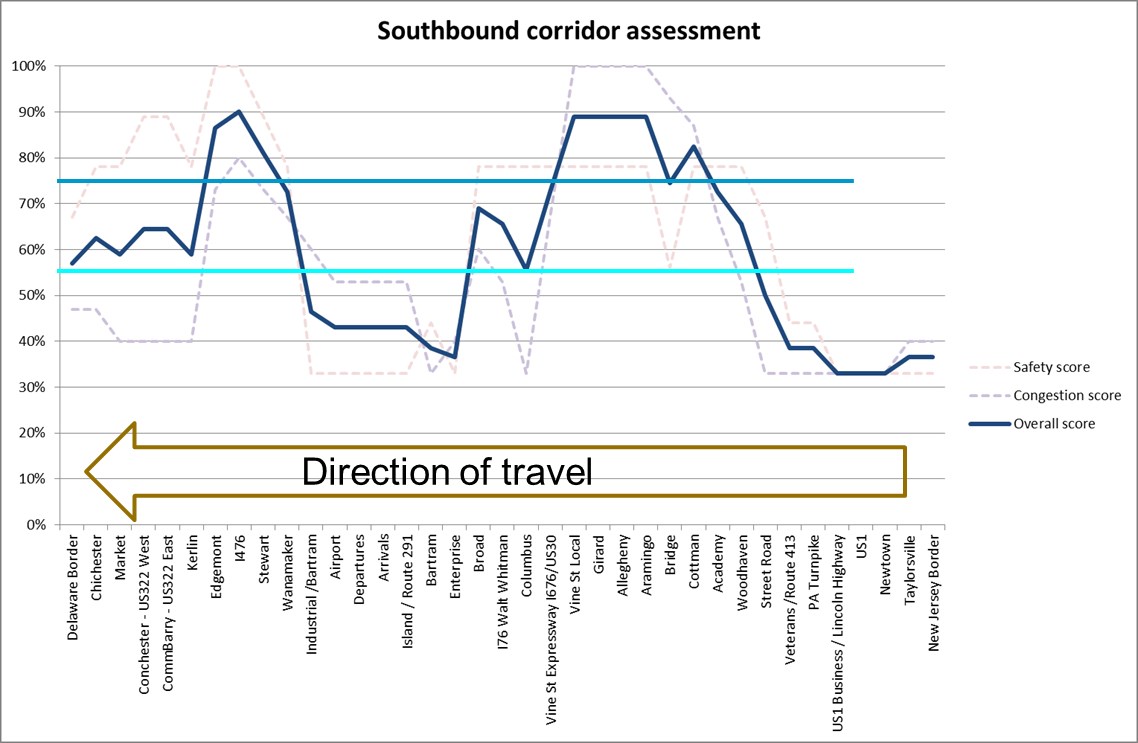
5.1.1.3 Combined ScoresThe safety and congestion scores for each link were then combined (i.e., averaged together) with equal weighting given to both categories, although one category could be given a greater weight based on agency priorities. The combined safety and congestion scores can be used to determine the highest priority areas and links using either tabular form or a line chart as shown in Figure 13. (Note: in Figure 13, two horizontal lines are drawn at the 75 percent and 55 percent scores to indicate two levels of priority). 5.1.1.4 Other ConsiderationsThe methodology and weightings can be modified slightly to account for other consideration that might impact the need for ATM—for example, adding another 10 percent (or other number as desired by the agency) to the combined score if the link meets other criteria, such as the following:
FIGURE 13. GRAPH. INTERSTATE 95 (I-95) LINE CHART OF SAFETY, CONGESTION, AND OVERALL SCORE (29)
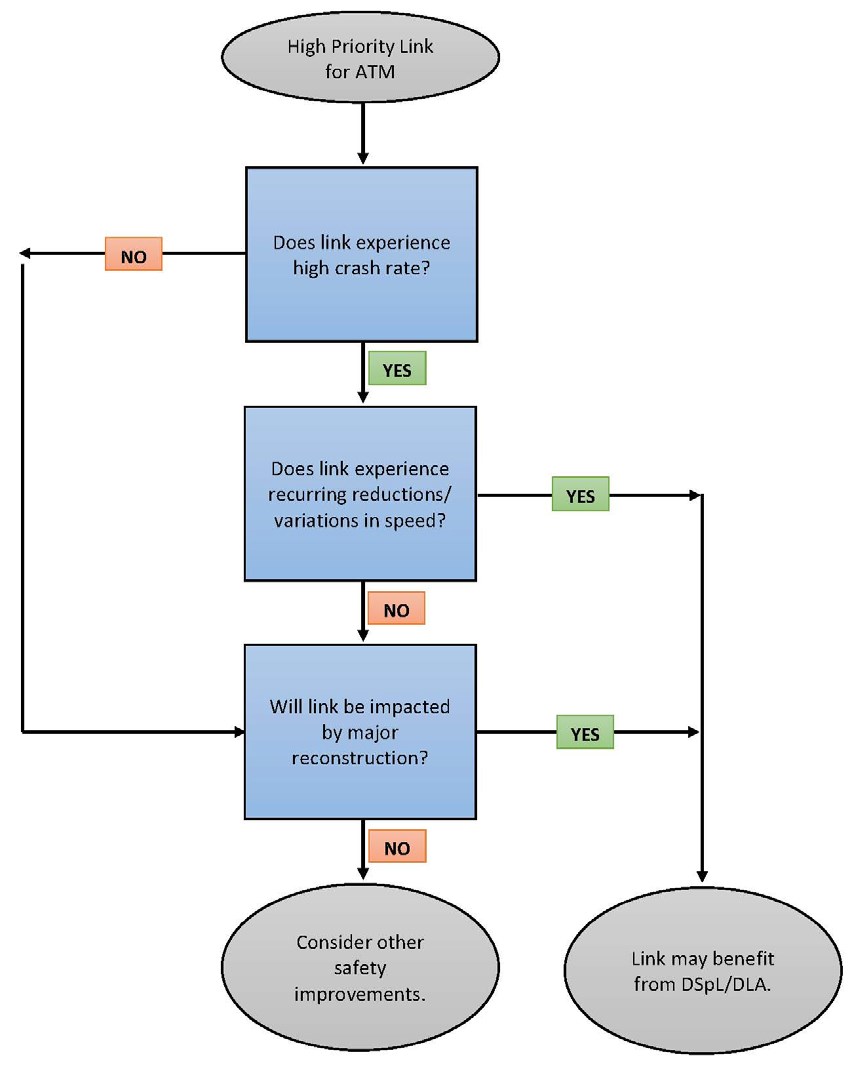
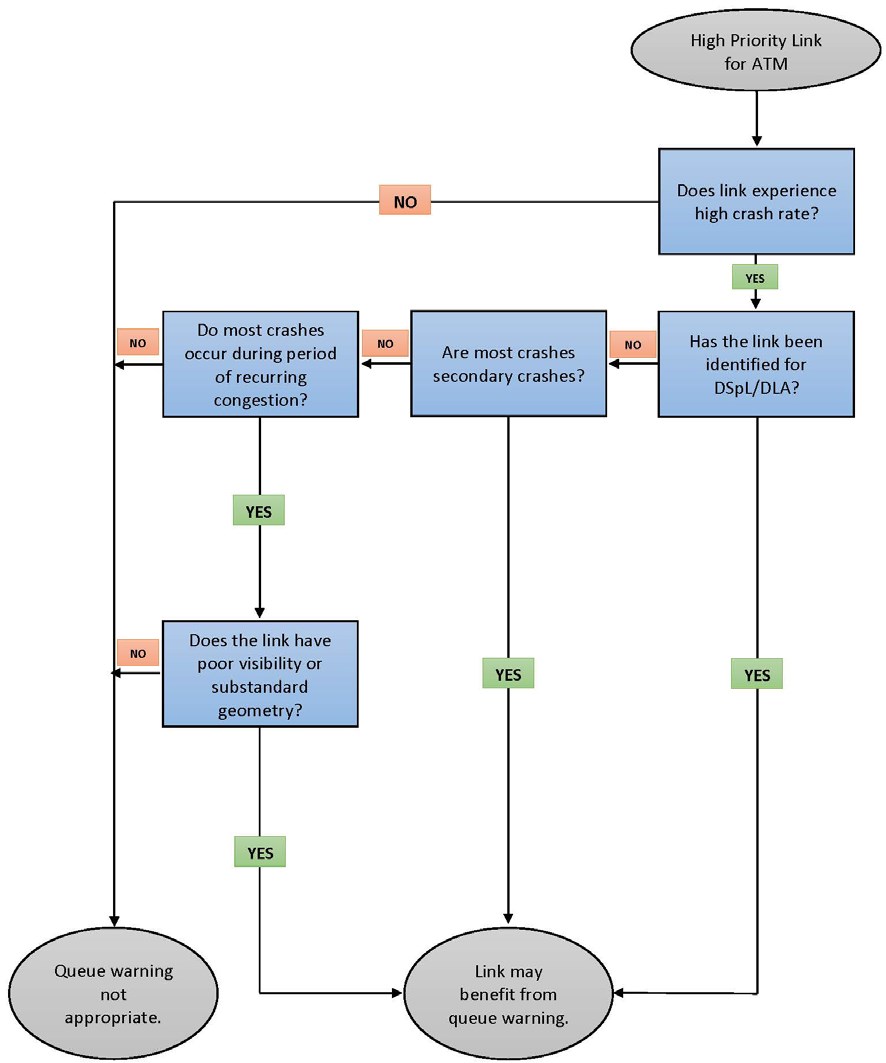
Having prioritized the roadway links and segments for ATM, the next step is to identify the specific ATM strategies for each link and segment. Criteria and guidance for individual ATM strategies are provided in the rest of this chapter. No priority is intended by the order of these individual strategy discussions. The first set of strategies (DSpL, DLA, QW, DShL, and DJC) have primarily been used for limited access roadways (although there is no reason why they could not also be used along arterials). The discussion next shifts to ARM—a freeway-oriented strategy, although one where arterial street conditions can impact ARM operation (and vice- versa) in a truly dynamic scenario. The next two strategies discussed— ATSC and TSP—are arterial focused. The last two ATM strategies discussed are DLC and DMC, both of which are directly applicable to either freeway or arterial operations. 5.2 Dynamic Speed Limits and Dynamic Lane AssignmentThe combination of DSpL and DLA can help reduce crashes, both primary and secondary ones, and also provide additional traffic management capabilities during incident management activities. Additionally, reducing the posted speed as volumes are predicted to increase can help smooth the traffic flow, and more consistent flow is less likely to break down into congested conditions. DSpL and DLA can be, and often are, implemented along roadway segments together. For deployments in the United States to date, these two ATM strategies have used the same DMS (e.g., full matrix color DMS) to display the speed and lane assignment information (as shown previously in Table 4), although not simultaneously. Different DMS for speeds and lane control can also be used. Figure 14 provides an overview of the screening criteria for the implementation of DSpL and DLA strategies. Additional details are provided below. FIGURE 14. FLOWCHART. CONSIDERATIONS AND CRITERIA FOR SELECTING DYNAMIC SPEED LIMIT (DSpL) AND DYNAMIC LANE ASSIGNMENT (DLA) STRATEGIES 5.2.1 Crash RatesThe information from the previous screening activities (i.e., segments, quantitative assessment of links) can be used to identify which links have highest crash rates (e.g., the "safety score" as shown in previous Figure 13). Where the information is available, the proportion of rear-end and/or side-swipe crashes should be considered, because these crash types are most likely to be decreased by implementing DSpL and DLA strategies. Similarly, if there is a high proportion of secondary crashes, then this may indicate a safe stopping distance problem and the associated need for DSpL.(30) 5.2.2 Recurring Reductions or Variations in SpeedThe literature on DSpL provides several (and not too dissimilar) examples for what constitutes "significant recurrent congestion" and the associated variations in average speed, and these may be considered when identifying links for DSpL (and possibly DLA):
Recurring reductions and variations in speeds may also occur in an area that regularly experiences adverse weather conditions (e.g., snow, water on the road, fog, wind, blowing snow) or varying demands and volumes from day to day (e.g., roadway serving a state capital, where the recurrent congestion can vary depending on when the legislature is in session). This can result in traffic problems and slowdowns, and in the case of poor weather conditions, also low visibility or safety hazards for travelers. Such conditions can justify the need for DSpL.(30) 5.2.3 Major ReconstructionAs previously discussed, DSpL and DLA strategies may help to manage traffic during major roadway reconstruction activities. Following are examples:
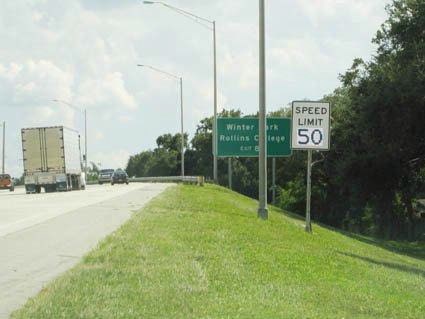
5.2.4 Other Potential Safety ImprovementsThere may be links and segments that experience relatively high crash rates but are not subject to significant recurring congestion and traffic volumes that would likely be a causal factor for variations in speeds. In such instances, the crash problem may be the result of roadway geometrics (e.g., horizontal and vertical curves, ramp bottlenecks, other substandard geometric designs), possibly coupled with a number of trucks and other slow moving vehicles. In these instances, other safety enhancements, such as geometric improvements should be considered and assessed. Additionally, ATM strategies such as queue warning signs (as discussed in Chapter 5.3) and dynamic junction control (as discussed (as discussed in Chapter 5.5, may also be viable options. 5.2.5 Dynamic Speed Limits OnlyDynamic speed limits can be implemented without the accompanying DLA signs over each lane, as has been done in Delaware, on the New Jersey Turnpike, and in St. Louis (among other locations). Using post-mounted DSpL signs installed on the side of the roadway (Figure 15) will likely be appropriate along those roadway links and segments where variations in speeds are caused by recurring weather conditions, day-to-day variations in speeds, or where side-swipe crashes are not an issue; or as a lower-cost approach to providing dynamic speed limits to segments that are not as high priority as others. It is noted, however, that driver compliance to side-mounted DSpL may be lower compared to signs installed on gantries over each lane. FIGURE 15. PHOTOGRAPH. EXAMPLE OF SIDE-MOUNTED DYNAMIC SPEED LIMIT (DSpL) SIGN (Source: Florida DOT) 5.2.6 Arterial ApplicationsThe previous discussions have focused on screening and potentially deploying DSpL and DLA strategies along limited access roadways. These strategies may also be applied on arterial segments. 5.2.6.1 Dynamic Lane Assignments on ArterialsNational Cooperative Highway Research Program (NCHRP) 447 (12) addresses DLA along arterials, stating the following: "…dynamic lane assignment works by allowing agencies to change lane assignments to meet different traffic demands. For example, an approach with heavy left-turn movements in the morning peak can operate with dual left-turn lanes during that peak period. Later, the second left-turn lane can be changed to a through movement once the left-turn demand has abated. These lane assignment changes usually are implemented through the use of changeable overhead signs."12 Dynamic turn restrictions are another form of arterial DLA and provide the ability to restrict certain turning movements only when necessary to improve the intersection safety and operations. Potential applications of dynamic turn restrictions are identified in Reference 12 as follows:
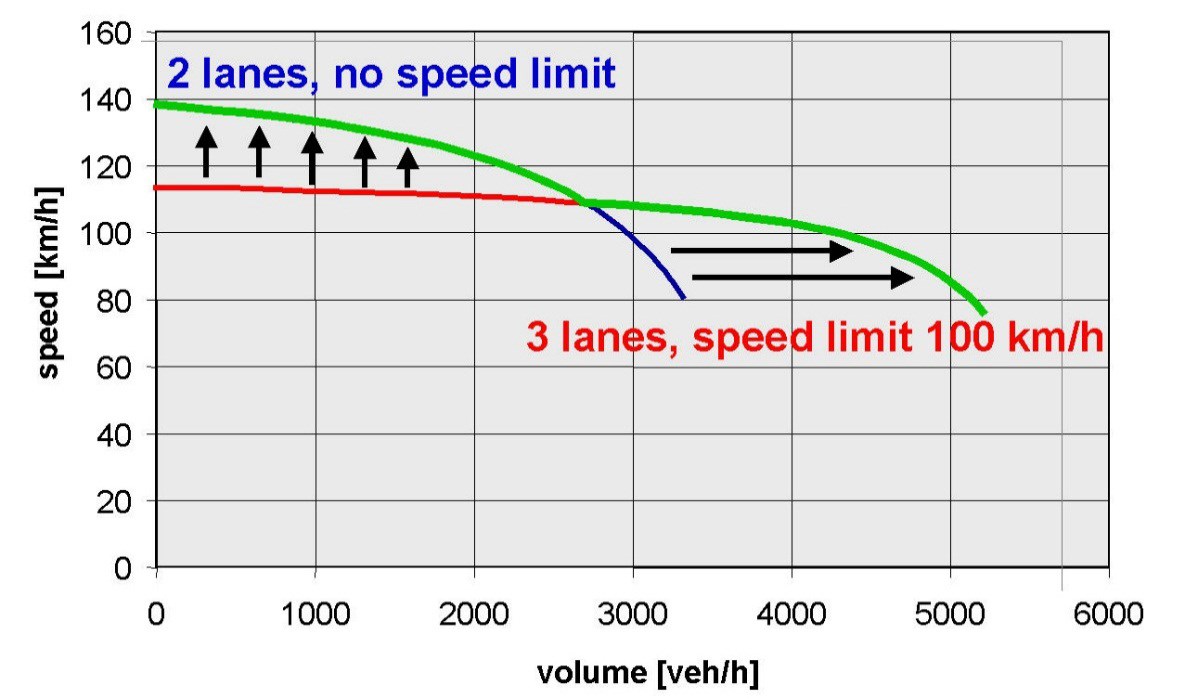
5.2.6.2 Dynamic Speed Limits on ArterialsATM measures involving dynamic speed limits on arterials were not included in the aforementioned NCHRP 447 Synthesis because "there are insufficient installations of the measures on U.S. arterials for a synthesis of current U.S. practice."(12) 5.3 Queue WarningQueue warning consists of the real-time display of warning messages (typically on DMS, and possibly coupled with flashing lights) along a roadway to alert motorists that queues or significant slowdowns are ahead, thus reducing rear-end crashes and improving safety. Figure 16 provides an overview of the screening criteria for implementing queue warning, with additional information provide below. 5.3.1 Crash RatesThe information from the previous screening activities (i.e., segments, quantitative assessment of links) can be used to identify which links have the highest crash rates, particularly in terms of rear-end crashes. Where the information is available, the proportion of secondary crashes should be considered, because this may indicate a safe stopping distance problem and the associated need for queue warning. FIGURE 16. FLOWCHART. CONSIDERATIONS AND CRITERIA FOR SELECTING QUEUE WARNING (QW) 5.3.2 Queue Warning in Conjunction with Dynamic Speed Limits and Dynamic Lane AssignmentThe guidance criteria for queue warning have much in common with the guidance criteria identified in Figure 14 for DSpL and DLA. As a general rule, queue warning signs should be (and often are) installed on the same gantries used for DSpL and DLA signs, thereby providing drivers an explanation as to why the speed limits and/or advisories are being reduced and/or a lane(s) is being closed. These queue warning messages further allow drivers to further anticipate an upcoming situation of emergency braking and slowing down, avoiding erratic behavior, and reducing queuing-related collisions. Understanding the reason for the reduced speeds may also enhance driver self-compliance. Moreover, the incremental cost of including DMS on the DSpL and DLA gantries to provide queue warning messages is relatively small. 5.3.3 Congestion and Sight DistanceAs previously noted, recurring congestion typically results in an increased crash rate. This can be further exacerbated by poor visibility (e.g., sight distance restricted by vertical grades, horizontal curves, or inadequate illumination), leading to an increase in secondary crashes. In the absence of data on the number of secondary crashes, the combination of a high overall crash rate (with most crashes occurring during periods of recurring congestion), coupled with visibility and sight distance issues along the link, indicates that queue warning may be an effective strategy. 5.4 Dynamic Shoulder LanesThe temporary addition of a shoulder lane allows congested roadways to have higher throughput—even if the speeds are reduced—as indicated in Figure 17 (from Germany). In the figure, adding the third lane in the form of temporary shoulder use, while slightly decreasing speed, actually delays the onset of congestion and breakdown and increases the facility's overall throughput. By increasing capacity and encouraging more uniform speeds, the traffic flows more smoothly and efficiently, which can improve trip travel time reliability. FIGURE 17. GRAPH. SPEED-VOLUME RELATIONSHIP OF DYNAMIC SHOULDER LANE (DShL), FROM GERMANY (31) The actual increase in the roadway capacity from opening the shoulder to traffic is dependent on several factors, including the following: (32)
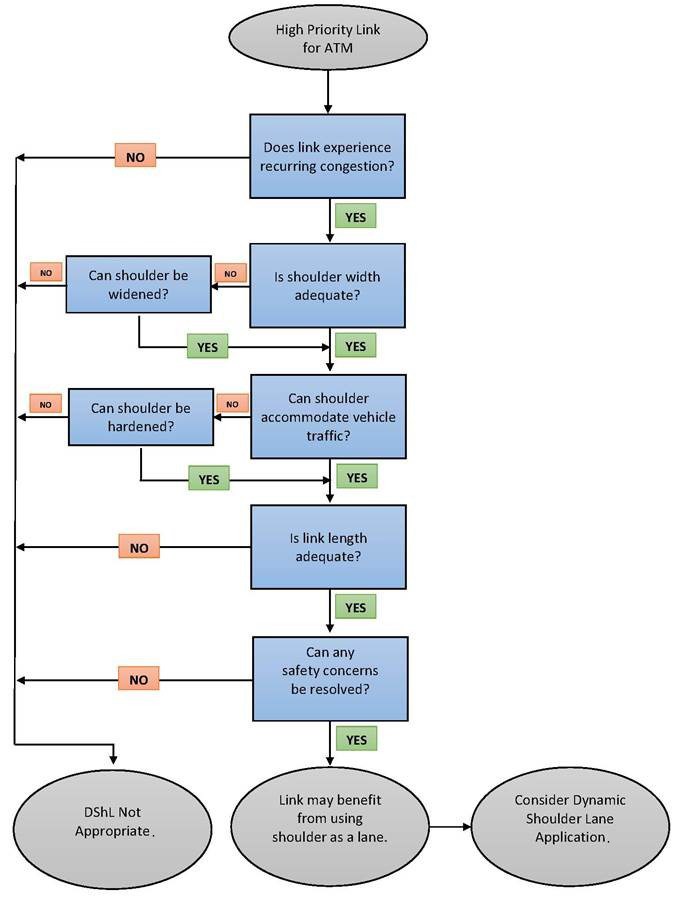
The maximum practical capacity of a shoulder lane has been found to be in the range of 1,200 to 1,500 vph (with the adjacent general purpose [GP] lanes at 1,800 to 2000 vph). Moreover, speeds tend to be 5 to 10 MPH slower than adjacent GP lanes.13 Figure 18 provides an overview of the screening considerations and criteria for implementing shoulder lanes, with additional information provide below. 5.4.1 Recurrent CongestionGiven that dynamic shoulder lanes add temporary capacity to the roadway, recurrent congestion, as is often represented by the volume/capacity ratio, over several hours a day represents a key criterion and screening consideration. The information from the previous screening activities (i.e., segment review, quantitative assessment of links) can be used to identify which links have the greatest recurring congestion issues. Following are criteria used in Europe in this regard:
5.4.2 Shoulder Width and Ability to Accommodate Traffic FlowThe literature is fairly consistent with regards to the minimum shoulder widths for DShL as follows:
FIGURE 18. FLOWCHART. CONSIDERATIONS AND CRITERIA FOR SELECTING DYNAMIC SHOULDER LANES (DShL) Other considerations with respect to shoulder location, design, and geometrics include the following (44):
With respect to the first bullet above, a potential issue, particularly for older roadways, is the extent to which the shoulder has been designed (i.e., "hardened") to accommodate traffic, including trucks. If not, then the shoulder may need to be reconstructed. If the shoulder can accommodate passenger cars, but not heavy vehicles such as trucks and buses, then special signage may be required. The shoulder for DShL can be provided along either the inside or outside shoulder. Table 12 (31) summarizes the advantages and disadvantages of shoulder use alternatives in this regard. A related issue involves managing the shoulder lane through interchanges and dealing with the associated merge issues, particularly for right side shoulder lanes (assuming most on and off ramps are on the right side). An exit-only shoulder lane will have more merging issues with vehicles returning to adjacent GP lanes prior to exit ramps. A carry-through shoulder lane design will have less main line merging issues but more issues with ramp merging, including acceleration distance. All geometric issues associated with dynamic shoulder lanes are not required to be analyzed in great detail as part of the screening process. While reviewing roadway as-built plans is beneficial, finding these might not always be possible. Nevertheless, the screening process should include a drive-through to ascertain the existence of shoulders and their locations (i.e., inside and/or outside), an approximation of existing lane and shoulder widths, the ability to accommodate emergency refuge areas (as discussed below), and the appropriate treatments through interchanges. 5.4.3 Minimum LengthA 3-mile minimum for DShL appears to be a general consensus from the literature. While this is not a hard and fast rule, DShL (as well as DSpL and DLA) does require a strategic approach to provide a more consistent driving experience and to minimize the potential for driver confusion. A related consideration is that the DShL segment must extend through the roadway bottleneck (e.g., interchange). If it does not extend beyond the bottleneck, then traffic is simply fed at a greater rate into the segment that is already over capacity, thereby compounding the congestion.14 5.4.4 Safety ConcernsSafety concerns of removing the breakdown safety shoulder when the shoulder is open to traffic may limit public and policymaker acceptance of this DShL strategy. Traditionally, the shoulder has been used as an area of safe refuge and as an emergency pull off area. Operating the shoulder as a GP lane may cause concern unless it can be shown that this operational approach can be accomplished in a safe, consistent fashion. When a breakdown does occur, a motorist may not have safe clearance to exit the vehicle. This can be mitigated to some extent by locating emergency refuge pull-outs at regular intervals along the roadway for DShL. Figure 19 shows the installation of an emergency refuge area in the United Kingdom. FIGURE 19. PHOTOGRAPH. EMERGENCY REFUGE AREA IN THE UNITED KINGDOM (13) (Source: UK Highways Agency) The literature typically recommends that such emergency refuge areas be included as part of a DShL project and installed every 0.5 to 1.5 miles, depending on the crash history, frequency of ramps, available right-of-way, and the topography. Further enhancing the existing operations and ITS technologies, such as additional monitoring equipment (e.g., shoulder detection, CCTV) and service patrols that allow effective incident response when vehicles breakdown (or are involved in a crash) and pull into the areas, should be considered. Video cameras should also be regularly spaced to allow operators to check for obstacles before opening the shoulder to traffic and to monitor operations while shoulder use is permitted. Another safety concern with DShL is the potential reduction of the clear zone distance. While agencies be able to move some fixed objects, guardrails, and other barrier treatments, such accommodations are not always possible. Thus, when traffic is allowed to travel in the shoulder, the effective clear zone and sight distance may be reduced to distances below the minimum allowed, necessitating a reduction in speed limits (via DSpL). Other safety concerns to consider as part of the screening process (e.g., sign displays and DShL operations and the associated costs) include the following:
5.4.5 Transit OperationsAnother approach to temporary shoulder use is for transit only. Also known as a bus bypass shoulder or bus on shoulder, with this approach, only transit vehicles are allowed to utilize the designated shoulder, often with driving instructions for bus drivers to ensure the safety of the operation and all the freeway users. References 31, 34, and 52 include some criteria for transit-only shoulder use, indicating that a facility should have the following:
5.4.6 An ATDM ApproachShoulder lanes are in use along several roadways in the United States, with the shoulder being opened based solely on a time-of-day and/or day-of-week schedule. From a "proactive" ATDM perspective, "dynamic" shoulder lanes should also be activated as required based on congestion levels during peak periods, to accommodate special event traffic, and in response to incidents15 or other conditions as warranted during nonpeak periods. Finally, DShL may be a precursor to permanent roadway widening. Permanent use of the shoulder as a travel lane may also be a possibility, as is being done in the United Kingdom. 5.5 Dynamic Junction ControlJunction control (or it may be referred to as "interchange control" in the United States to reflect the difference in terminology between the United States and the United Kingdom) involves the dynamic allocation of lane access on mainline and ramp lanes in interchange areas, thereby accommodating increased volumes where the relative demand on the mainline and ramps change throughout the day. For example, this may involve the following:
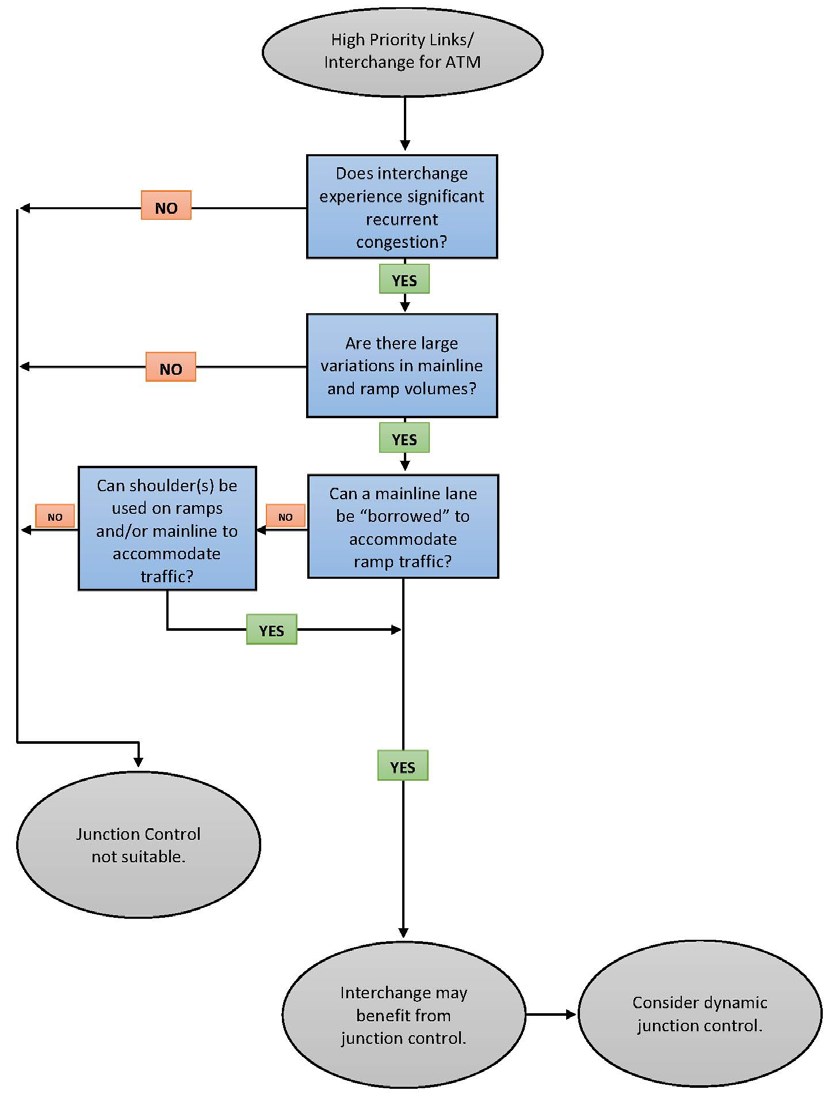
Figure 20 provides an overview of the screening criteria for implementing junction control with additional information provide below. FIGURE 20. FLOWCHART. CONSIDERATIONS AND CRITERIA FOR SELECTING DYNAMIC JUNCTION CONTROL 5.5.1 CongestionThe information from the previous screening activities (i.e., identify segments, quantitative assessment of links) will likely identify recurrent congestion, bottleneck, and/or safety problems near interchanges, and these interchanges will be candidates for junction control. The most likely candidates will be those interchanges that experience significant recurrent congestion with high volumes of entering or exiting ramp, with one reference(31) noting minimum ramp volumes of "900 vehicles per hour per lane, if not higher." 5.5.2 Variations in Mainline and Ramp VolumesFor junction control to properly work, significant temporal variations in mainline and ramp volumes must exist, plus the ability to accommodate these varying volumes by "shifting" lane assignments between the mainline and the ramps, including their respective shoulders being used as travel lanes — within the interchange area. Moreover, temporarily "borrowing" a mainline to accommodate entering or exiting traffic should only be employed if adequate capacity can be maintained on the rest of the mainline lanes, not causing LOS E (or worse) on the rest of the mainline.(31) Accommodating the increased interchange volumes by temporary using the shoulder(s) as travel lane(s) on the ramps and/or mainline might also be possible. 5.5.3 Shoulder Widths and Structure
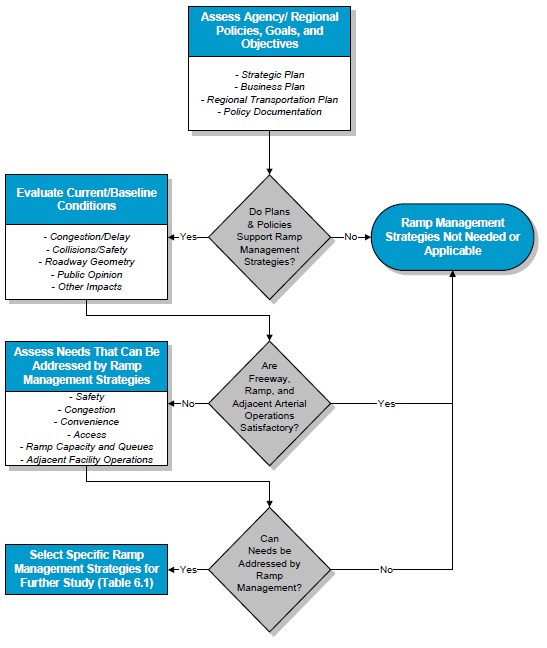
If the mainline and/or ramp shoulders are used as part of a junction control strategy—in 5.5.4 An ATDM ApproachFrom a "proactive" ATDM perspective, junction control should be implemented and operated in a dynamic manner as required based on congestion levels during peak periods to accommodate special event traffic and in response to incidents near the interchange or other conditions as warranted during nonpeak periods. This requires continuously monitoring the mainline and ramps and dynamically changing lane access in the interchange area based on the real-time and anticipated conditions. Another important consideration is implementing DSpL and DLA signage across all lanes upstream of the interchange—on both the mainline and the ramps—to the extent that all drivers are provided with sufficient advance warning of any changes in lane use and (as may be required) speed limits. 5.6 Adaptive Ramp MeteringRamp metering consists of deploying traffic signal(s) on ramps to dynamically control the rate vehicles enter a freeway facility, thereby smoothing the flow of traffic onto the mainline and allowing more efficient use of existing freeway capacity. In an ATDM context, adaptive ramp metering uses traffic responsive or adaptive algorithms (as opposed to pretimed or fixed-time rates) that can optimize either local or systemwide conditions based on real-time and/or anticipated traffic volumes on the freeway facility, the metered ramps, and possibly the parallel arterial streets that feed the ramps. The Ramp Management and Control Handbook (11) provides comprehensive guidance and recommended practices on managing and controlling traffic on ramps with freeway facilities. The Handbook describes a process, illustrated in Figure 21, that may be used to narrow down the list of available ramp management strategies to those that meet an agency's goals, objectives, and policies and can be applied to remedy specific problems and/or situations. In other words, practitioners should begin the process of selecting ramp management strategies by focusing their efforts on narrowing the list of available strategies to those that may be best applied based on existing situations or problems. FIGURE 21. FLOWCHART. PROCESS FOR SCREENING RAMP MANAGEMENT STRATEGIES (11) ARM may be viewed primarily as a systemwide approach for addressing more complex problems than local ramp metering. The Ramp Management and Control Handbook identifies "systemwide traffic responsive ramp metering" as “providing optimal metering rates based on real-time conditions throughout the system or corridor, noting that system-wide ramp metering may be the preferable option where (11)
The Enterprise Pooled Fund Study, Warrants for the Installation and Use of Technology Devices for Transportation Operations and Maintenance (36) includes the following warrant for “corridor-wide ramp meter deployment,” which is based on work done by MnDOT: Warrant: Corridor-wide Ramp Meter Deployment Purpose: This warrant addresses the need for a “zone” of ramp meters along a stretch of freeway (typically considered in 3- to 6-mile segments). 1. Control factors: During the AM or PM peak period, the zone in consideration has at least 30 minutes per commute day (measured in 5-minute increments) where the demand is equal to or exceeds 95 percent of the downstream capacity, according to the following equation: MV + OR > (ER + MC) *.95 Where:
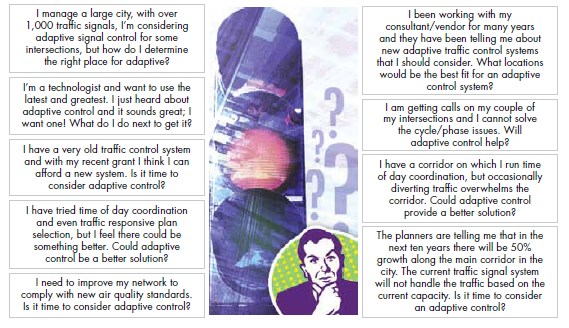
MV = Upstream mainline volume (in vehicles per 5 minutes) Or Platoons from signalized intersections are recognized to adversely impact all on-ramps feeding the freeway segment under consideration. For example, if hourly volume, based on maximum 30-second volume readings projected to hourly volumes, exceed 1,100 vph (regardless of overall hourly volume). Note: Overall hourly volume entering from arterials may be relatively low (e.g., 700 vph). However, during periods when platoons arrive, if 30-second readings of volumes represent 1,100 vph or greater, then this factor is considered met. And 2. Safety factors: There is one or multiple area(s) within the zone where crashes are understood to exceed the typical crash rate (at the ramp gore point or within 500 feet in either direction of the gore point) for the metropolitan area. And 3. Functionality factors: Volumes at ramps being considered for meters, within the zone, fall within the range of 240 to 900 vph per lane during peak periods. Adaptive ramp metering represents an emerging area of dynamic control. Accordingly, practitioners are recommended to review16 the results of pilot deployments of adaptive ramp metering such as Interstate 210 in Los Angeles County (which is ongoing at the time of preparing this Guide). 5.7 Adaptive Traffic Signal ControlATSC continuously monitors arterial traffic conditions and dynamically adjusts the signal timing to smooth the flow of traffic along coordinated routes and to optimize one or more operational objectives (such as minimize overall stops and delays or maximize green bands). The Model Systems Engineering Documents for Adaptive Signal Control(37) includes a figure (reproduced herein as Figure 22) stating the following: Look at the questions and statements in the figure. If one or more of these statements or questions applies to you, then adaptive control may be able to help you, and you should proceed. FIGURE 22. DIAGRAM. SHOULD YOU CONSIDER ADAPTIVE TRAFFIC SIGNAL CONTROL? (37) Other advantages and improvements resulting from ATSC (37) include the following:
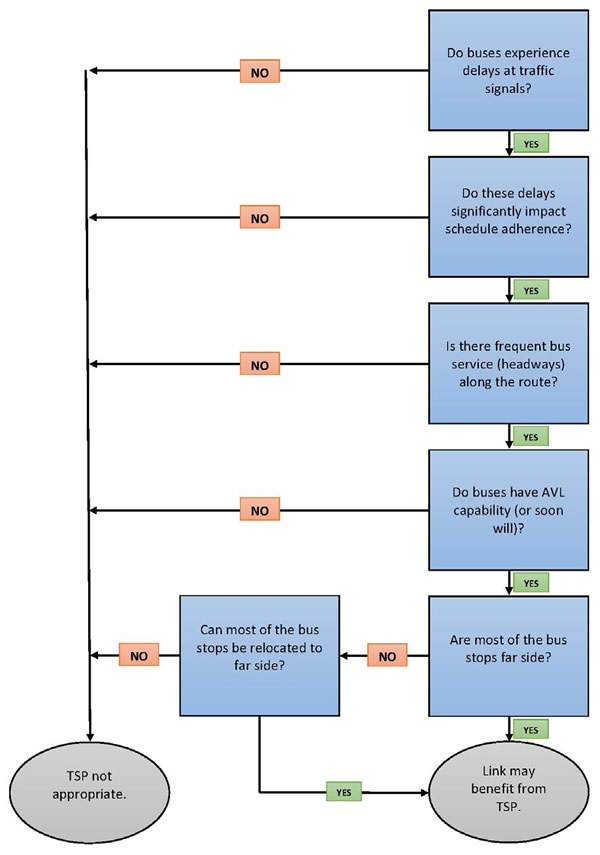
5.8 Transit Signal PriorityThis ATM strategy manages traffic signals by using sensors or on-board vehicle technology to detect when a bus nears a signal controlled intersection, turning the traffic signals to green sooner or extending the green phase, thereby allowing the bus to pass through the intersection more quickly and help maintain scheduled transit vehicle headways and overall schedule adherence. Priority is not the same as "preemption." Priority is the preferential treatment of one vehicle class (such as a transit vehicle) over another vehicle class at a signalized intersection without causing the traffic signal controllers to drop from coordinated operations. TSP is typically "conditional," depending on such considerations as the amount of time (e.g., signal cycles) since the last priority was given, whether the bus is on schedule or not (i.e., generally there is no need for priority if the bus is currently operating on schedule), and the bus loading (i.e., number of passengers). Priority may be accomplished by a number of methods, including the beginning and end times of greens on identified phases, the phase sequence, and inclusion of special phases, without interrupting the general timing relationship between specific green indications at adjacent intersections. Figure 23 provides an overview of the screening criteria for implementing TSP. These criteria are derived from information contained in The Transit Signal Priority Planning and Implementation Handbook,(38) with additional information provided below. 5.8.1 Bus Delays at Signalized Intersections and Their Impacts on Schedules
The Transit Signal Priority Planning and Implementation Handbook (38) notes that many transit
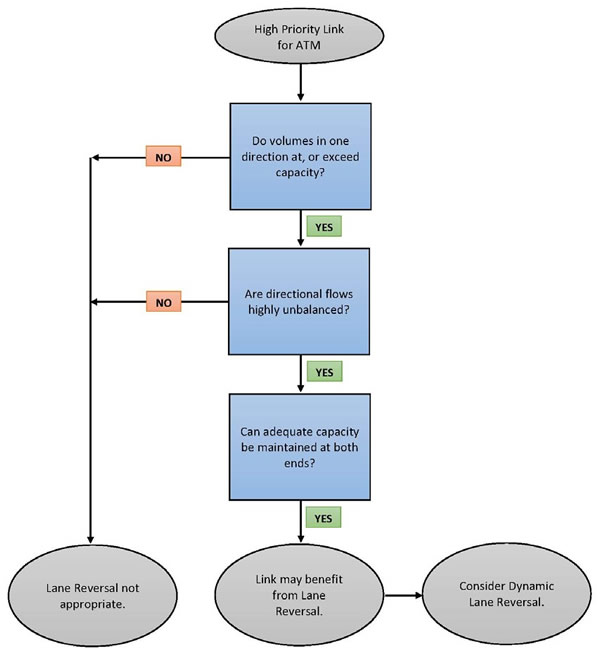
FIGURE 23. FLOWCHART. CONSIDERATIONS AND CRITERIA FOR SELECTING TRANSIT SIGNAL PRIORITY (TSP) 5.8.2 Bus Headways and Frequency of ServiceThe Transit Signal Priority Planning and Implementation Handbook (38) notes that bus headways along TSP corridors ranged from 90 seconds to more than 30 minutes. During the peak hour, most agencies reported headways from 5 to 30 minutes, depending on the route and type of service (e.g., bus, light rail transit, express). Level of ridership on the buses is a related consideration. 5.8.3 Automated Vehicle Location on BusesThere are several advantages to whether the buses along a potential TSP route have AVL capability. Depending on the TSP system architecture, a communications link can be established between the transit operations center and the traffic management center to let the individual signalized intersections know when a bus is approaching; or this can be accomplished wirelessly directly between the bus and the traffic signal controller without AVL. The primary advantage of an AVL-enabled bus system, assuming the transit management system also includes real-time information on schedule adherence, is that the bus should not need to request priority if it is not behind schedule. 5.8.4 Far-Side Bus StopsFar-side bus stops is an important operational consideration. If a bus requests and receives signal priority, only to stop at a bus stop before traveling through the signalized intersection, then it does neither the transit schedule adherence nor the arterial coordination any good. In fact, it probably makes matters worse. 5.9 Dynamic Lane ReversalThis strategy, also known as contraflow lane reversal, consists of reversing lanes to dynamically allocate the capacity of congested roads, thereby allowing capacity to better match traffic demand throughout the day. Reversible traffic lanes add capacity to a road and decrease congestion by borrowing capacity from the other (off-peak) direction. DLR can be applied to both freeways and arterials. There are several examples of lane reversal systems being applied on freeway segments, particularly on bridges and tunnels (and the approaches thereto) — areas where it is difficult to widen. Contraflow operations are also implemented on freeways for managed lanes (e.g., bus only lanes, such as the Lincoln Tunnel into New York City). Figure 24 provides an overview of the screening criteria for implementing DLR, with additional information provided below. This is based primarily on information contained in NCHRP Synthesis 340 — Convertible Roadways and Lanes. (35) Additionally, the literature tends to focus on arterial applications of DLR, although the criteria and considerations noted for arterial streets are transferrable to freeway operations. 5.9.1 Volumes in Excess of CapacityThe information from the previous screening activities (i.e., segments, quantitative assessment of links) can be used to identify which directional links have the greatest recurring congestion issues (e.g., the "congestion score" as shown in previous Figure 13), indicating a situation where the volumes are in excess of capacity. The aforementioned NCHRP Synthesis 340, referencing ITE criteria also indicates the following:
5.9.2 Unbalanced Directional FlowsThe operational principle behind reversible lanes is to take advantage of unused capacity in one direction of (minor) flow to increase the capacity in the congested direction of (major) flow—in essence, borrowing a lane from the minor flow and giving it to the major flow. Obviously, there must be unused capacity in the minor flow direction so that taking a lane away does not cause undue congestion in that direction. Additionally, DLR operations are most effective when highly unbalanced directional flows are present. Specific considerations in this regard (as noted in NCHRP Synthesis 340 (35)) include the following:
FIGURE 24. FLOWCHART. CONSIDERATIONS AND CRITERIA FOR SELECTING REVERSIBLE LANE CONTROL 5.9.3 Adequate Capacity at TerminiAdequate capacity must be maintained at both termini, and the transition from the normal operation to the reversible segment must be easy for drivers to negotiate. Inadequate capacity of these points will likely create bottlenecks that can diminish (or even eliminate) the utility of the reversible section. Other capacity- and roadway-related considerations include the following:
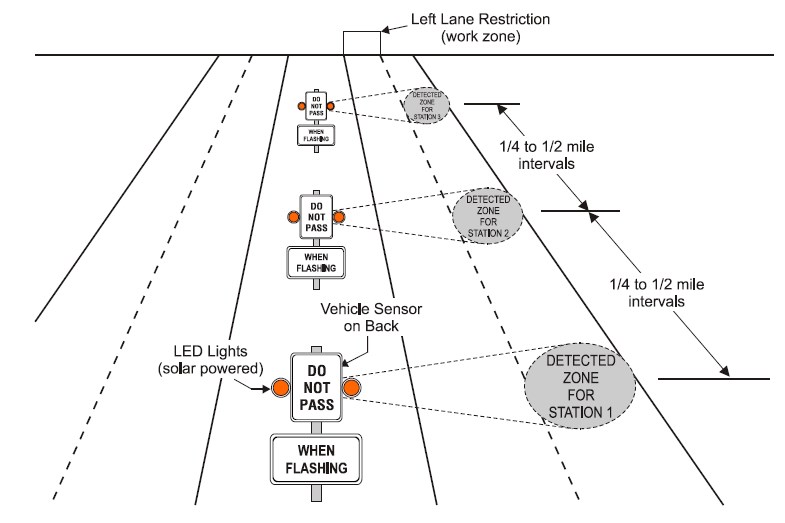
5.9.4 An ATDM ApproachBeing a form of lane assignment, an ATDM approach, in which the directional flows are continuously monitored and real-time incident data are used to control the reversible lanes (i.e., "dynamic" lane reversal) should be considered in addition to static time-of-day/day-of- week operations. That said, where a physical (and moveable) barrier is used to separate directions, reversing lanes may be a relatively long and involved procedure and may not lend itself to all such "dynamic" applications, unless the situation is expected to last for several hours or longer. Examples in this regard may include into and out of special event venues and during evacuations before major coastal storms and hurricanes and when evacuated residents are allowed back into the impacted area. 5.10 Dynamic Merge ControlDynamic merge control, also known as dynamic late merge or dynamic early merge, consists of dynamically managing the entry of vehicles into merge areas with a series of advisory messages (e.g., displayed on a DMS) approaching the merge point that prepare motorists for an upcoming merge and then encouraging or directing a consistent merging behavior. DMC can help create or maintain safe merging gaps and reduce shockwaves upstream of merge points. No criteria are provided in this Guide. This strategy appears to have been mostly applied in work zones involving lane closures and in advance of median crossovers where one roadway is closed to traffic to provide a work space and two-lane, two-way traffic is maintained on the other roadway. DMC eliminates the "forced lane merge phenomenon" when some drivers try to avoid slow moving traffic by traveling in a lane that is about to end and then attempt to force a merge at the last moment. This is a dangerous driving maneuver for the driver, other motorists, and workers in the construction zone. A forced-lane merge of this type may cause hostility and "road rage" among the other patiently waiting drivers.(39) 5.10.1 Dynamic Early MergeThe idea behind the dynamic early merge is to create a dynamic no-passing zone to encourage drivers to merge into the open lane before reaching the end of a queue, and to prohibit them from using the closed lane to pass vehicles in the queue and merge just before reaching the lane closure. Figure 25 provides a schematic of the Indiana Early Merge System, which consists of dynamic "Do Not Pass/When Flashing" sign trailers that are equipped with detectors to capture speed, volume and lane occupancy data at the detection zone. A series of five signs dynamically communicate with one another to create a variable length of no passing zone by activating the signs in an on-and-off flashing mode based on the detected traffic volume and occupancies. FIGURE 25. DIAGRAM. DYNAMIC EARLY MERGE SYSTEM (54) Field testing and simulation of this approach identified the following: (40)
A study of a similar dynamic early merge system in Michigan,(39) involving a three- to two-lane transition into a work zone, concluded that the early merge system will operate efficiently during medium to moderately high-density levels, (LOS D to E). This is also more appropriate for a long-term work zone. 5.10.2 Dynamic Late MergeThe dynamic late merge approach is the opposite of the dynamic early merge approach in that drivers are encouraged to use either the open or closed lane(s) until they reach the merge point at the lane closure taper, rather than merging as soon as possible into the open lane. One example of the dynamic late merge is the system developed by PennDOT. This system was implemented as a means to reduce the road rage engendered between drivers who merge into the open lane early and those who remain in the closed lane and merge into the open lane near the front of the queue at the last possible moment. Approximately 1.5 miles in advance of the lane closure, "USE BOTH LANES TO MERGE POINT" signs are placed on both sides of the roadway. These signs are followed by conventional "ROAD WORK AHEAD" and advance lane closed signs. Finally, "MERGE HERE TAKE YOUR TURN" signs are placed on both sides of the roadway near the beginning of the taper.(40) The concept behind late merge is to make more efficient use of roadway storage space by allowing drivers to use all available traffic lanes to the merge point. Once the merge point is reached, the drivers in each lane take turns proceeding through the work zone. The combined effect of maximized storage and orderly merging operations may have the potential to increase throughput, reduce queue lengths, shorten travel times, and discourage aggressive driving.(40) Conceptually, the lengths of the queues that form as a result of congestion are reduced by about 50 percent, because the queued vehicles are stored in two lanes instead of only one. The shorter queue lengths reduce the likelihood of them extending back beyond the work zone's advance warning signs and surprising approaching drivers, which in turn reduces the potential of rear-end crashes. In addition, drivers experience less anxiety about knowing which lane is closed, because either lane can be used to reach the merge point. The availability of both lanes also reduces the frustration levels of drivers. Drivers in the open lane are less likely to be irritated by others passing by them in the closed lane, because this maneuver is permissible with the dynamic late merge. Drivers are able to select the lane with the shortest queue and not be concerned about others blocking their path to the merge point.(40) A University of Nebraska study (40) found that dynamic late merge had a higher capacity than dynamic early merge. Moreover, they found that the dynamic early merge increases travel times, especially under high-traffic volumes. Based on these findings, the study states that the best system of merge control during peak periods is the dynamic late merge. The study did note a concern about the potential for driver confusion at the merge point with the dynamic late merge, especially under high-speed, low-volume conditions, which could adversely affect safety. Under these conditions, drivers might find it more difficult to decide who has the right-of-way; this indecision could increase the potential for collisions at the merge point. As such, dynamic late merge may not be the best approach during off-peak periods. 5.11 Tying and Integrating Selected Strategies TogetherThe final activity of this step is to take the individual strategy recommendations for the various links and combine them, identifying and grouping the multiple ATM strategies that may have been defined for each link. While ATM strategies can be deployed singularly to address a specific need or problem, many strategies are complementary, and combining them can often help to achieve systemwide goals and objectives of safety, congestion management and mobility, traveler information, and environmental needs, resulting in synergistic operations and benefits. For example:
A strategic approach to ATM deployment is critical, providing a continuity of strategies and a more consistent driving experience. Perhaps the most important consideration in this activity of combining ATM strategies is to take a strategic approach to the entire roadway, or long segments of it, providing some ATM elements in the "gaps," even where they are not justified on a stand-alone basis. For example, say that the screening process has identified two 7-mile stretches of roadway for implementing DSpL, DLA, and QW, and these two segments are only 2 or 3 miles apart, with no ATM having been recommended for this intervening segment. It may be worthwhile to also include some ATM in this "gap." Such a strategic approach will help deliver a more consistent driving experience, minimizing the possibility for confusion by drivers. 10 TMC in this context stands for "Traffic Management Channel," a standard used for broadcasting real-time traffic information that includes location, the area, and highway segment or point location affected. 11 Or this may be done using volume/capacity ratios. 12 This is a form of junction control as discussed later. 13 https://ops.fhwa.dot.gov/atdm/research/index.htm#susap1 14 If DShL is required only near an interchange, then a form of junction control — as discussed in Chapter 5, Section 15 From an incident management perspective, dynamic operation of DShL can mean closing the shoulder during peak periods to general traffic to allow emergency responders to quickly get to the incident scene and then opening then opening the shoulder to help reduce the incident- related congestion. 16 The "Updated Literature Review" as part of the "Getting Ready" activities. 17 The date of the Handbook is 2005. Guidance might have changed with the installation of GPS-based, computer-aided dispatch systems for transit operations since that date. | |||||||||||||||||||||||||||||||||||||||||||||||||||||||||
|
United States Department of Transportation - Federal Highway Administration |
||