Active Traffic Management Feasibility and Screening Guide
Chapter 2. Get Started — Preparation
This chapter addresses a number of activities that need to be accomplished to prepare for the process of determining ATM feasibility.
2.1 Ensure ATM Supports Regional Goals
The aforementioned "Objectives-Driven, Performance-Based Approach for Metropolitan Planning for Operations" (as shown in Figure 1) stresses the importance of any operations- oriented program or project being consistent with regional goals and the associated objectives. Reference 3 ("ATDM Lessons Learned") also addresses this, noting that without this connection, "agencies will struggle with communicating the concept to stakeholders and partners and will not have a benchmark against which the project can be measured." As a practical point, a project that is consistent with regional goals is an "easier sell." The potential benefits resulting from ATM strategies are often quite impressive, as summarized in Tables 5 (from U.S. deployments) and 6 (from European deployments).2 As such, ATM can be tied to several goals, including those listed below:
-
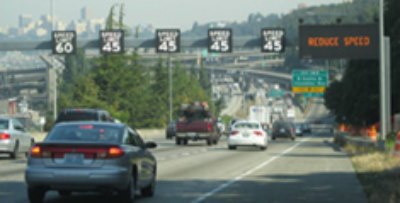
Safety — ATM strategies such as dynamic speed limits and queue warning can reduce rear-end crashes that result from a motorist's inability to reduce speed quickly enough when congestion is initially observed. ATM strategies such as dynamic lane assignment may also help to reduce side-swipe and lane-change collisions at the ramp and freeway merge points and weaving areas. Moreover, congestion, regardless of its cause, increases the potential for collisions to occur; as noted below, ATM can help reduce congestion.
-
Mobility — In general, ATM strategies such as dynamic speed limit, dynamic lane assignment, and queue warning can reduce turbulence in freeway traffic flow, which helps delay or prevent flow breakdown from occurring. Dynamic shoulder lanes can provide additional capacity when it is needed (e.g., peak travel periods). The reduction in crashes (i.e., the safety goal) also enhances mobility by reducing nonrecurring congestion. On arterials, the ATM strategy of adaptive traffic signal control by providing a broad "green band" along the road can provide smoother flow and maximize throughput.3
TABLE 5. SUMMARY OF ACTIVE TRAFFIC MANAGEMENT (ATM) BENEFITS FROM U.S. DEPLOYMENTS
|
ATM Strategy
|
Location and Reference
|
Benefits
|
|
Adaptive Traffic Signal Control
|
Range per the U.S. Department of Transportation Intelligent Transportation System Joint Program Office Benefits Database (8)
- Reductions in stops of 10 to 41 percent.
- Reductions in delays of 5 to 42 percent.
|
|
Ramp Metering
|
Multiple locations(11):
- Portland, Oregon: 43 percent reduction in peak period collisions and 173 percent increase in average travel speed.
- Seattle, Washington: 39 percent reduction in collision rate and 52 percent reduction in average travel time.
- Minneapolis, Minneapolis: 24 percent reduction in peak period collisions 16 percent increase in peak-hour travel speed.
- Long Island, New York: 15 percent reduction in collision rate and 9 percent increase in average travel speed.
|
|
Dynamic Speed Limits, Dynamic Lane Assignment, and Queue Warning
|
Seattle: ATM strategies were deployed along a 7-mile stretch of northbound Interstate 5 (I-5) just south of downtown Seattle, a corridor that was already actively managed via ramp metering, a robust incident management program, and traveler information.(5)
(Source: Washington State DOT)
|
- A before-and-after study (3 years for each period) showed total crashes decreased 4.1 percent along the ATM segment. (During the same period, the southbound segment of I-5 — without ATM — experienced a 4.4 percent increase in the number of crashes.)
|
|
Transit Signal Priority
|
Multiple Locations (12)
- In Tacoma, Washington, the combination of TSP and signal optimization reduced transit signal delay approximately 40 percent in two corridors.
- TriMet (Portland, Oregon) was able to avoid adding one more bus by using TSP and experienced a 10 percent improvement in travel time and as much as a 19 percent reduction in travel time variability.
- In Chicago, PACE buses realized an average 15 percent reduction (3 minutes) in running time. Actual running time reductions varied from 7 to 20 percent, depending on the time of day.
- Los Angeles experienced as much as a 25 percent reduction in bus travel times with TSP.
|
|
Dynamic Speed Limits, Dynamic Lane Assignment, Queue Warning and Dynamic Shoulder Lanes (for high- occupancy toll [HOT] lanes)
|
Minneapolis: Dynamic speed advisories (i.e., not legal limits) and dynamic lane assignment strategies—along with conversion of high-occupancy vehicle lanes to HOT lanes and using Dynamic Shoulder Lanes for HOT operations—were deployed in Minneapolis on Interstate 35W (I-35W), a corridor that was already actively managed via ramp metering, a robust incident management program, and traveler information. The work also included transit and geometric improvements. A formal evaluation was conducted as part of the Urban Partnership Agreement.(6,7)

(Source: Minnesota DOT)
|
- The Dynamic Speed Limit system positively impacted the most severe congestion (speeds below 10 to 15 miles per hour [mph]).
- The instances and spread of extreme congestion waves has been reduced.
- On average, the morning peak experienced 17 percent less congestion with the DSpL system in place.
- Crash reductions in the 6-month post-deployment period were as follows:
- 9 percent for fatal plus injury crashes
- Greater than 20 percent for property damage only, and for total crashes, when the change in vehicle miles traveled was accounted for on I-35W.
- Small compliance to the advisory speed limits was observed.
|
|
Dynamic Speed Limits
|
While not an actual deployment, the University of California-Riverside used their Comprehensive Modal Emission Model and data from the California Freeway Performance Measurement System to evaluate the deployment of a system providing dynamic speed recommendations to drivers—based on traffic conditions and other external variables such as weather conditions—on freeways in Southern California. (10)
|
- Smoothing traffic flow during congested conditions could result in approximately 10 to 20 percent reductions in fuel consumption and carbon dioxide emissions, without drastically affecting overall travel times.
|
|
Dynamic Junction Control
|
Los Angeles: A junction control system was installed in Los Angeles at the northbound State Route 110 connector to northbound I-5. The system consists of blank-out signs, allowing the lane adjacent to the exit- only lane to also be used as an exit lane (in addition to remaining a through lane) during peak periods.(9)
(Source: Caltrans)
|
Following implementation of DJC:
- Average ramp delay reduced from greater than 20 minutes to under 5 minutes.
- Crashes decreased 30 percent from previous year.
|
|
Dynamic Shoulder Lanes (Bus on Shoulder [BOS] operations)
|
A 2-year "BOS" pi=cot program was implemented in Illinois on the Interstate 55 corridor in Du Page and Cook Counties.(50)
(Source: Illinois DOT)
|
- Pace bus on-time performance increased from 68 to 92 percent.
- Ridership increased threefold.
- The number of bus trips was increased to accommodate increased demand.
- There were no impacts on safety.
- BOS program was made permanent, paving the way for shoulder operations on other highways and tollways in the region.
|
|
Dynamic Shoulder Lanes (Bus on Shoulder [BOS] operations)
|
The Minneapolis metro area uses BOS operations extensively, with over 300 miles of bus- only shoulders, ensuring fast, reliable travel times for commuters on thousands of buses daily (52). Several other locations also use the shoulder for bus operations.
|
TABLE 6. SUMMARY OF ACTIVE TRAFFIC MANAGEMENT (ATM) BENEFITS FROM EUROPEAN DEPLOYMENTS
|
ATM Strategy
|
Location, Reference, and Benefits
|
|
General; freeway ATM
|
The FHWA 2006 International Scan of ATM systems in Europe,(13) which focused on Dynamic Speed Limits, Dynamic Lane Assignment, Queue Warning, and Dynamic Shoulder Lanes, identified multiple benefits. Depending on the location and the combination of strategies deployed, specific ATM benefits measured in Europe included the following:
- An increase in average throughput for congested periods of 3 to 7 percent.
- An increase in overall capacity of 3 to 22 percent.
- A decrease in primary incidents of 3 to 30 percent.
- A decrease in secondary incidents of 40 to 50 percent.
- An overall smoothing of speeds during congested periods.
- An increase in trip reliability.
- The ability to delay the onset of freeway breakdown.
|
|
Dynamic Speed Limits, Dynamic Lane Assignment
|
An evaluation of the Managed Motorway System on the M25 (London Orbital) in the United Kingdom (14) showed a decrease in the number of shockwaves, with a reduction from a typical seven shockwaves per morning rush hour, down to a typical five. Other benefits included the following:
- Injury crashes decreased by 10 percent.
- Damage-only crashes decreased by 30 percent.
- Emissions decreased overall by between 2 and 8 percent.
- Weekday traffic noise adjacent to the scheme was reduced by 0.7 decibels.
|
|
Dynamic Shoulder Lanes
|
Dynamic Shoulder Lanes in Germany (16) during peak period reduced congestion by 30 percent, and crashes caused by traffic jams reduced 25 percent.
|
|
Dynamic Speed Limits
|
A comprehensive program of field trials with several new applications of DSpL on motorways was carried out in The Netherlands in 2009 and 2010. Following are some of the key findings (15)
- Lowering the speed limits from 120 kilometers per hour (km/h) (74.6 mph) to 100 km/h (62.1 mph) or 80 km/h (49.7 mph) before and during heavy rain reduced average speeds by 9 to 13 km/h (5.6 to 8.1 mph) on top of the reduction drivers would apply in the absence of the dynamic speed limit. Traffic safety was improved substantially.
- A shockwave algorithm designed to improve throughput by lowering the speed limit from 120 km/h (74.6 mph) to 60 km/h (37.3 mph)—with intermediate speed limits of 100 km/h and 80 km/h—actually reduced throughput in some sections.
- Allowing a higher speed limit during the night increased the acceptance of a lower speed limit throughout the day.
- Analysts concluded that using dynamic speed limits to reduce airborne pollution of particulate matter will only be effective when the traffic emission as part of the total concentration is relatively high.
|
|
Dynamic Speed Limits, Dynamic Lane Assignment, and Dynamic Shoulder Lanes
|
An evaluation of the M42 in the United Kingdom identified the following benefits (17)
- Property damage only crashes reduced by 30 percent.
- Personal injury crashes declined from 5.2 per month before to 1.5 per month after implementation.
- Overall, drivers had a slightly longer journey on the M42 with dynamic shoulder lanes, due to the reduced speed limits in operation. The journey times were, however, much more reliable. On average, over all weekdays, the variability of journey times was reduced between 27 and 34 percent.
- When maximum speed was increased from 55 mph to 60 mph (with shoulder lanes), average journey times dropped 4 percent with no increase in incidents.
- Carbon dioxide emissions and fuel consumption per vehicle reduced by 4 percent, and particulate matter emissions reduced 10 percent. These results reflect changes in individual vehicle emissions and do not consider the effects of any overall increases in traffic that may have come about as a result of the increased capacity when shoulder lanes are in operation.
|
|
Dynamic Speed Limits, Dynamic Lane Assignment, and Dynamic Shoulder Lanes
|
An assessment of noise impacts arising from implementing of "Smart Motorway" concepts along the M6 in the Birmingham area(18) showed the following:
- Reductions in road traffic noise primarily through the reduction in speed.
- Reductions in noise occurred even with an increase in throughput.
- Daily average noise levels decrease by 0.3 to 1.7 decibels.
|
|
Dynamic Junction Control
|
A junction (interchange) control system in the Netherlands,(16) in which the rightmost lane on the motorway is closed to facilitate the merging of two lanes from the ramp, provided the following mobility benefits:
- 8 percent decrease in mean travel times on ramp, and 7 percent decrease in mean travel times on the mainline.
- 13 percent decrease in vehicle hours of delay on ramp, and 4 percent decrease in vehicle hours of delay on the mainline.
|
|
Queue Warning
|
In Germany, crashes were reduced by 20 percent on an autobahn with QW, while they increased by 10 percent on a similar autobahn without QW. (16)
|
While it may not be an operational goal, per se, ATM contributes to the notion of "preservation." Constructing new lanes or roadways is no longer a sustainable strategy due in large part to the relatively high cost of these projects coupled with environmental concerns. ATM helps transportation agencies preserve and improve the performance of their transportation network by getting more use out of its current infrastructure.
-
Reliability — Linked to the mobility improvements noted above are improvements to travel time reliability. By reducing crashes and the resulting nonrecurring congestion, coupled with creating more uniformity in travel speeds and reducing shock waves, ATM strategies work toward making travel more reliable.
-
Environmental — ATM has resulted in reduced emissions and reduced noise along freeways where various strategies have been implemented.4 A related benefit and possible goal involves adaptation and resiliency to extreme weather events, helping to optimize traffic flow before severe weather (e.g., in support of evacuations) and immediately following its aftermath.
-
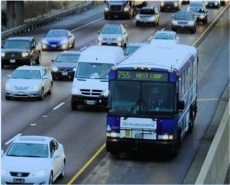
Improved transit operations — Selected ATM strategies—specifically transit signal priority, dynamic shoulder lanes when opened only to transit vehicles (also known as a bus bypass shoulder or bus on shoulder), and adaptive ramp metering that accommodates a transit by-pass lane—can help promote transit- oriented goals and objectives. Moreover, any ATM strategy that improves a facility's overall operation will also benefit transit operations.
-
Commercial vehicle operations and the economy — Improving the overall operation of a facility with significant truck traffic will help improve commercial vehicle operations. One criterion used in the United Kingdom (41) for prioritizing roadways for ATM includes improving "access to international gateways (such as London Heathrow Airport or the Port of Felixstowe) to best support the national economy." The United Kingdom has focused on these key routes to maximize benefits for freight movements as well as for motorists.
-
Livability — "Livability" can be defined as "using the quality, location, and type of transportation facilities and services available to help achieve broader community goals, such as increasing travel choices, improving economic competitiveness, and enhancing unique community characteristics."(19) Adaptive traffic signal control and transit signal priority can help local communities manage individual arterials to meet such goals. Moreover, improved transit operations can also enhance livability and the associated goal of accessibility.
Many, if not all, of these goals will likely be included in the regional transportation plan for any metropolitan area in the United States Given the extent to which ATM strategies can help promote so many regional goals, the list of potential ATM strategies likely will not be reduced much, if at all, as part of this step. That said, this initial activity can help to accomplish the following:
- Prioritize the ATM strategies based on the priorities established in the region for the transportation goals and objectives.
- Provide a strong foundation for including ATM strategies in the transportation planning process. The two Urban Partnership Agreement (UPA) sites that included ATM—Minnesota Department of Transportation (MnDOT) and Washington State Department of Transportation (WSDOT)—made this linkage between ATM and the regional goals.(3)
2.2 Identify Relevant Objectives for ATM
As shown in Figure 1, the regional goals provide a basis for developing operations objectives.
Recognizing the difference between goals and objectives is important. A goal broadly describes what the region and/or state wants to accomplish. Objectives are specific, measurable statements of performance that will lead to accomplishing the regional goals. Reference 2 (FHWA's Advancing Metropolitan Planning for Operations) emphasizes the importance of each operations objective having "SMART" characteristics (i.e., specific, measurable, agreed, realistic, and time-bound). The reference also notes that operations objectives are preferably described in terms of those system performance outcomes experienced by users (e.g., levels of congestion, crashes, travel times and delays, travel time reliability, mode choices, and access to traveler information.) The public cares about these measures, and they provide the basis for determining the extent to which the operational goals are being achieved.
Such outcome-based SMART objectives may not yet be included in the regional transportation plan or a transportation agency's list of goals and objectives. The objectives may instead be fairly generic in nature, not providing any specific or measurable parameters. If this is the case, the ATM screening process may provide an opportunity to identify ATM-related SMART objectives—aligned with the regional goals—for subsequent inclusion in the regional and/or agency transportation plans, such as those listed in Table 7 (and taken from Reference 2). Many of the ATM benefits identified in Tables 5 and 6 align with these objectives.
TABLE 7. SAMPLE OBJECTIVES FOR ACTIVE TRAFFIC MANAGEMENT (ATM)
|
Goal
|
Outcome-Oriented Objectives
|
|
Mobility
|
- Reduce the percentage of facility miles experiencing recurring congestion during the peak periods by X percent by year Y
- Increase the percent of freeway interchanges/major interchanges operating at LOS Z or better during peak periods by X percent by year Y.
- Reduce the daily hours of recurring congestion on major facilities from X to Y by year Z.
- Reduce average delay per traveler by X percent by year Y.
- Reduce the regional average travel time index by X percent per year. (Travel time index is the ratio of average peak period travel time as compared to free-flow travel time.)
|
|
Reliability
|
- Reduce total person hours of delay by time period (peak, off-peak) caused by all transient (i.e., nonrecurrent) events such as traffic incidents, special events, and work zones) by X percent in Y years.
- Decrease the average buffer index (for multiple routes, corridors, or trips) by X percent over Y years.
- Reduce the average planning time index (for specific routes or corridors) by X (no units) over the next Y years.
|
|
Safety
|
- Reduce the crash rate (per person-hours, vehicle miles of travel) by severity (e.g., fatal, serious injury), and corridor/facility type (including work zones) by X percent in Y years.
- Reduce the number of serious injuries/fatalities (statewide/regionally, by corridor/facility) by X percent in Y years.
- Reduce the number of congestion-inducing incidents occurring at freeway interchanges and ramps by X percent by year Y.
|
|
Environmental / Resiliency
|
- Reduce emissions (carbon dioxide, nitrogen oxides, carbon monoxide, and particulate matter) from vehicles and other transportation-related sources (on a corridor, region, or statewide basis) by X percent in Y years.
- Reduce the per capita time (transport-related) to evacuate Z persons in the region/state by X percent over Y years.
|
|
Economic Competitiveness
|
- Decrease the annual average travel time index for freight-significant routes by X points in Y years.
- Decrease point-to-point travel times on selected freight-significant highways by X minutes (or percent) within Y years.
- Reduce buffer index on regional freight routes during peak and off-peak periods by X percent in Y years.
|
2.2.1 Tools for Linking ATM Strategies with Goals and Objectives
This section describes two tools that are available to assist in identifying ATM strategies that can help promote regional goals and objectives—the Active Management Screening Tool and Turbo Architecture.
2.2.1.1 Active Management Screening Tool
The FHWA Office of Planning sponsored a project (20) to develop an Active Management Screening Tool (AMST) for use by those agencies that employ a CMP. The purpose of the AMST is to help those agencies better assess the potential of active management strategies for their region within the CMP. The AMST ascertains, at the appropriate screening level, major attributes about candidate corridors that help to determine whether any active management strategy is suitable and appropriate. ATM management strategies included in the tool are temporary shoulder use on freeways; speed harmonization; queue warning; ramp metering; dynamic merge control; and automated enforcement. Other strategies such as various managed lane approaches (e.g., high-occupancy vehicle (HOV), high-occupancy toll (HOT), express toll, dedicated truck, and exclusive transitways) are also included in the tool. The following three levels of detail are provided:
- Level 1: Goals — Designed for use at a high level for planning and/or general educational purposes, this level focuses primarily on introducing the broad overview of active management and descriptions of potential strategies based on broad regional goals (Refer to Table 8).
- Level 2: Objectives — Designed to provide more detail regarding potential active management strategies for a region and/or corridor of interest, this level focuses on providing active management strategy alternatives based on a refinement of broad regional goals with specific objectives. Objectives identified in the AMST are noted to be fairly generic; that is, they don't provide "SMART" characteristics as previously discussed.
- Level 3: Corridor Characteristics — Designed for users who want to rank the most appropriate active management strategies for the region and/or corridor based on specific information such as constraints and their relative weighting of the objectives.5
TABLE 8. GOALS FROM THE ACTIVE MANAGEMENT SCREENING TOOL (AMST)
| Goals
|
- Provide a reliable alternative
- Provide a transportation system that can handle current and future demand
- Increase mobility and accessibility by offering travel options
- Provide additional facility capacity
- Optimize existing capacity
- Optimize existing managed lanes capacity
- Improve congested roadways
- Enhance alternative modes of travel
|
- Modify travel demand
- Improve accessibility
- Improve the safety of corridor travel
- Maintain level of safety on a facility
- Minimize environmental impacts
- Preserve neighborhoods
- Maintain land use patterns
- Develop transportation improvements that help offset costs
- Maximize the benefit/cost ratio of investment
|
2.2.1.2 Turbo Architecture Tool
Turbo Architecture is a software application that supports development of regional and project ITS architectures using the National ITS Architecture as a starting point. Version 7 of the National ITS Architecture (21) and the associated Turbo Architecture application include a tool in the Planning Module whereby a user can select from a list of goals (Table 9) or by a key word search, and the tool will identify the relevant service packages. The selected service packages can then be linked to the associated ATM strategies. (Additional information on relevant service packages for ATM is provided in Chapter 7.)
TABLE 9. GOALS FROM THE TURBO ARCHITECTURE PLANNING MODULE
| Goals
|
- Enhance mobility, convenience, and comfort for transportation system users
- Enhance the integration and connectivity of the transportation system
- Improve the safety of the transportation system
- Improve the security of the transportation system
- Increase operational efficiency and reliability of the transportation system
- Preserve the transportation system
- Reduce environmental impacts
- Support regional economic productivity and development
|
2.2.1.3 Matrix Format
Using an established tool to ensure that a link exists between the regional goals and ATM strategies is not necessary. Knowledge of the benefits from ATM (as summarized in previous Table 5 and 6 and as available from the number of references) can be "manually" linked using a matrix relating the various ATM strategies with how well they help achieve the regional goals, operations objectives, and/or associated problem areas and needs. One such example of a potential matrix in this regard is provided in Table 10. Based on this information, an initial selection of ATM concepts and strategies can be made.
2.3 Define Network to Be Analyzed
Defining the roadway network for ATM screening is important. No criteria are provided in this regard; there is no maximum or minimum size. These guidelines have been developed so that practitioners can narrow down both geographic and functional options through succeeding steps and levels of detailed analyses. For example, if the network is quite large (e.g., a statewide analysis), then the activities discussed in Chapter 4, Identify Major Roadway Segments for Potential Active Traffic Management, may prove quite useful. If the network under consideration is relatively small, then skipping this effort and going directly to the detailed ATM strategy analyses described in Chapter 5, Analyze and Prioritize Individual Roadway Links and ATM Strategies, is possible.
2.4 Identify and Collaborate With Stakeholders
Successful ATM deployments require a well-planned, interdisciplinary collaboration with planning, operations, design, maintenance, and enforcement. Successful implementation also benefits from the following:
- High-level champions who sustain or lead a change in agency culture change to a more operations-oriented focus.
- Overcoming the “we never did this before” attitude.
- Funding and organizational commitments for adequate long-term operations and maintenance.
TABLE 10. SUMMARY OF THE EXTENT TO WHICH ACTIVE TRAFFIC MANAGEMENT (ATM) STRATEGIES MAY HELP SOLVE TRANSPORTATION ISSUES AND HELP ACHIEVE REGIONAL GOALS
|
Regional Goal
|
Issue / Consideration
|
ATM Strategiesa
|
|
Safety
|
High rate of crashes along roadway segments
|

|

|
|

|
|
|
|
|
High rate of crashes in vicinity of interchange
|
|
|
|
|
|
|
|
|
High rate of secondary crashes
|
|
|
|
|
|
|
|
|
Mobility
|
Congestion along segment during peak period
|
|
|
|
|
|
|
|
|
Congestion in vicinity of interchange
|
|
|
|
|
|
|
|
|
Reliability
|
Significant variation in average speeds
|
|
|
|
|
|
|
|
|
Significant variations in traffic flows (special events)
|
|
|
|
|
|
|
|
|
Environment
|
Nonattainment area
|
|
|
|
|
|
|
|
|
Concern with greenhouse gas emissions
|
|
|
|
|
|
|
|
|
Preservation
|
Delay need for major (and costly) capacity expansion
|
|
|
|
|
|
|
|
|
Support work zone management/alternative routes
|
|
|
|
|
|
|
|
|
Climate change adaption/ resiliency (evacuation routes)
|
|
|
|
|
|
|
|
|
Livability / accessibility
|
Delays to buses
|
|
|
|
|
|
|
|
|
“Livable Streets” (arterials)
|
|
|
|
|
|
|
|
Notes:
= major improvement; = some improvement; = neutral or not applicable
a DSpL = Dynamic Speed Limits, DLA = Dynamic Lane Assignment, DShL = Dynamic Shoulder Lane, DJC = Dynamic Junction Control, ARM = Adaptive Ramp Metering, TSP = Transit Signal Priority, ATSC = Adaptive Traffic Signal Control.
b Dynamic speed limits and dynamic lane assignment are frequently deployed together
Stakeholder education is an ongoing process, starting with the initial screening as described herein, and continuing through project funding and the various phases of the systems engineering process. Examples of likely ATM stakeholders—particularly at the beginning of the process—include state and local DOT staff (i.e., executives, operations staff, maintenance personnel, planning, and budgeting), MPOs, transit agencies, enforcement agencies and other emergency responders, FHWA, and FTA. In addition to the ongoing internal and external coordination necessary for such a project, it is also important to engage with those entities, such as elected and/or appointed officials and their staff, who approve project funding and budget and/or approve changes to rules, policies, and even legislation that may be necessary to support ATM operations. The traveling public are also important stakeholders; however, outreach and education to this stakeholder group in earnest is not recommended until after the screening process is complete and the next steps are considered.6
2.4.1 Stakeholder Education and Outreach
For stakeholders who do not have a working knowledge of ATM, implementing an education and outreach program during the early stages of the ATM effort will help build trust in the proposed investments. Such a program could be carried out as part of the screening process and used to inform stakeholders of the purposes, benefits, operation, and performance outcomes of ATM strategies, including how the ATM strategies can contribute to achieving regional goals and objectives.
During the screening process, outreach activities will likely focus on stakeholder education within the implementing agency and MPO. Following are some examples:
Peer exchanges, involving counterparts from other states or countries with ATM experience, as well as FHWA, can be very beneficial in helping to inform agency staff—be they executives, designers, operators, or enforcement—and possibly elected officials (e.g., MPO Board), of ATM benefits and convince them that implementing ATM strategies will help to improve operations and further meet the needs of the driving public (i.e., the agency's customers).
An example of this approach is the 2007 Executive Forum on Reducing Traffic Congestion — Real Opportunities from Europe and the U.S (51), sponsored by the Puget Sound Regional Council and Washington State DOT, and it included state officials and legislators, city and county officials, enforcement, along with staff from the DOT and MPO.
- Senior managers within the agency and the MPO, who are ultimately responsible for approving the budgets and funding necessary for implementing ATM and for the subsequent operations and maintenance activities, are obvious stakeholders. It is likely not a coincidence that the initial deployments of DSpL and DLA systems in this country occurred at locations (i.e., Washington and Minnesota) where agency (and in some cases MPO) officials participated in the 006 international scanning tour. Additionally, representatives from the Netherlands visited and spoke to the Virginia DOT Commissioner and Deputy Commissioner (who were initially skeptical) about the benefits of ATM.
- ATM (and other ATDM-related) strategies are based on the notion of automated operations. Transportation management center (TMC) operators may not be familiar or comfortable with such an increased level of automation and/or on the use of decision support systems. Additionally, if a region has operators who search for innovation and are on top of the latest technology, then these operators will provide valuable input into how the system can be most effective. Staff with the knowledge, skills, and abilities to effectively operate ATM strategies (as well as maintain the additional ITS equipment for ATM) is critical to success. Therefore, operators should be included in these initial outreach activities (followed, in subsequent stages of ATM deployment, by training on the procedures for effective operation.)
- System design and maintenance staff should also be involved in these agency-based outreach activities, because they, too, will have an important role to play in the ATM system.
2.4.2 Compliance-Related Outreach
The success of many ATM strategies — particularly dynamic speed limits, along with dynamic lane assignment, dynamic shoulder lanes and junction control (where lanes may be opened or closed to traffic) — depends on the extent to which drivers comply with the associated signing. Public outreach and education will, therefore, be a critical component of any ATM program. This effort typically occurs as the new signage is being considered and designed, and is not explicitly addressed in this feasibility and screening guidance; however, the costs associated with such a public education and outreach program (e.g., brochures, media spots, blogs, social media) need to be included in the preliminary ATM cost estimate as discussed in Chapter 6.
As noted in a U.K. study on Managed Motorways and ATM,(17) "We cannot prudently rely solely upon willing compliance, because our assumptions about driver behavior also rely on them understanding that there is a risk of enforcement if they do not comply. Enforcement may also be necessary to sustain compliance levels over time." Without steady and consistent enforcement presence, dynamic speed limits and lane control and other new ATM strategies likely will not be as effective in smoothing traffic flow and enhancing safety. In Europe, agencies often employ automated enforcement to ensure compliance with posted speed limits. Automated speed enforcement in the United States is still uncommon (outside of school and work zones), and there is substantial discontent for such programs by the public. Accordingly, an increased law enforcement presence will likely be needed.(4) This will require ongoing outreach and coordination with the state and local police, starting with the screening process. There are several considerations in this regard, such as the following:
- Having the legal authority for the DOT to vary speed limits.
- How the dynamic speeds (and related ATM strategies) will be enforced (regulatory or advisory), including support from law enforcement and legislative parties to enforce the ATM techniques. As an example, Oregon state law permits variable speed limits, but the system recently installed on Highway 217 in the Portland area uses speed advisories. The police had some concerns with enforcing the variable legal limits; issues included having access to all the speed displays in real time (to determine whether a driver was exceeding the speed limit) and having a record of all posted speed limits by date and time in a format that would provide a chain of evidence that would be admissible in court. Oregon has a rule regarding traveling at unsafe speeds, which will be the basis for enforcement vis-à-vis the posted advisories.
- Identifying locations where law enforcement can be safely stationed to view compliance and where noncomplying vehicles can be safely pulled over without adversely affecting traffic operations, with any additional cost for geometric changes to accommodate this included in the preliminary cost estimate.
- Procedures and supporting technologies for providing real-time information to police officers in the field about the legal limits being displayed and when the last change to the speed display was made (i.e., officers generally will not issue a citation until the new speed limit has been in place for a number of minutes) and for documenting the displayed speed limit by location and time of day in such a way that will be accepted by the courts should legal speed limits be displayed. Like other considerations noted herein, this does not impact the screening process, per se; but any associated costs should be included in the preliminary ATM cost estimate.
Enforcement staff should be brought into the discussion at the beginning of the screening process to educate them as to the operational concepts and benefits associated with ATM strategies (likely focusing on the safety and incident management benefits) and also to solicit their input and concerns. Peer exchanges with other enforcement organizations with ATM experience can help in garnering enforcement support.
2.5 Commence Data Collection
This ATM screening guidance has been developed so that collecting extensive amounts of new data will not be required. The process includes a quantitative analysis of roadway segments and links to further refine ATM strategies and priorities, but it is envisioned that this will be based
on existing data to the greatest extent possible. However, gathering and compiling this available information can take time and is, therefore, included in the “Get Started — Preparation” phase of the process. Table 11 lists these desired data. In addition to these data (as well as being potential sources of some of the information) existing documentation regarding regional goals and objectives and the performance of the transportation network should also be collected and reviewed at the beginning of the screening process. Examples of these documents include the regional and statewide long-range transportation plans, the CMP documentation, highway safety improvement plans, the regional/statewide ITS architecture, ITS strategic plan, regional concept of transportation operations, and any performance management plans.
With respect to the last item in Table 11, roadway geometry will likely impact costing and selecting ATM strategies, particularly for dynamic shoulder lanes, junction control, and ramp metering. Lane and shoulder widths, as well as the existing pavement structural capabilities, will need to be considered for implementing shoulder lanes and junction control. Additionally, ramp tapers will have to be considered when deploying shoulder lanes to verify that movements to/from ramps onto and from the mainline can be done so safely. Ramp lengths and widths will also impact the length of ramp queues during ramp metering operations, potentially requiring geometric enhancements to prevent the queues from backing up into the arterial street feeding the ramp. For those instances where widening is required, be it a ramp, shoulder, or emergency pull-out area, the physical ability to do so may be restricted because of limited right-of-way, existing infrastructure (e.g., structures associated with bridges, overpasses, tunnels, retaining walls, major utilities), and/or environmental concerns near the right-of-way.(4)
TABLE 11. DESIRED INFORMATION AND DATA FOR PRELIMINARY ACTIVE TRAFFIC MANAGEMENT (ATM) SCREENING
|
Crash data: 3 years or more of most recent information, including the following:
- Time and date of crash.
- Location of crash and direction of travel (e.g., vicinity of ramp).
- Type of crash (e.g., rear end, side swipe, head on, fixed object).
- Severity of crash (e.g., damage only, slight injury, serious injury, death).
- Classifications of vehicles involved.
- Weather conditions at time of crash.
- Primary vs. secondary crash.
|
|
Collision patterns can provide insight into not only whether ATM can reduce observed problems, but also which strategies would be best suited to the specific types of collisions occurring along various highway segments.
|
|
System performance data: Preferably by roadway link (e.g., between interchanges) and/or milepost.
- Average link speed information, speed profiles, and/or delay costs by time of day (15-minute intervals) and for different operational conditions (e.g., special events, work zones, and adverse weather). Speed profiles not only identify congested segments and bottlenecks but also those segments with significant variability in speeds, scenarios that may be improved by ATM. Speed profiles and associated performance data should ideally cover one calendar year (all days and all hours) to capture seasonal differences.
- The system performance data should allow the flexibility to isolate certain days and operational scenarios such as peak periods, major incident conditions, special events, and holidays.
|
|
Volume Data
- Volume data (volume/capacity ratios as an indication of recurrent congestion that may be helped by dynamic shoulder lanes).
- Ramp (on and off) and mainline volume data at interchanges (for determining the feasibility of junction control and ramp management strategies).
|
|
Recurring and potentially hazardous weather conditions and issues
- Frequency and locations.
- Impacts.
|
|
Transit information: For such strategies as transit signal priority and exclusive bus-on-shoulder operation.
- Bus routes and service frequency (headways per number of buses per hour).
- Type of bus service (local, express, bus rapid transit).
- Schedule reliability and/or variability.
- Number of passengers.
|
|
Air quality data: As may be available.
|
|
Ongoing and planned major roadway improvements: Such major reconstruction activities may provide a cost- effective approach for the initial implementation or expansion of ATM.
|
Existing operations and ITS assets: Freeway, arterials, and ramps.
- Current TSM&O strategies.
- Communications, power, detectors, closed-circuit television, dynamic message sign, signal control and controller types.
- Roadway mapping and geometry
|
2.6 Review Recent Literature
As previously noted, the information and recommended guidance herein was derived from an extensive review of literature coupled with interviews of several practitioners who have been involved with ATM projects. ATM, however, is an evolving set of proactive strategies, not only in the United States but also in several European countries where the practice has been established for several years, and new information is always being obtained, compiled, and published. FHWA, therefore, recommends that the practitioner determine whether any new approaches and recommendations have come to light that might impact or otherwise influence the ATM decisions resulting from this Guide.
|