Office of Operations
21st Century Operations Using 21st Century Technologies

Active Traffic Management Feasibility and Screening Guide

Chapter 1. Introduction and Background

1.1 Purpose of this Document

TABLE 1. OVERVIEW OF ACTIVE TRAFFIC MANAGEMENT (ATM) FEASIBILITY AND SCREENING PROCESS
Get Started: Preparation
  • Ensure ATM supports regional goals
  • Identify relevant objectives for ATM
  • Define network to be analyzed
  • Identify and collaborate with stakeholders
  • Commence data collection
  • Review recent literature
Assess Agency Policies and Capabilities for ATM
  • Define applicable ATM strategies in terms of network features, project scope, agency policies, and legal considerations
  • Confirm supporting institutional framework is in place
Identify Major Roadway Segments for Potential ATM
  • Determine level of TSM&O deployment along segments. Consider other TSM&O strategies in lieu of ATM as appropriate
  • Identify major segments that will likely benefit from deploying ATM, based on congestion, crash rates, bottlenecks, and other considerations
Analyze and Prioritize Individual Roadway Links and ATM Strategies
  • Analyze and prioritize individual links for ATM deployment
  • Determine appropriate ATM strategies for each link
  • Combine strategies for each link and ensure compatibility across the network.
Estimate Benefits and Costs
  • Consider key ATM cost factors
  • Perform high-level estimates of benefits and costs using available tools

Active Traffic Management (ATM) concepts, strategies, and supporting technologies have been receiving significant attention of late, given the potential operational benefits that have and can potentially accrue from deploying these strategies. Implementing these ATM concepts and strategies can also involve significant capital costs, followed by ongoing operations and maintenance requirements. As such, some or all ATM strategies may not be cost effective for certain segments and links of the surface transportation network. The Federal Highway Administration (FHWA) has developed this Active Traffic Management Feasibility and Screening Guide (the Guide) to assist transportation agencies and planning organizations with making informed investment decisions regarding ATM by determining the feasibility of ATM strategies before committing significant resources towards any subsequent project development and design activities. This Guide presents a recommended process—a series of steps summarized in Table 1—for agencies to follow as they consider ATM deployment at the feasibility and screening analyses level. At the end of the process, practitioners will be able to answer the following questions with reasonable confidence:

  • What roadway networks and facilities would be best suited for ATM in my region?
  • What specific or combination of ATM strategies would work best?
  • What would be the range of expected benefits?
  • What would be the expected costs (capital and ongoing)?

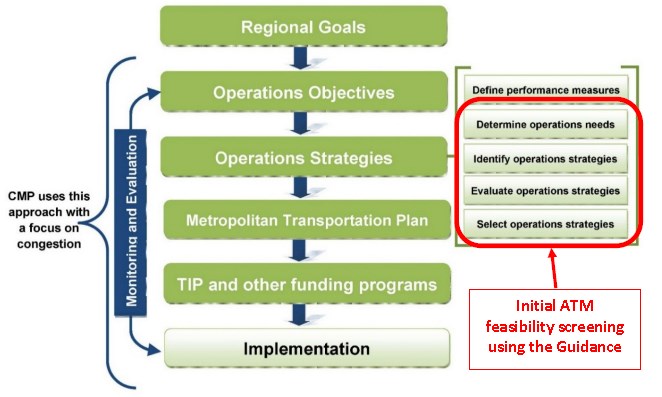
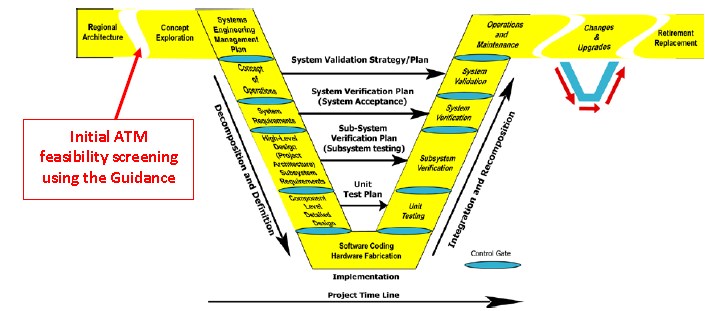
With the answers to these questions in hand, agencies can then develop and define specific ATM projects for implementation that are also aligned with their region's needs, goals, objectives, and the overall metropolitan transportation planning process. The results from the applying the Guide can also set the stage for performing more detailed analyses in accordance with the principles of systems engineering (e.g., develop a Concept of Operations). Perhaps most importantly, the results from applying this guidance can help an agency (or agencies) make a business case to managers and decision-makers of the value of applying ATM in their region.

1.2 Context of ATM Feasibility and Screening Guidance

The ATM feasibility and screening guidance provided herein should not be viewed as a stand- alone exercise but rather as an integral part of other established processes, particularly the metropolitan transportation planning process and the systems engineering process as summarized below.

The guidance can be used to define an ATM program as part of the metropolitan transportation planning process, including identifying ATM projects as part of a long-range transportation plan update or regional or statewide transportation improvement plans. The FHWA and the Federal Transit Administration (FTA) promote using an "objectives-driven, performance-based approach to planning for operations" as an effective way to integrate transportation systems management and operations (TSM&O) into metropolitan transportation plans (MTPs) and the congestion management process (CMP). This approach includes the activities and elements shown in Figure 1, with several of the activities highlighted in the red box addressed as part of the ATM feasibility and screening process. These activities are based on the regional goals and operations objectives. Moreover, the ATM screening activities may identify additional outcome-based objectives, which also can be used to develop relevant performance measures for ATM, for inclusion in the regional transportation plans.

The guidance can be used to explore ATM concepts as part of the systems engineering process (i.e., the "Concept Exploration" step as shown in Figure 2), providing information to include in a Concept of Operations for an ATM project. This information may include, but not be limited to, the goals and objectives of the proposed ATM system, the system stakeholders, the ATM strategies to be deployed and the specific roadway segments, and preliminary spacing and layout of ATM signage. The guidance activities also support developing performance measures and a public outreach strategy.

A flow chart of the Objectives-Driven, Performance-Based Approach for Metropolitan Planning for Operation, starting with Regional Goals, and proceeding to Operations Objective, Operations Strategies, Metropolitan Transportation Plan, TIP and other Transportation Funding, and concluding with Implementation. The flow chart shows several activities associated with the Operations Strategies step, including Determine Operations Needs, Identify Operations Strategies, Evaluate Operations Strategies, and Select Operations Strategies.

FIGURE 1. DIAGRAM. AN OBJECTIVES-DRIVEN, PERFORMANCE-BASED APPROACH FOR METROPOLITAN PLANNING FOR OPERATIONS (2)

The Systems Engineering Vee Diagram showing the various stages of the systems engineering process; including that the initial Active Traffic Management screening as addressed in the Guide, is part of the Concept Exploration step of the Systems Engineering process.

FIGURE 2. DIAGRAM. SYSTEMS ENGINEERING VEE DIAGRAM (24)

1.3 How to Use the Guidance

TABLE 2. ACRONYMS USED FOR ACTIVE TRAFFIC MANAGEMENT (ATM) STRATEGIES ADDRESSED IN THIS GUIDANCE
  • ARM—Adaptive Ramp Metering
  • ATSC—Adaptive Traffic Signal Control
  • DJC—Dynamic Junction Control
  • DLA—Dynamic Lane Assignment (or Dynamic Lane Use Control)
  • DLR—Dynamic Lane Reversal
  • DMC—Dynamic Merge Control
  • DShL—Dynamic Shoulder Lane
  • DSpL—Dynamic Speed Limit
  • QW—Queue Warning
  • TSP—Transit Signal Priority

This Guide is intended for operations, engineering, and planning staff from local and state departments of transportation (DOTs), metropolitan planning organizations (MPOs), transit agencies, and other transportation and regional entities, universities, and consultants who are interested in deploying, or supporting the deployment of, one or more ATM strategies and need some background information on ATM and guidance for identifying which combinations of strategies and locations would likely result in the greatest operational benefits in the most cost-effective manner. The guidance has been developed to allow the screening process to be carried out in a short time with minimal costs, assuming basic operations data are available for the roadway network being considered.

In addition to supporting the planning and systems engineering processes as previously discussed, the guidance may also be used to structure an ATM feasibility and screening workshop, including agenda items and presentation materials, to go through many of the steps and activities discussed herein. The guidance may also be used as the basis for a scope of services and request for proposals for the screening to be performed by others.

Overall, the process explained in this guidance was designed to be flexible and used in a variety of formats. As previously noted, it can be completed either in-house by agency staff, a regional planning entity, or contracted out to be performed by others. It can be completed as an informal 1-day workshop or as a more formal study with a project sponsor and guided by a diverse group of stakeholders. It can be completed within the context of the planning process or within the project development process (at the beginning of systems engineering). However the process is used, the bottom line is that it can help an agency make a business case to managers and decision-makers of the value of applying ATM concepts in their region.

This Guide is based on an extensive review of literature as listed in Appendix A,1 coupled with interviews with several practitioners who have been directly involved in the feasibility analyses, design, deployment, and/or operation of ATM strategies (also listed in Appendix A). The amount of information and guidance provided herein differs depending on the specific ATM strategy being addressed. More guidance is provided for such strategies as dynamic speed limit (DSpL), dynamic lane assignment (DLA), queue warning (QW), dynamic shoulder lane (DShL), dynamic junction control (DJC), dynamic lane reversal (DLR) and dynamic merge control (DMC), which are relatively new to the TSM&O community within the United States, as compared with the information provided for adaptive ramp metering (ARM), adaptive traffic signal control (ATSC), and transit signal priority (TSP) for which thorough documentation and guidance documents already exist (and are referenced herein). Flowcharts showing a sequence of decision points are provided throughout the document to aid in the screening process. Table 2 lists the acronyms for the various ATM strategies frequently used in this Guide.

1.4 Overview of ATM Feasibility and Screening Process

Table 3 provides an overview of the ATM feasibility and screening process, along with the relevant chapter in this Guide for each step. An ATM feasibility and screening checklist is provided in Appendix B that can be used by practitioners to track and document their progress in working through the process. The process steps and activities described in the subsequent chapters are not intended as a rigid step-by-step approach. Instead, practitioners can combine or skip steps as appropriate. Moreover, some of the approaches and factors identified and the levels of detail presented herein may not always be relevant to each practitioner's specific situation. Practitioners should always keep in mind that the primary purpose of this Guide is to allow them to develop preliminary recommendations about which ATM strategies are most appropriate for their operational conditions, prioritize where these strategies should be deployed, and make these informed decisions with a minimum of effort and time.

The final chapter of this Guide (Chapter 7) discusses a few of the "next steps" after the optimum ATM strategies and locations have been identified. Which of these next steps are undertaken, and when, will depend on the context in which the screening has occurred—for example, whether the results of the screening are the start of the systems engineering process, are to identify an ATM program and specific projects as part of the planning and programming processes, or perhaps some combination. Specific "next steps" include continuing the stakeholder outreach process (including public education), developing performance measures, ensuring conformance with the regional Intelligent Transportation System (ITS) architecture, and regulatory considerations (e.g., Manual on Uniform Traffic Control Devices [MUTCD]).

TABLE 3. ACTIVE TRAFFIC MANAGEMENT (ATM) FEASIBILITY AND SCREENING GUIDANCE: PROCESS STEPS, ACTIVITIES, AND EXAMPLE APPLICATION
Steps and Activities Example Application (Graphical View)
Get Started — Preparation Chapter 2

Stick map of a generic roadway network, and a list of all Active Traffic Management strategies addressed in the Guide.

Graphic shows a generic roadway network and all available ATM strategies.

Ensure ATM supports regional goals. 2.1
Identify relevant objectives for ATM. 2.2
Define network to be analyzed. 2.3
Identify and collaborate with stakeholders. 2.4
Commence data collection. 2.5
Review recent literature. 2.6
Assess Agency Policies and Capabilities for Active Traffic Management Chapter 3

Stick map of a generic roadway network, and a list of those Active Traffic Management strategies applicable to the roadway network and in conformance with the agency's policies.

In the graphic, strategies "A" and "T" are not appropriate to the agency's transportation network (i.e., freeway), and strategy “R” does not conform to agency's policies.

Define applicable ATM strategies in terms of network features, project scope, agency policies, and legal considerations. 3.1
Confirm supporting institutional framework is in place. 3.2
Identify Major Roadway Segments for Potential ATM Chapter 4

Stick map of a generic roadway network, with segments identified as blue dashes being less likely to benefit from Active Traffic Management strategies relative to other segments.

In the graphic, the blue dashed segments are less likely to benefit from ATM, possibly due to fewer mobility and/or safety issues relative to the other segments, the lack of other TSM&O strategies along these segments, or some combination.

Determine level of transportation systems management and operations (TSM&O) deployment along segments; consider other TSM&O strategies in lieu of ATM as appropriate. 4.1
Identify major segments that will likely benefit from deploying ATM, based on congestion, crash rates, bottlenecks, and other considerations. 4.2, 4.3, and 4.4
Analyze and Prioritize Individual Roadway Links and ATM Strategies Chapter 5

Stick map of a generic roadway network showing the recommended active traffic management strategies for specific roadway segments and locations.

In the graphic, strategies "L," "D," and "Q" are recommended for links shown in "green," with strategy "S" also included for those links with "red" arrows. Circles indicate locations for "J."

Analyze and prioritize individual links for ATM deployment. 5.1
Determine appropriate ATM strategies for each link.

  • DSpL/DLA
  • QW
  • DShL
  • DJC
  • ARM
  • ATSC
  • TSP
  • DLR
  • DMC
5.2-5.10

  • 5.2
  • 5.3
  • 5.4
  • 5.5
  • 5.6
  • 5.7
  • 5.8
  • 5.9
  • 5.10
Combine strategies for each link and ensure compatibility across the network. 5.11
Estimate Benefits and Costs Chapter 6

Baseline stick map of a generic roadway network showing those segments and Active Traffic Management strategies that are the highest priority for implementation based on an analysis of costs and benefits.

In the graphic, those segments outlined in yellow provide the greatest estimated benefit/cost ratios and are, therefore, the highest priority for moving ATM forward.

Consider key ATM cost factors. 6.1
Perform high-level estimates of benefits and costs using available tools. 6.2

1.5 Overview of ATM Strategies

ATM is defined on the FHWA website as follows (1)

"The ability to dynamically manage recurrent and non-recurrent congestion based on prevailing and predicted traffic conditions. Focusing on trip reliability, it maximizes the effectiveness and efficiency of the facility. It increases throughput and safety through the use of integrated systems with new technology, including the automation of dynamic deployment to optimize performance quickly and without delay that occurs when operators must deploy operational strategies manually. ATM approaches focus on influencing travel behavior with respect to lane/facility choices and operations."

Table 4 defines the ATM strategies covered in this Guide, with the strategies listed in alphabetical order.
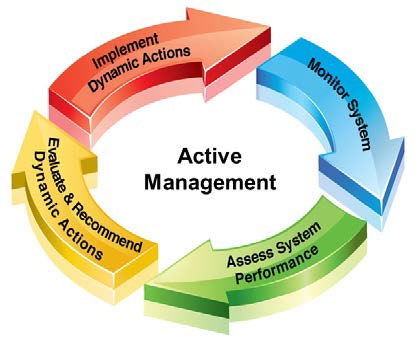
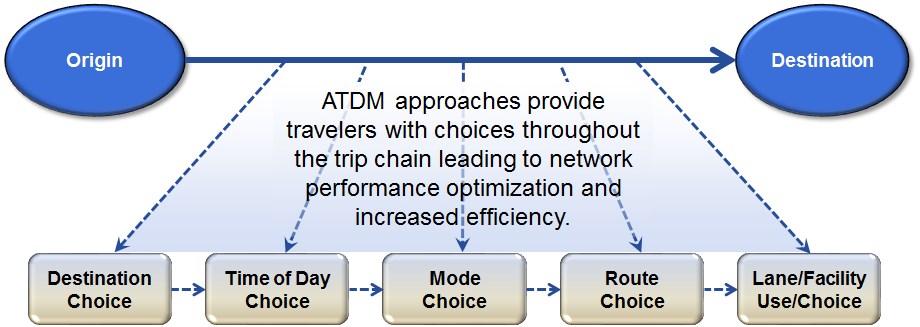
TABLE 4. ACTIVE TRAFFIC MANAGEMENT (ATM) STRATEGIES (1)
ATM Strategy Photographic Representation
Adaptive Ramp Metering (ARM) — This strategy consists of deploying traffic signal(s) on ramps to dynamically control the rate vehicles enter a freeway facility. ARM uses traffic responsive or adaptive algorithms (as opposed to local traffic responsive or fixed-time rates) that can optimize either local or systemwide conditions. This, in essence, smooths the flow of traffic onto the mainline, allowing efficient use of existing freeway capacity.

Picture of ramp meter installation

(Source: Pennsylvania DOT)

Adaptive Traffic Signal Control (ATSC) — This strategy continuously monitors arterial traffic conditions and the queuing at intersections and dynamically adjusts the signal timing to smooth the flow of traffic along coordinated routes and to optimize one or more operational objectives (such as minimize overall stops and delays or maximize green bands). ATSC approaches typically monitor traffic flows and modifies specific timing parameters to achieve operational objectives.

Picture of arterial with several signalized intersections.

(Source: ITE)

Dynamic Junction Control (DJC) — This strategy consists of dynamically allocating lane access on mainline and ramp lanes in interchange areas where high traffic volumes are present, and the relative demand on the mainline and ramps change throughout the day. For off- ramp locations, this may consist of assigning lanes dynamically either for through movements, shared through-exit movements, or exit-only. For on-ramp locations, this may involve a dynamic lane reduction on the mainline upstream of a high-volume entrance ramp.

Diagram of an example of junction control operation, using dynamic lane control signs to provide a two-lane on ramp with the left lane on the mainline closed to accommodate the additional ramp traffic.

(Source: Reference 31)

Dynamic Lane Assignment (DLA) — This strategy, also known as dynamic lane use control, involves dynamically closing or opening of individual traffic lanes as warranted and providing advance warning of the closure(s), typically through dynamic lane control signs, to safely merge traffic into adjoining lanes. DLA is often installed in conjunction with dynamic speed limits and also supports the ATM strategies of DShL and DJC.

Picture (a mock up) of dynamic lane assignment, with dynamic message signs over each lane displaying green arrows or yellow diagonal arrows instructing traffic to merge out of those lanes.

(Source: Washington State DOT)

Dynamic Lane Reversal (DLR) — This strategy, also known as or contraflow lane reversal, involves, consists of the reversal of lanes in order to dynamically allocate the capacity of congested roads, thereby allowing capacity to better match traffic demand throughout the day.

Picture of reversible lane, with left lane along a freeway closed to accommodate buses travelling in the opposite direction.

(Source: New York State DOT)

Dynamic Merge Control (DMC) — This strategy, also known as dynamic late merge or dynamic early merge, consists of dynamically managing the entry of vehicles into merge areas with a series of advisory messages approaching the merge point that prepare motorists for an upcoming merge and encouraging or directing a consistent merging behavior. Applied conditionally during congested (or near congested) conditions, such as a work zone, DMC can help create or maintain safe merging gaps and reduce shockwaves upstream of merge points.

Picture of portable message sign with beacons in a work zone indicating 'Do Not Pass When Flashing.'

(Source: Michigan DOT)

Dynamic Shoulder Lane (DShL) — This strategy, which has also been called hard shoulder running or temporary shoulder use, allows drivers to use the shoulder as a travel lane(s) based on congestion levels during peak periods and in response to incidents or other conditions as warranted during nonpeak periods. This strategy is frequently implemented in conjunction with DSpL and DLA. This strategy may also be used as a managed lane (e.g., opening the shoulder as temporary bus-only lane).

Picture of shoulder lane, including fixed signage indicating that the shoulder lane may be used at specific times and days of the week, and a dynamic lane control sign over the shoulder for displaying a red X or green arrow.

(Source: Virginia DOT)

Dynamic Speed Limit (DSpL) — This strategy, which has also been called variable speed limit, adjusts speed limit displays based on real-time traffic, roadway, and/or weather conditions. DSpL can either be enforceable (regulatory) speed limits or recommended speed advisories, and they can be applied to an entire roadway segment or individual lanes. This "smoothing" process helps minimize the differences between the lowest and highest vehicle speeds.

Picture (a mock up) of dynamic speed limits dynamic message signs over each lane displaying 'speed limit 50.'

(Source: Washington State DOT)

Queue Warning (QW) — This strategy involves real-time displays of warning messages (typically on dynamic message signs and possibly coupled with flashing lights) along a roadway to alert motorists that queues or significant slowdowns are ahead, thus reducing rear-end crashes and improving safety. QW may be included as part of DSpL and DLA strategies.

Picture of dynamic message sign indicating congestion ahead and traffic heading to Route 435 should use Exit 69.

( Source: Missouri DOT)

Transit Signal Priority (TSP) — This strategy manages traffic signals by using sensors or probe vehicle technology to detect when a bus nears a signal controlled intersection, turning the traffic signals to green sooner or extending the green phase, thereby allowing the bus to pass through more quickly and help maintain scheduled transit vehicle headways and overall schedule adherence.

Picture of an arterial street with exclusive bus lane to the right with a different color pavement.

(Source: New York City Transit)

1.6 ATM in the Context of ATDM

ATM is an integral component of a broader concept known as Active Transportation and Demand Management (ATDM; Figure 3), which FHWA defines as follows (1)

"…[the] dynamic management, control, and influence of travel demand, traffic demand, and traffic flow of transportation facilities. Through ATDM, regions attain the capability to monitor, control, and influence travel, traffic, and facility demand of the entire transportation system and over a traveler's entire trip chain."

Diagram of Active Management activities: Monitor Systems, which leads into Assess System Performance, leading to Evaluate and Recommend Dynamic Actions, leading to Implement Dynamic Actions, which leads back to Monitor Systems.

FIGURE 3. DIAGRAM. ACTIVE TRANSPORTATION AND DEMAND MANAGEMENT (ATDM) CONTEXT AND ACTIVITIES

This trip chain includes the following activities as described below and shown in Figure 4:

Graphic representation of trip chain from origin to destination, identify the various traveler choices including destination time of day, mode, route, and lane / facility.

FIGURE 4. DIAGRAM. ACTIVE TRANSPORTATION AND DEMAND MANAGEMENT (ATDM) AND THE TRIP CHAIN

  • Before and/or at the beginning of the trip via Active Demand Management (ADM) strategies and concepts (e.g., dynamic ride sharing, multimodal and comparative traveler information, and dynamic pricing) to reduce or redistribute travel demand to alternate modes, routes, or departure times.
  • At the end of the trip via Active Parking Management (APM) strategies and concepts (e.g., dynamic parking pricing and real-time parking availability information) to affect the demand, distribution, availability, and management of parking.
  • During the trip via ATM strategies and concepts as discussed in this Guide.

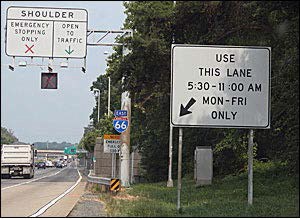
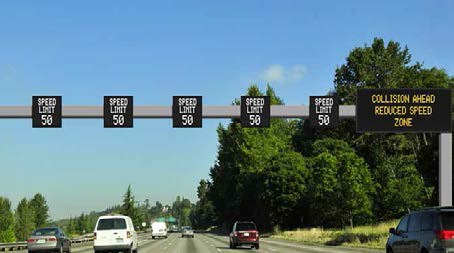
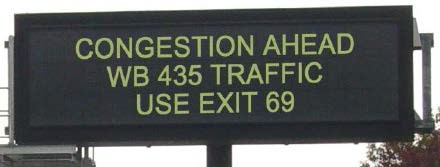
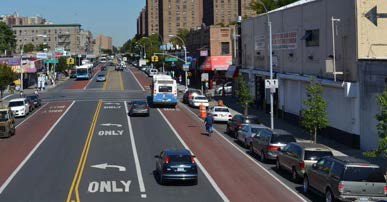
Active management needs to occur before, during, and at the end of the trip chain. Also, while the focus of this Guide is on ATM strategies and concepts applied during the trip, users should keep in mind that these ATM strategies can work synergistically with ADM and APM concepts. Consideration should, therefore, be given when applying the Guidance to roadway segments with parallel ADM and/or APM efforts and how such efforts might work in concert with the ATM recommendations identified during the this feasibility and screening process. In an ATDM context, ATM involves using available technology to make changes proactively before conditions warrant them versus in reaction to them (or merely on a recurring time-of- day schedule)—in other words, to make the operation of these strategies truly "dynamic." Following are some examples (1)

  • Adaptive Ramp Metering—With an ATDM approach, real-time and anticipated traffic volumes on the freeway facility and ramps, and possibly the parallel arterial streets, are used to dynamically control the rate of vehicles entering the freeway facility.
  • Dynamic Junction Control—With an ATDM approach, volumes on the mainline lanes and ramps are continuously monitored, and lane access is dynamically changed based on the real-time and anticipated conditions.
  • Dynamic Lane Assignment—With an ATDM approach, the network is continuously monitored, and real-time incident data and predicted congestion information are used to control the lane use ahead of lane closures and dynamically manage the lane closure process to reduce rear-end and other secondary crashes.
  • Dynamic Shoulder Lanes—With an ATDM approach, real-time and anticipated congestion levels are used to determine the need for using a shoulder lane as a regular or special purpose travel lane (e.g., transit only), instead of a fixed time-of-day schedule for using the shoulder for a travel lane.
  • Dynamic Speed Limits—With an ATDM approach, real-time and predicted traffic conditions are used to adjust the speed limits dynamically to meet an agency's goals and objectives for safety, mobility, and environmental impacts.
  • Queue Warning—With an ATDM approach, the traffic conditions are monitored continuously, and the warning messages are dynamic based on the location and severity of the queues and slowdowns.
  • Transit Signal Priority—With an ATDM approach, current and predicted traffic congestion, multiagency bus schedule adherence information, and number of passengers affected may all be considered to determine conditionally if, where, and when TSP may be applied.

1 Literature reviewed in preparation for this Guide are listed in Appendix A and cited in the text via parentheses; for example "(reference number from Appendix A)."

Office of Operations