Travel and Emissions Impacts of Highway Operations Strategies
Chapter 1. Introduction
Purpose of the Study
This research project addressed the short- and long-term impact of highway operations strategies on travel and emissions. Operations strategies are aimed at reducing congestion and improving safety without major physical expansion of highways. Strategies of particular interest to the profession include signal timing, ramp metering, traffic incident management, congestion pricing, and active traffic and demand management strategies such as speed harmonization, queue warning, and lane management. Key research questions addressed include:
- The extent to which highway operations strategies affect throughput, travel delay, and travel-time reliability.
- The extent to which these improved travel conditions result in demand changes, in both the short term and long term.
- The system-level traffic flow and emissions impacts of these projects, after accounting for demand changes, including the production of both criteria pollutants and greenhouse gases.
Assessing the long-term emission impacts of operations strategies is a unique aspect of the project, and much of the effort was devoted to this component.
Organization of this Report
In the remainder of the Introduction, we discuss the project background, list other reports and technical papers produced from the project, and the overall study approach. The remaining chapters are:
- Chapter 2: Current Knowledge Base – a traditional literature review was conducted for the study. Additionally, three white papers also were developed on:
- The operations versus new capacity impacts of changes in travel-time reliability, average travel time, and monetary travel cost on travel behavior.
- Implications of induced demand for estimating impacts and social/user benefits (acknowledging geographic and temporal considerations).
- The effect of accessibility on land use patterns.
- Chapter 3: Atlanta Case Study: Demand Effects of Operational Improvements – a before/after study of the effect of ramp metering and incident management in the Atlanta metropolitan area is undertaken.
- Chapter 4: Impact of Travel-Time Reliability on Real Estate Markets – original research and testing of the effect of reliability on land use patterns.
- Chapter 5: Near-Term Emissions Impacts of Operations Strategies – a microscopic traffic simulation model in a real-world setting is linked to the MOVES emission model to estimate the impacts of operations.
- Chapter 6: Long-Term Regional Impacts of Operations Strategies – the Bay Area activity-based travel demand model is linked to a land use model capable of accounting for reliability.
- Chapter 7: Conclusions and Recommendations.
Background to the Issues: Operations Strategies, Demand, and Emissions
This chapter provides an overview of the major issues dealt with by this project. Chapter 2 provides a more thorough discussion of the issues.
Operations strategies are highly cost-effective strategies for addressing congestion and safety problems. Compared to capacity expansion projects (new highways or additional lanes), their cost is low and the fact that they work within existing rights-of-way means that their environmental footprint is minimal and they can be implemented quickly. Rapid project turnaround is a major benefit of operations strategies because not only do benefits start accruing immediately and lengthy and distressful work zones are avoided, but the public sees that agencies are dealing with current problems. Further, many operations strategies deal with disruptions on the roadway system – incidents, inclement weather, work zones, and special events – which are not only highly visible and a source of frustration to travelers, but contribute substantially to both total congestion and the unreliability of travel.
In the past several years, transportation strategies of all kinds have come under increased scrutiny due to heightened concern for air quality and especially for the climate change potential of greenhouse gas (GHG), a major by-product of the fossil fuels consumed by the major of on-road vehicles. With regard to operations improvements, two primary issues are at the heart of this scrutiny:
- Demand Effects – Does reducing congestion by deploying operations strategies lead to increased traveler use of the improved facility and to more highway trip-making in general?
- Emissions Impacts – How do operations strategies affect vehicular emissions, both with and without considering demand effects (shifts)? Is the demand effect great enough to wipe out short-term emissions gains?
With regard to demand effects, there are several possible reactions that transportation users may have to a change in travel conditions:
- Change route of travel.
- Change time of day of travel.
- Change mode of travel.
- Change destination of travel.
- Change amount of travel (new trips by existing and new users that would not have occurred without the change in travel conditions).
The length of trips may be affected by all of these, especially the last two. Only the last one of these reactions is actually a change in the level of demand (induced traffic if the change is an increase in trips, and suppression of travel if the change is a reduction). The other reactions result in diverted trips, but if it is highway trips we seek, diversion from other routes, modes, and times must be considered as induced travel. For example, highway vehicle-miles of travel (VMT) will be increased if trips that formerly took transit now use autos. In theory, then, when a change is made to travel conditions, a range of possible results can occur, in which traffic is diverted away from a facility that has high travel times to a facility that has lower travel times. A combination of diversion and either induced or suppressed travel is what will give rise to changed volumes on the facility that has experienced the change.
In the past decade, increasing attention has been placed by the transportation profession on highway operations strategies as means to reduce congestion and improve safety. However, because these strategies are relatively new and are constantly evolving, little practice experience in determining their impacts has been gained. The Moving Cooler report (Cambridge Systematics, Moving Cooler: An Analysis of Transportation Strategies for Reducing Greenhouse Gas Emissions, Urban Land Institute (publisher), July 2009) brought the issue of induced demand to the forefront of national attention. For Moving Cooler, the short- and long-run elasticities developed for FHWA’s Highway Economic Requirements System (HERS) were used for all improvements that were not aimed directly at VMT reduction. For operations strategies, delay reduction was first estimated using technical relationships from a variety of sources, including the ITS Deployment Analysis System (IDAS) and recent literature for newer types of strategies (e.g., Active Traffic Management, ATM) (These relationships are the same as used in the HERS Operations Pre-Processor: Appendix A: Highway Investment Analysis Methodology).
However, when the HERS elasticities were applied, the savings were drastically reduced because of (estimated) higher induced demand. The Moving Cooler analysis used the HERS elasticities for operations strategies so that the results across all non-VMT reduction strategies could be considered and to be consistent with FHWA’s Biennial Condition and Performance Report to Congress, which uses the HERS model. However, there is a huge amount of uncertainty surrounding the application of elasticities to operations strategies:
- Should short-run elasticities be used at all? If existing trips are diverted to an improved facility, presumably they are coming from already congested facilities or time periods. This means that travelers on the original facilities benefit, but this benefit is not accounted for in the elasticity.
- Should elasticities be applied unadjusted to a project-level analysis? Elasticities are generally developed from systemwide observations on travel changes, and thus are applicable to the entire trip. However, travel on an improved highway chapter only represents a fraction of the entire trip.
Is traveler response to operations improvements the same as for traditional capacity expansion projects? Past studies on induced demand/travel do not distinguish the type of improvements that produced changes in travel time. However, in those data, it is likely that reductions in travel times are primarily due to capacity expansion. The travel-time savings from operations improvements are more modest – do these elicit the same response or is there an “inertia” that has to be overcome before travelers respond? That is, is traveler response truly a continuous function, or is it more stepwise, in which travelers respond to large increments of travel time? Further, is the response to strategies that deal with nonrecurring congestion – which is only present when disruptions take place – different from those that deal with recurring congestion, which occurs every peak period? In other words, does the infrequency of nonrecurring events (relative to recurring ones) cause less of a behavioral shift?
This study was undertaken to address these issues. Specifically, the long-term effects of demand changes caused by implementing operations strategies was a major component of the study. With the exception of NCHRP Project 535, no other previous study has attempted to deal with the long-term effects of operational improvements (Dowling, Richard et al., “Predicting Air Quality Effects of Traffic-Flow Improvements: Final Report and User’s Guide,” National Cooperative Highway Research Program Report 535, 2005).
Study Approach
The project team and FHWA personnel spent a good deal of time refining the study approach. We investigated several options, including: empirical before/after analyses; longitudinal and cross-sectional survey analyses; and running experiments with advanced modeling frameworks. Table 1 shows the options that were considered.
Table 1. Types of analyses and experiments considered for the study.
| Type of Analysis |
Models or Data to be Used (“L03” means the data was originally used for SHRP 2 Project L03; additional data for the “after” condition will need to be collected.) |
Priority |
Elasticity Estimation – Type of Induced Demand Effect |
Elasticity Estimation – Expected Results |
Limitations |
| Facility-Specific: Empirical Before/After – Time series analysis with control sections |
Atlanta: ramp meters, incident management, HOT lanes (L03) |
Medium/High |
Short |
Short- and long-term elasticities. These also provide travel time and reliability impacts in addition to demand changes. |
VMT/demand changes due to a combination of factors in addition to any induced effect (especially economic conditions) |
| Facility-Specific: Empirical Before/After – Time series analysis with control sections |
Atlanta: arterial management RTOP |
Medium/High |
Short |
Short- and long-term elasticities. These also provide travel time and reliability impacts in addition to demand changes. |
VMT/demand changes due to a combination of factors in addition to any induced effect (especially economic conditions) |
| Facility-Specific: Empirical Before/After – Time series analysis with control sections |
Seattle: ATM deployment |
Medium/High |
Short |
Short- and long-term elasticities. These also provide travel time and reliability impacts in addition to demand changes. |
VMT/demand changes due to a combination of factors in addition to any induced effect (especially economic conditions) |
| Facility-Specific: Empirical Before/After – Time series analysis with control sections |
Seattle: ramp metering (L03) |
Medium/High |
Short |
Short- and long-term elasticities. These also provide travel time and reliability impacts in addition to demand changes. |
VMT/demand changes due to a combination of factors in addition to any induced effect (especially economic conditions) |
| Facility-Specific: Empirical Before/After – Time series analysis with control sections |
Minneapolis: HOT lanes |
Medium/High |
Short |
Short- and long-term elasticities. These also provide travel time and reliability impacts in addition to demand changes. |
VMT/demand changes due to a combination of factors in addition to any induced effect (especially economic conditions) |
| Facility-Specific: Empirical Before/After – Time series analysis with control sections |
Minneapolis: capacity expansion (L03) |
Medium/High |
 |
Short- and long-term elasticities. These also provide travel time and reliability impacts in addition to demand changes. |
VMT/demand changes due to a combination of factors in addition to any induced effect (especially economic conditions) |
| Facility-Specific: Empirical Before/After – Time series analysis with control sections |
San Diego: ICM |
Medium/High |
Short |
Short- and long-term elasticities. These also provide travel time and reliability impacts in addition to demand changes. |
VMT/demand changes due to a combination of factors in addition to any induced effect (especially economic conditions) |
| Facility-Specific: Empirical Before/After – Time series analysis with control sections |
San Diego: incident management (L03) |
Medium/High |
Short |
Short- and long-term elasticities. These also provide travel time and reliability impacts in addition to demand changes. |
VMT/demand changes due to a combination of factors in addition to any induced effect (especially economic conditions) |
| Facility-Specific: Empirical Before/After – Time series analysis with control sections |
Miami: ramp meters and express lanes |
Medium/High |
Short |
Short- and long-term elasticities. These also provide travel time and reliability impacts in addition to demand changes. |
VMT/demand changes due to a combination of factors in addition to any induced effect (especially economic conditions) |
| Facility-Specific: Empirical Before/After – Time series analysis with control sections |
Orlando: VSL |
Medium/High |
Short |
Short- and long-term elasticities. These also provide travel time and reliability impacts in addition to demand changes. |
VMT/demand changes due to a combination of factors in addition to any induced effect (especially economic conditions) |
| Facility-Specific: Empirical Before/After – Time series analysis with control sections |
D.C.: hard shoulder running |
Medium/High |
Short |
Short- and long-term elasticities. These also provide travel time and reliability impacts in addition to demand changes. |
VMT/demand changes due to a combination of factors in addition to any induced effect (especially economic conditions) |
| Travel Demand Model Experiments |
San Diego (SANDAG) model |
Medium |
Short |
Demand shifts due to destination change and diversion from other facilities; network-level congestion effect of operations improvements on a facility. |
Transferability to other network typologies |
| Simulation Model Experiments |
San Diego (I‑15); Transmodeler |
Medium |
Short |
Demand shifts due to diversion; effect of traveler information. |
Transferability to other network typologies |
| Disaggregate Analysis: Experimental Economics |
Berkeley XLAB |
High |
Both |
Increased trip-making; Workplace and residential location. |
Essentially a sophisticated form of a stated-preference survey; transferability of results to general population; extra costs involved |
| Activity Model Experiments |
SHRP 2 C10 (B) modeling framework (PECAS) → SACSIM → DynusT |
High |
Both |
Full range of induced travel behaviors. |
Land use component (PECAS) outside scope of C10 – will require effort by SACOG staff |
| Traveler Survey Analysis – Disaggregate Analysis, Longitudinal |
ICM Survey (Dallas and San Diego) |
High |
Short |
Traveler behavior changes due to operations strategies (including new and longer trips). |
Stated-preferences can be different from real-world activity |
| Traveler Survey Analysis – Disaggregate Analysis, Longitudinal |
UPA Survey (Atlanta) |
High |
Short |
Traveler behavior changes due to pricing (including new and longer trips). |
Stated-preferences can be different from real-world activity |
| Traveler Survey Analysis – Disaggregate Analysis, Cross-Sectional |
NHTS (2009) |
Low |
Both |
Update of Barr and Cohen analyses; add simultaneous modeling approach. |
Culling out the effect of operations is impossible, but response to small changes in congestion level may act as a surrogate. |
| Traveler Survey Analysis – Area Studies: Partial elasticities |
Minneapolis HH Travel Surveys (2000, 2008) |
Low |
Long |
Control for trip generation factors; note change in trip-making due to system conditions. |
Changes in trip-making may be due to societal and socioeconomic factors – pinning it to network conditions may be difficult; culling out the effect of operations is impossible, but response to small changes in congestion level may act as a surrogate. |
| Traveler Survey Analysis – Area Studies: Partial elasticities |
PSRC Panel Survey (1999, 2006) |
Low |
Long |
Control for trip generation factors; note change in trip-making due to system conditions. |
Changes in trip-making may be due to societal and socioeconomic factors – pinning it to network conditions may be difficult; culling out the effect of operations is impossible, but response to small changes in congestion level may act as a surrogate. |
| Traveler Survey Analysis – Area Studies: Partial elasticities |
Knoxville HH Travel Surveys (2001, 2008) |
Low |
Long |
Control for trip generation factors; note change in trip-making due to system conditions. |
Changes in trip-making may be due to societal and socioeconomic factors – pinning it to network conditions may be difficult; culling out the effect of operations is impossible, but response to small changes in congestion level may act as a surrogate. |
| Traveler Survey Analysis – Area Studies: Partial elasticities |
NHTS (2001, 2009) |
Low |
Long |
Control for trip generation factors; note change in trip-making due to system conditions. |
Changes in trip-making may be due to societal and socioeconomic factors – pinning it to network conditions may be difficult; culling out the effect of operations is impossible, but response to small changes in congestion level may act as a surrogate. |
| Area Study: Proxy Measures |
Atlanta Detector and ATR data, 2000-2010, Census data |
Medium |
Short and Long |
VMT as a function of lane-miles, congestion level, and area growth. |
Lane-miles a poor measurement for traveler behavioral response |
The project team and FHWA concluded that pursuing analysis of travel surveys would not be fruitful – most previous studies of induced demand were based on surveys and there was a strong desire to try a more innovative approach. One activity from Table 1 may be of interest in the future, though: the Integrated Corridor Management (ICM) Traveler Panel Survey being conducted by the Volpe Center. The impetus for conducting this survey is that the travel decisions made by individual corridor travelers will significantly influence corridor operations. While much of the investment and complexity of the ICM Initiative will focus on optimizing and coordinating operations on the corridor facilities, the ultimate success of the Initiative depends upon the travel choices made by corridor users who will change route, time, or mode of travel in response to their experience with the facilities, coupled with their use of publicly provided real-time traveler information. The survey is being administered to the same panel of respondents before and after ICM implementation, covering both those who travel by car and by transit.
The approach decided upon was to rely on two types of analysis. First, empirical before/after data analysis was selected because it was felt that roadway surveillance data had matured to the point of being capable of detecting changes in travel conditions (travel times and demand) due to operational improvements. Atlanta, Georgia was selected as the study location. The task of monitoring long-term changes in demand from field data is somewhat problematic due to exogenous factors affecting the general demand for highway use, primarily fuel prices and economic conditions. The best way to factor these influences is to establish control sections on similar highways in the same area that have not been improved during the time of interest. Diversion is most likely to occur in the short term while long-term changes in improved versus control sections can be related to true induced demand.
Second, because travel-time reliability is a major – and often ignored – benefit of operations improvements, original research on the impact of reliability on land use development patterns was undertaken. The results of this research were then added to a special version of the UrbanSim land use model (UrbanSim home page), which was then integrated into a complete modeling framework with the MTC travel demand model. (See below for details.)
Third, the project team proposed to use advanced modeling frameworks both to estimate the emissions impacts of operations strategies and to study demand impacts. For the emissions impacts of operations, the ICM framework previously used in the San Diego, California I‑15 corridor was selected. This framework developed a microsimulation model to study the effect that ICM strategies have on congestion. For this project, we used the framework to conduct experiments of additional operations strategies (see Chapter 3 for details). For emissions analysis, we developed a postprocessor that translated individual vehicle trajectories (produced as microsimulation output) into operating mode distributions (i.e., VSP/speed bins). MOVES was then run in project-level mode to develop emission estimates.
Fourth, the choice of an advanced modeling framework to estimate demand changes due to operations was more problematic, confounded by the fact that the ideal framework to study this issue does not currently exist. Table 2 shows the advanced modeling frameworks considered and the desired features for the current study. The ideal framework has an advanced land use model that uses feedback from the network assignments, an activity-based travel model, and a dynamic traffic assignment procedure. The SHRP 2 C10A in Burlington, Vermont came the closest, but it had not yet been fully developed and Burlington was thought to be too small to be representative. The remaining frameworks all had one missing component.
Table 2. Characteristics of existing advanced modeling frameworks considered.
| Framework |
Desired Feature – Land Use Model Linkage? |
Desired Feature – Activity-Based Model? |
Desired Feature – Type of Traffic Assignment |
Desired Feature – Feedback from Assignment? |
| SHRP 2 C10A (Burlington) |
UrbanSim being linked in by the University of Vermont |
Yes |
TRANSIMS |
To activity and land use models |
| SHRP 2 C10A (Jacksonville) |
No |
Yes |
TRANSIMS |
To activity model only |
| SHRP 2 C10B (Sacramento) |
No |
Yes |
DynusT |
To activity model only |
| MTC (Bay Area, California) |
UrbanSim |
Yes |
Traditional equilibrium |
To activity and land use models |
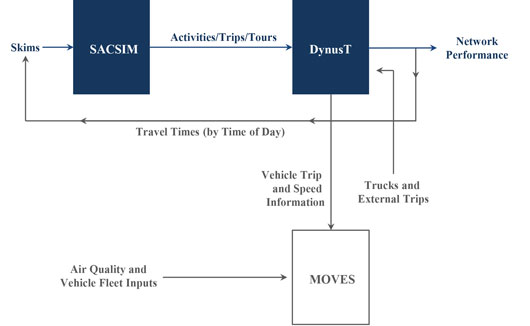
The SHRP 2 C10B framework was originally selected as the primary modeling framework for a number of reasons: CS staff already were developing it so the work could be done efficiently; it could model operations strategies; it is being linked to MOVES to estimate emissions impacts; and a number of operations-oriented tests already were scheduled to be conducted as part of the SHRP 2 project. As shown in Figure 2, a feedback loop exists between DynusT’s estimation of network performance (e.g., travel times) and the SACSIM activity model.
Figure 2. Flowchart. The activity-based modeling framework from SHRP 2 C10B.
(Source: Cambridge Systematics, Inc.)
Unfortunately, the SHRP 2 C10B project experienced significant delays, and these delays necessitated the choice of another advanced framework to assess demand changes. It was decided to use the MTC modeling framework as the alternative. This choice built on the special study of reliability and accessibility/land use patterns as already planned.
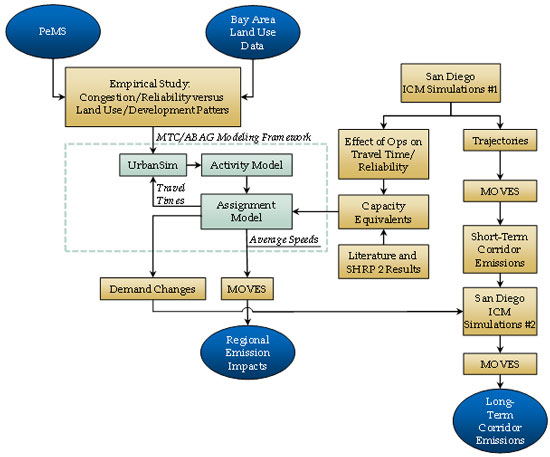
The final framework for the advanced modeling phase of the approach is shown in Figure 3. It combines the use of the MTC travel demand model with the reliability-enhanced UrbanSim model. This model combination provides both regional emissions estimates and an estimate of the VMT changes due to replicating the effect of operations strategies in the model. The I‑15 simulation runs were run first with the demand patterns originally set during the ICM study, then rerun with the VMT changes from the MTC model.
Figure 3. Flowchart. Final study approach, advanced modeling phase.
(Source: Cambridge Systematics, Inc.)



