Guide for Highway Capacity and Operations Analysis of Active Transportation and Demand Management Strategies
Appendix J: Demand Effects of Tolls
The effect of opening day tolls on demand levels can be estimated using the following equation.
Equation 11
Equation 12
Where
VTL(t,a) = The new demand for the tolled lanes for tolling schedule “t” and analysis period “a” (vph)
P(t,a) = The proportion of vehicles in the nontolled lanes of the facility choosing to use the priced lane under the new toll schedule “t” at the analysis period “a” (unit less)
V0,TL(t,a) = The original (current) demand for tolled lanes under original toll schedule “t” at analysis period “a” (vph)
P0(t,a) = The proportion of vehicles in the nontolled lanes of the facility that chose to use the priced lane under the original toll schedule “t” (if any) at the analysis period “a” (unit less)
VNTL(t,a) = The new demand for nontolled lanes under new toll schedule “t” at analysis period “a” (vph)
V0,NTL(t,a) = The original demand for nontolled lanes under original toll schedule “t” at analysis period “a” (vph)
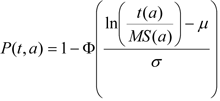
The proportion of vehicles on the facility choosing to use the priced lane is estimated using the following equation:
Equation 13
Where:
P(t,a) = Proportion of vehicles on the facility that will choose the priced lane during analysis period (a).
t(a) = the toll for analysis period “a” ($). t(a) > 0
MS(a) = minutes saved by taking the tolled lane (minutes). MS(a) > 0
converted into dollars paid per minute saved using priced lane during analysis period (a), subject to the constraint that t(a) > 0. (in units of dollars/minute)
Φ = (Phi), cumulative log-normal distribution
μ = (mu), the log of the average value of time (for default use 3.43) (Value provided is for default use only. For specific values of time consult the U.S. DOT, office of the Assistant Secretary for Transportation Policy web site.)
σ = (sigma), the log of the standard deviation of value of time (for default use 0.467)
If the predicted demand for the tolled lanes exceeds their capacity in any analysis period “a” then the relative time savings between tolled and untolled lanes needs to be recomputed and iterated to an equilibrium solution.
previous | next
