Operations Benefit/Cost Analysis Desk Reference
Chapter 4. Existing B/C Tools and Methods
Overview of Existing Tools and Methods for B/C Analysis of Operations
Dozens of individual analysis tools and methodologies designed for conducting B/C analysis of one or more TSM&O strategies have been identified to date. These include tools developed by regional, state, and Federal agencies, as well as proprietary tools developed by many private-sector enterprises; and range from simple methods intended for one-time analysis to more complex tools that are continually maintained and updated that form a continuing standardized framework for conducting B/C analysis for various agencies. Additionally, several emerging tools/methods are currently undergoing development as part of parallel efforts by U.S. DOT, American Association of State Highway and Transportation Officials (AASHTO), individual states and regions, and research organizations. (Note: Although classified as Benefit/Cost tools, few of the evaluated tools were capable of estimating the costs of TSM&O strategies. Most tools required the costs to be estimated off-model and entered as a line item in the analysis assumptions.)
Some of the most widely distributed and applied tools used for conducting B/C analysis of TSM&O strategies include those summarized (in alphabetical order) in Table 4-1. This listing summarizes those major tools developed by Federal, state, or regional transportation agencies (or affiliated research organizations) that are available within the public realm. This listing does not include proprietary offerings of private-sector vendors. Specific descriptions of the various tools follow Table 4-1.
The following sections provide a brief introductory description of the tools and methods presented in Table 4-1.
- BCA.Net – BCA.Net is the FHWA’s web-based benefit/cost analysis tool to support the highway project decision-making process, which is supported by the FHWA Asset Management Evaluation and Economic Investment Team. The BCA.Net system enables users to manage the data for an analysis, select from a wide array of sample data values, develop cases corresponding to alternative strategies for improving and managing highway facilities, evaluate and compare the benefits and costs of the alternative strategies, and provide summary metrics to inform investment decisions.
- CAL-BC – Excel spreadsheet-based tool developed by Caltrans. Originally designed to conduct benefit/cost analysis of traditional highway improvements, Cal-B/C has been subsequently enhanced to be used to analyze many types of highway construction and operational improvement projects, as well as some ITS and transit projects. Several agencies outside Caltrans have also adapted Cal-BC as the basis for their own tools. Cal-BC has been developed in separate versions supporting corridor- and network-wide benefits.
- COMMUTER Model – Spreadsheet-based analysis developed by the U.S. EPA to estimate emissions benefits related to a number of employer-based travel demand management strategies.
- EMFITS – Benefit/cost analysis methodology developed for New York State DOT and incorporated in New York State DOT ITS Scoping Guidance (Project Development Manual).
- FITSEval – The Florida ITS Evaluation (FITSEval) tool is currently under development by the Florida DOT. The tool is a travel demand model post-processor designed to estimate B/C of ITS from the State’s standardized FSUTMS model structure.
- HERS-ST – Highway Economic Requirements System – State Version (HERS-ST) was developed by the FHWA. Originally designed for assessing the impacts of traditional capacity improvements, HERS-ST was updated in 2004 to include analysis of selected management and operations strategies through the use of a data preprocessor. The Operations Preprocessor modifies the basic characteristics of the HPMS data used by HERS (capacity, delay, crash relationships, and incident characteristics). HERS then estimates the impacts based on the revised characteristics. The I-95 Corridor Coalition recently used HERS-ST to assess impacts of investment in multistate corridors.
- IDAS – The IDAS tools was initially developed by the FHWA in 2001 and has undergone multiple updates since. IDAS, a sketch-planning tool operating as a travel demand model post-processor, implements the modal split and traffic assignment steps associated with the traditional traffic demand forecasting planning model. IDAS estimates changes in modal, route, and temporal decisions of travelers resulting from more than 60 types of ITS technologies. There are more than 30 state and metropolitan planning organizations (MPO) applications of IDAS. Although many of the public sector-developed tools and methods presented in this section are available free of charge, IDAS is only available for purchase through the McTrans Center at the University of Florida at a costs of $795 per seat license.
- IMPACTS – IMPACTS is a series of spreadsheets, related to the STEAM model, developed to help screening-level evaluation of multimodal corridor alternatives, including highway expansion, bus system expansion, light-rail transit investment, HOV lanes, conversion of an existing highway facility to a toll facility, employer-based travel demand management, and bicycle lanes. Inputs are travel demand estimates by mode for each alternative.
- SCRITS – Screening Tool for ITS (SCRITS) was developed by the FHWA. The tool is a spreadsheet application for estimating user benefits of ITS at the sketch-planning level. SCRITS provides a highly approximate subset of the capabilities found in TOPS-BC.
- STEAM – Surface Transportation Efficiency Analysis Model (STEAM) uses information developed through the travel demand modeling process to compute the net value of mobility and safety benefits attributable to regionally important transportation projects. Developed by the FHWA, STEAM uses information developed through the travel demand modeling process to compute the net value of mobility and safety benefits attributable to regionally important transportation projects.
- TOPS-BC – The Tool for Operations Benefit/Cost (TOPS-BC) was developed in parallel with this Desk Reference and is intended to support the guidance provided in this document by providing four key capabilities: 1) allows users to look up the expected range of TSM&O strategy impacts based on a database of observed impacts in other areas; 2) provides guidance and a selection tool for users to identify appropriate B/C methods and tools based on the input needs of their analysis; 3) provides the ability to estimate life-cycle costs of a wide range of TSM&O strategies; and 4) allows for the estimation of benefits using a spreadsheet-based sketch-planning approach and the comparison with estimated strategy costs. The capabilities of TOPS-BC are highlighted throughout this Desk Reference.
- TRIMMS – Trip Reduction Impacts of Mobility Management Strategies (TRIMMS) model developed by the CUTR at the University of South Florida. TRIMMS© allows quantifying the net social benefits of a wide range of transportation demand management (TDM) initiatives in terms of emission reductions, accident reductions, congestion reductions, excess fuel consumption, and adverse global climate change impacts. The model also provides program cost-effectiveness assessment to meet the FHWA’s CMAQ Improvement Program requirements for program effectiveness assessment and benchmarking.
In addition to these existing tools, several pieces of ongoing research are anticipated to result in the development of tools and analysis methodologies related to operations strategies. Where available and appropriate, preliminary findings and methods from these studies have been integrated into this Desk Reference and utilized in the TOPS-BC application. Several of these more noteworthy efforts include:
- The FHWA pooled funds study of the impacts of managed lanes;
- I-95 Corridor and FHWA study on Traffic Incident Management (TIM) and benefit/cost analysis;
- The FHWA-sponsored project conducted by the University of Texas to develop a Project Evaluation Toolkit and Guidebook;
- The FHWA study on developing Highway Capacity Manual (HCM) methods for analyzing ATDM strategies; and
- SHRP 2 Project L05, Incorporating Reliability in the Transportation Planning Process.
The above tools and research efforts represent a sampling of the available methods that may be used for supporting and conducting B/C analysis of TSM&O strategies. The capabilities of many of these tools and the findings of the research efforts have been weaved into this guidance document, and also often forms the basis for the benefit and cost estimation capabilities developed in the supporting TOPS-BC tool.
In addition to these established tools, there are many customized methods that have been developed to support an individual agency’s needs, or modified from an analysis method to meet the needs of a specific analysis. These tools and methods can generally be segmented into three broad categories, including the following:
- Sketch-planning methods – These analysis methods provide simple, quick, and low-cost estimation of TSM&O strategy benefits and costs. Often based in a spreadsheet format, these methods often rely on generally available input data and static default relationships between the strategies and their impact on a limited number of MOEs to estimate the benefits of the strategy. A number of established B/C tools, including TOPS-BC, SCRITS, and Cal-BC, are classified as sketch-planning methods; however, this category also includes scores of individually developed and customized spreadsheet and simple database methods configured to support various analyses by single agencies.
- Post-processing methods – These methods are often more robust than sketch-planning methods, as they seek to more directly link the B/C analysis with the travel demand, network data, and performance measure outputs from regional travel demand or simulation models. Several established tools, including IDAS and the FITSEval application, have been designed to directly accept detailed model data as inputs to the analysis. The tools then provide additional analysis within their framework to assess impacts to MOEs outside the capabilities of typical travel demand models. Outside of these more established tools, these post-processing methods also include customized applications, algorithms, and routines that may be applied directly within a region’s existing modeling framework to produce the required MOEs. These methods are often more capable of assessing the impacts of route, mode, or temporal shifts than compared to sketch-planning methods.
- Multiresolution/multiscenario methods – These analysis methods are often the most complex of the methods and are typically applied when a high level of confidence in the accuracy of the results is required. These methods are most often applied during the final rounds of alternatives analysis or during the design phases when detailed information is required to prioritize and optimize the proposed strategies. Multiresolution methods depend on the integration of various analysis tools (e.g., linking a travel demand model and a simulation model) to provide meaningful analysis of the full range of impacts of a TSM&O strategy – capturing both the long-term impacts on travel demand, along with the more immediate impacts on traffic performance. Meanwhile, multiscenario methods seek to assess strategy performance during varying underlying traffic conditions. In this analysis, the impact of a particular strategy may be tested under a variety of conditions (e.g., incident versus no-incident, good weather versus rain conditions versus snow conditions) in order to fully capture the benefits under all the likely operating conditions. This type of analysis often requires that the analysis model be run multiple times to capture these effects. For complex analysis requiring a high degree of confidence in the results, multiresolution and multiscenario analysis may be performed in concert within an analysis framework.
The general categories listed above largely encompass the range of available analysis methods; however, there are often methods and tools that may not fit neatly within single categories. These hybrid approaches are often applied when a single method does not completely meet the needs of a particular analysis. The subsequent sections provide additional discussion of the method categories, and provide examples of tools and analysis utilizing those methods.
Note: The TOPS-BC tool developed in parallel with this Desk Reference document contains a decision-support tool designed to aid practitioners in identifying an appropriate method for conducting B/C analysis based on various input criteria. This capability is described further in Chapter 5.
Sketch-Planning Methods
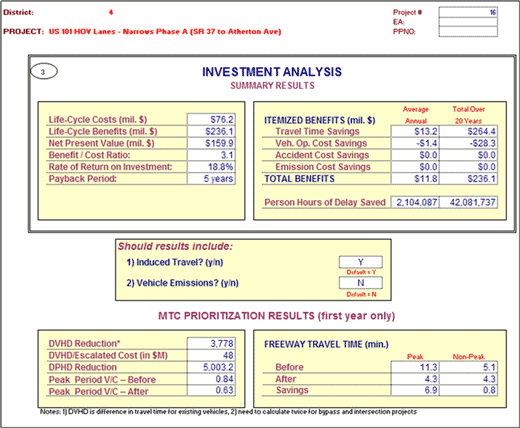
These methods/tools are typically conducted in spreadsheets or simply structured databases, and are intended to provide relatively easy and fast analysis of the TSM&O strategy. They represent most commonly applied tool category. The methods often require relatively limited input data (e.g., basic aggregated volume and speed data); and produce order of magnitude results appropriate for early evaluation, screening, and prioritization of various strategies. Benefit analysis is typically based on generally linear assumptions regarding the impact of various strategies. These methods are also often limited; in that, they are incapable of assessing the impacts of various TSM&O strategies deployed in combination with each other (e.g., the tools typically cannot analyze the synergistic effects of integrating various systems). These methods are often developed and configured by agencies for individual analysis, although a number of existing tools has been developed to serve as ongoing templates for conducting analysis, including the TOPS-BC tool developed in parallel to this Desk Reference, FHWA’s SCRITS tool (shown as Figure 4-1 below), and Caltrans’ CAL-BC tool (shown as Figure 4-2 below), among many others.
Figure 4-1. Example View of Sketch-Planning B/C Analysis Method (SCRITS) Data Inputs

Figure 4-2. Example View of Caltrans’ CAL-BC Analysis Tool Data Outputs
Sketch-Planning Method Advantages
The following summarize the general advantages of using sketch-planning analysis:
- Easy to use – Many of the sketch-planning methods may be researched and mastered very quickly, limiting the amount of staff resources needed to conduct the analysis.
- Limited data requirements – Sketch-planning methods typically require generally available data (e.g., facility volumes, speeds) as inputs to the framework. These data may be obtained from real-world counts, model data, or other sources.
- Quick set up and analysis times – Assuming the input data is easily available, the analysis times are generally very fast, often allowing multiple alternatives to be analyzed in the period of a single hour.
- Low cost – Due to the ease of use, limited data requirements, and quick analysis times, sketch-planning methods may often be applied at little resource cost to the performing agency. Additionally, many of the established sketch-planning tools are distributed at no or very limited procurement cost.
- Ability to customize – Since many sketch-planning methods are developed in a spreadsheet format, it is typically easy to both review and make adjustments to the default parameters, assumptions and formulas used in the tools. This allows for the better configuration of established tools to the local environment and conditions.
Sketch-Planning Method Challenges
The following represent some of the identified challenges of using sketch-planning methods:
- Order of magnitude outputs – Sketch-planning methods often lack the rigor of more advance analysis methods; therefore, the outputs are most appropriate for preliminary planning and screening of alternatives when a low or moderate level of confidence in the analysis results is appropriate to the analysis phase.
- Limited MOEs – Many sketch-planning methods focus only on a limited set of output MOEs, reducing the comprehensiveness of the B/C analysis.
- Linear (Nondynamic) assumptions of user behaviors – Most sketch-planning methods assume static, linear reactions of travelers to deployed strategies. Behavioral changes, such as route change, mode shift, temporal change, or longer-term changes in travel demand, may not be captured in the simplified analysis.
Appropriate Applications for Sketch-Planning Methods
Given the capabilities of sketch-planning methods, as reflected in the advantages and challenges presented above, these methods are often most appropriately applied during the early stages of the planning process, when there is a large number of potential projects that must be preliminarily analyzed in order to prioritize projects that are most deserving of additional, more detailed analysis in subsequent planning phases. Sketch-planning methods are also appropriate for use in estimating high-level benefits of existing strategies for use in justifying the continued deployment funding or expansion of an existing initiative.
Post-Processing Methods
These more complex methods and tools generally include customized user interfaces and analysis processes, and are intended to be linked (either directly or indirectly) with traditional transportation analysis tools, such as travel demand models, simulation models, or HPMS databases. These tools may be developed in various programming languages; and some, such as the FHWA’s BCA.Net, are available directly through on-line portals. The customized functionality of these tools often provides additional analysis capabilities and additional accuracy of estimated impacts, due to the customization and configurability provided beyond simple spreadsheet capabilities. Additionally, some of these tools work by modifying the existing analysis capabilities available in their host tools to be more sensitive to the specific impacts of TSM&O strategies.
These tools may, however, require more specific data and additional effort to configure and operate, and the analysis processes may not be as transparent as some spreadsheet-based tools. The additional analysis configurability often allows for the closer inspection of specific impacts related to specific MOEs and improves the confidence in the output results, making these tools valuable for prioritizing limited lists of potential deployments. Other examples of these types of tools include the FHWA’s IDAS software (shown as Figure 4-3 below) and the Florida DOT’s FITSEval toolset.
Figure 4-3. Example of Post-Processing B/C Analysis Method (IDAS)
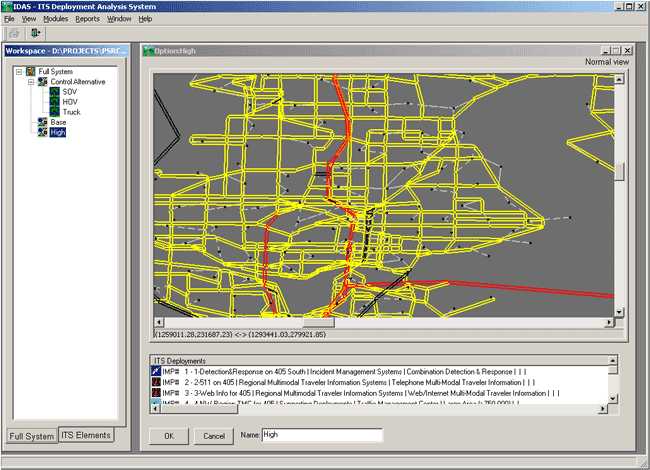
In addition to these established post-processing tools designed to be applied by multiple agency, this category also includes model modifications by individual agencies intended to develop routines, algorithms, and processes to improve the ability to generate better estimates of TSM&O-related performance measures (e.g., travel time reliability), or otherwise improve the assessment of TSM&O within their existing travel demand or simulation model framework.
Post-Processing Method Advantages
The following summarize the general advantages of using post-processing B/C analysis methods:
- Assessment of traveler behaviors – Since these methods are based on existing models calibrated to regional travel conditions, there is often the capability to better assess a wider range of potential traveler behaviors, such as route change, mode shifts, temporal shifts, and long-term changes in travel demand, thus, providing more adaptive (less linear) reactions to strategies than provided in the sketch-planning methods.
- Data availability – Since most urban regions have existing calibrated travel demand models, the analysis data and structure necessary to conduct this type of analysis already exists. This limits the amount of additional data collection and analysis that may need to be performed to support the analysis.
- Consistency with the regional planning process – Most planning agencies are familiar and comfortable with using the regional travel demand model outputs in their planning studies. Consistency with the existing processes promotes better understanding and buy-in with the results of the analysis.
- Development of a reusable process – Once post-processing methods have been initially set up and tested, they may be repeatedly used to provide consistent and low-cost analysis of multiple alternatives. The initial set-up process for this method may be onerous, however, as discussed below.
Post-Processing Method Challenges
The following represent some of the identified challenges of using post-processing methods:
- Analysis effort – Post-processing methods most typically require either the linkage of an existing regional model with an available post-processing tool (e.g., IDAS); or the individual development of customized model routines, algorithms, and procedures within the model structure. Either way, the complexity of modern travel demand or simulation models means that a significant effort will be required to develop, apply, test, and validate these methods. Often, a majority of this total analysis effort is required in the early set up and calibration of the method.
- Compatibility of tools/methods – Many different modeling platforms from a variety of vendors are in use today; and there is often little standardization in their input/export data, modeling routines, and assumptions. Likewise, the developed post-processing tools also have many limitations on the types and format of data that may be used in the analysis. Prior to attempting these methods, research is recommended to assess the compatibility of the proposed tools to better ensure success in linking their capabilities.
Appropriate Applications for Post-Processing Methods
Given the capabilities of post-processing methods, as reflected in the advantages and challenges presented above, these methods are often most appropriately applied during the middle to late stages of the alternative analysis/prioritization planning processes. The higher costs (greater analysis resources required) associated with post-processing methods mean that a smaller number of alternatives be considered in the analysis, as compared with lower-cost sketch-planning methods. These methods may also be appropriately used in the evaluation of existing deployments, as highlighted in the Cincinnati region case study presented in Chapter 2.
Multiresolution/Multiscenario Methods
These methods/tools are the most complex of the analysis approaches and are typically only used in situations where a limited number of alternatives need to be evaluated, but highly accurate results are desired. These methods require the use and integration of multiple analysis tools (e.g., combining the analysis capabilities of a travel demand model with a traffic simulation model) to assess the potential impacts of the TSM&O strategy. The combination of the modeling capabilities is intended to combine the strengths of various transportation analysis models to assess both the short-term impacts (e.g., impacts on travel speed under particular travel conditions) and the long-term impacts (e.g., changes in travel demand over time) of TSM&O strategies.
Likewise, multiscenario methods seek to assess strategy performance during variations in underlying traffic conditions. In this analysis, the impact of a particular strategy may be tested under a variety of conditions (e.g., incident versus no-incident, good weather versus rain conditions versus snow conditions) in order to fully capture the benefits under all the likely operating conditions. This type of analysis often requires that the analysis model(s) be run multiple times to capture these effects. The data required to identify and develop appropriate analysis scenarios (e.g., frequency and location of incidents; distribution of fair, rain, snow weather days) are often obtained using archived data systems, adding another tool to the integrated analysis approach.
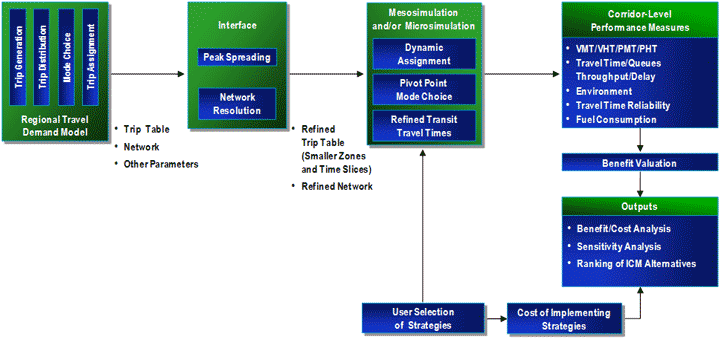
For complex analysis requiring a high degree of confidence in the results, multiresolution and multiscenario analysis may be performed in concert within an analysis framework. One of the most prominent recent examples of multiresolution/multiscenario methods for B/C analysis is the FHWA’s ICM Initiative analysis effort. (FHWA ICM – Analysis, Modeling, and Simulation Guide,Draft Report, April 2011.) Figure 4-4 presents an overview of the multiresolution analysis process that was developed in the B/C analysis effort of the ICM initiative, showing the linkage of regional travel demand models (which were used to assess the long-term impacts on travel demand of the considered strategies) and a refined simulation model (used to identify the more immediate operational performance impacts of the strategies). The ICM analysis process was completed for multiple iterations to estimate the variation in performance under different operating scenarios (e.g., incidents versus nonincident days). Thus, this method represents a combined multiple resolution and multiple scenario approach.
Multiresolution/Multiscenario Method Advantages
The following summarize the general advantages of using multiresolution/multiscenario B/C analysis methods:
- Assessment of short- and long-term traveler behaviors – Travel demand models have a strong capability of assessing long-term impacts of travel demand and analyzing traffic during “typical” conditions, while simulation models’ strength is often the dynamic assessment of operational performance during discrete time slices and during varying nonrecurring traffic conditions. Combining the strengths of these two models provides the ability to assess both the short-term, immediate impacts of a TSM&O strategy, but also the longer-term demand (change in the number of trips) impacts that may occur as travelers adjust to the changed transportation environment. These tools often represent the best solution for fully considering the multifaceted impacts of many strategies for both operations and planning purposes.
Figure 4-4. Multiple-Resolution Approach Developed for the ICM Initiative Analysis
Source: FHWA ICM – Analysis, Modeling and Simulation Guide, Draft Report, April 2011.
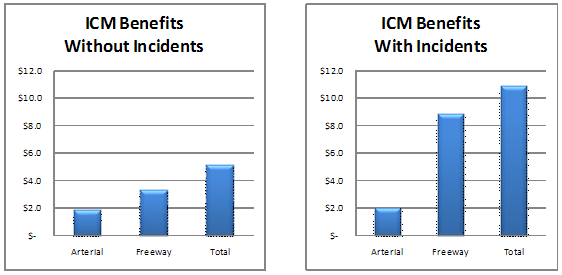
- Assessment of nonrecurring conditions – This method, particularly when multiscenario analysis is applied, is capable of dynamically modeling conditions representing nonrecurring situations that would likely to occur. Assessing this full range of conditions provides the ability to capture benefits of many TSM&O strategies that otherwise would have been understated if only “typical” day conditions had been included in the analysis. Figure 4-5 presents a comparison of two analyses performed as part of the ICM initiative analysis. The figure on the left represents an estimate of the benefits for a San Diego deployment of ICM that only considers “typical” days that are void of incident conditions. The figure on the right represents an estimate of benefits that would accrue as a result of the improvements when both “typical” and incident days are considered. Clearly, the inclusion of the analysis of benefits on incident days boosts the benefits (more than double) and illustrates that failure to consider these nonrecurring conditions will often result in a severe understatement of benefits for many TSM&O strategies.
Figure 4-5. Comparison of ICM Benefit Estimates between Nonincident Scenarios and Incident Scenarios (San Diego I-405 Analysis – in Millions of Annual Dollars)
Source: FHWA ICM – Analysis, Modeling, and Simulation Guide, Draft Report, April 2011.
- Detail of analysis – Multiresolution/multiscenario analysis has the capability to produce very detailed analysis results. The ability of this method to examine many MOEs, particularly travel time reliability, is far superior to existing sketch-planning or post-processing methods. When set up and calibrated correctly, this method allows a high level of confidence to be placed on the accuracy of the output results of the analysis activity.
- Flexibility of the analysis – The highly customizable analysis routines, provided by this method, allow practitioners to evaluate the widest range of TSM&O strategies of any of the methods, and further provide the capability to look at many MOEs at a level of detail not provided by other tools/methods.
Multiresolution/Multiscenario Method Challenges
The following represent some of the identified challenges of using multiresolution/multiscenario B/C analysis methods:
- Model development and analysis effort – The complexity of this analysis process requires that a significant effort be undertaken to develop the analysis process. Linking various model platforms often requires a substantial amount of staff, expertise, computing, schedule, and budget resources. It is critical that the linkage process be carefully planned, and that the model processes undergo a rigorous calibration and validation process to ensure the accuracy of the results. The model calibration process can be the most time- and budget-consuming process in the entire analysis. For complex analyses, practitioners can expect six months to one year be required to develop the analysis capabilities. (FHWA Traffic Analysis Toolbox – Volume II, 2004.) However, once the model is established, the analysis may be repeated for multiple alternatives on a relatively quick basis, allowing the initial cost of developing the method to be amortized over multiple operations and planning analysis. Further, ongoing research and application of these methods by FHWA and other practitioners is yielding new methods and process guidance that is reducing the cost of these efforts.
- Compatibility of tools/methods – The linkage of different modeling platforms and tools requires careful planning and research prior to undertaking this ambitious effort. Many tools are not easily combined, and thus, may require significant effort to manually interface the models and data. Again, ongoing research, as well as efforts by individual tool developers are reducing this barrier as these methods become more mainstreamed.
- Complexity limits on analysis scope – The large amount of resources required to develop the model processes often limits the scope of the analysis that may be performed using this methodology. This may represent a geographic limitation – the simulation analysis is often limited to a single corridor or small subarea, instead of the entire network – or an alternative limitation – the number of alternatives that may be run through the process is likely to be limited to a small number given the resources required to analyze each scenario.
Appropriate Applications for Multiresolution/Multiscenario Methods
Given the capabilities of multiresolution/multiscenario methods, as reflected in the advantages and challenges presented above, these methods are often most appropriately applied during the final stages of the alternative analysis/prioritization planning processes, and during phases where the actual operating parameters of the strategy are being refined (design phase). These stages of the planning process often require the high level of detail and strong confidence in result accuracy provided by this method. The resources required to develop and calibrate the modeling capabilities, as well as the effort required to run individual scenarios, often limit the geographic scope of the analysis – more likely a corridor analysis than a regionwide assessment – or the number of alternatives that may be analyzed, so it is recommended that this method be applied after previous prioritization processes have already condensed the number of scenarios to be analyzed.
Operations Strategies Available for Analysis in the Tools/Methods
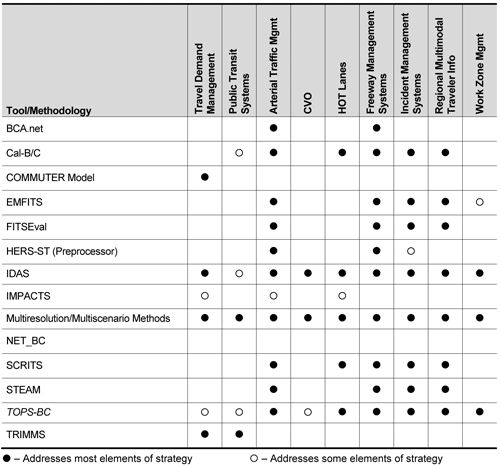
Many of the different tools and methods discussed in Chapter 4 were designed to analyze one or more TSM&O strategies. Only multiresolution/multiscenario analysis methods maintain the flexibility to currently analyze all of the generally recognized TSM&O strategies. Figure 4-6 summarizes the strategies that may be analyzed by many of these widely distributed available tools.
Figure 4-6. Available Tools/Methods Mapped to Strategies Analyzed
MOEs Generated
Most of the analysis tools and methods introduced in Chapter 4 provide varying capabilities of analyzing the impact of TSM&O strategies on different MOEs. Few existing tools are fully capable of estimating the impacts to the comprehensive range of measures that may be impacted by TSM&O strategies. Only multiresolution/multiscenario methods come closest to this comprehensive capability, and the ability of these methods to produce the full range of benefits is not intrinsic to the method itself, but is instead a product of the flexibility of the approach. The user of multiresolution/multiscenario methods would need to carefully plan and implement their modeling approach to produce the desired MOEs. Figure 4-7 summarizes the MOEs that may be analyzed by many of the currently available tools.
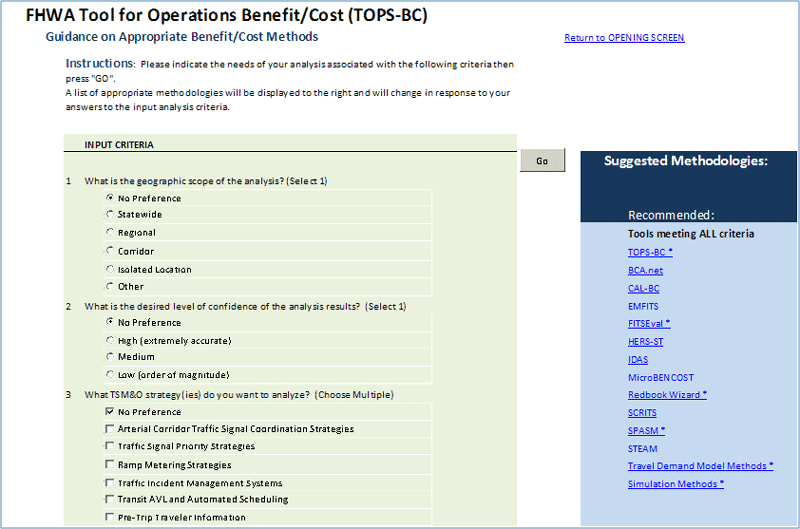
Selecting the appropriate analysis tool or method is a critical step in the B/C analysis. The selected tool must be capable of evaluating the TSM&O strategies and MOEs of interest to the agency. The tool must also be appropriate to the scope of the analysis and be able to use with the resources available for the study. Chapter 5 provides additional detail on factors that need to be considered when developing an analysis approach. Additionally, the TOPS-BC application that supports this Desk Reference provides a decision-support tool intended to assist practitioners in prioritizing their analysis needs against the capabilities of the available tools. In this TOPS-BC screening process, users are asked to indicate their analysis needs in relation to a number of criteria, including the following:
- Geographic scope of the analysis;
- Desired level of confidence in the results;
- TSM&O strategies to be analyzed;
- Key MOEs;
- Travel modes to include;
- Level of resources to support the analysis; and
- Data/tools available to support the analysis.
Figure 4-8 presents a partial screen view of the TOPS-BC method selection application.
Figure 4-7. Sample View of TOPS-BC Impact Lookup Function
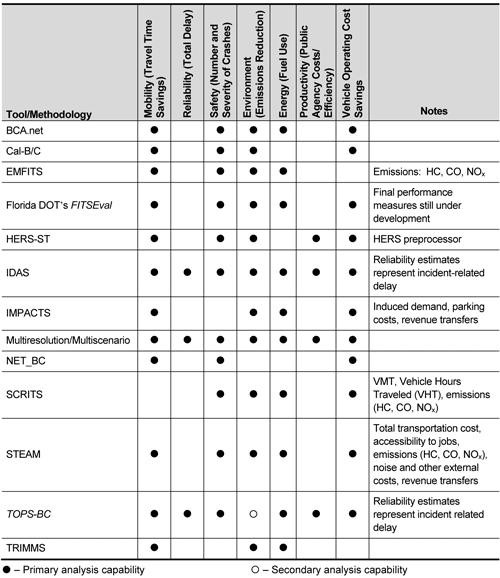
Figure 4-8. TOPS-BC Analysis Method Selection Tool (Partial Screenview)
You will need the Adobe Reader to view the PDFs on this page.


