Border-Wide Assessment of Intelligent Transportation System (ITS) Technology—Current and Future Concepts
Final Report
CHAPTER 5. TRAVELER INFORMATION AND ARCHIVED DATA MANAGEMENT
Traveler Information
Traveler information allows travelers to choose the most efficient mode and route to their final destinations. Advanced Traveler Information Systems (ATIS) use ITS to provide timely and detailed information about traffic incidents, weather, construction, and special events to improve travel time predictability, allow drivers to make better choices, and reduce congestion. Traveler information applications use a variety of technologies, including Internet Web sites, telephone hotlines, and television and radio to allow users to make more informed decisions regarding trip departures, routes, and mode of travel (73). It is generally believed that traveler information systems are among the most cost-effective investments that a transportation agency can make (74). From a systems perspective, traveler information has the potential to reduce travel times, delay, fuel consumption, and emissions. From a motorist’s perspective, traveler information can increase efficiency of travel, relieve stress, and increase trip reliability.
Traveler information is divided into two categories: pre-trip and en-route. Pre-trip traveler information provided via Internet Web sites, other wireless devices, 5-1-1 telephone numbers, other telephone services, television, radio, or kiosks allows users to make a more informed decisions for trip departures, routes, and modes of travel. En-route traveler information provided via wireless devices, 5-1-1 telephone numbers, other telephone services, radio, and in-vehicle signing allows users to make informed decisions regarding alternate routes and expected arrival times.
Every State in the United States incorporates some form of traveler information on freeways, State highways, and arterials. Across the country, cities collect information with varying levels of sophistication, from simple Highway Patrol reports to complex systems of camera surveillance and electronic traffic sensors. Likewise, the means of disseminating the information varies. The most common methods of information dissemination are highway advisory radio (HAR), VMSs, and telephone information services. A growing number of cities also provide Web/Internet sites and personal data assistant-type in-vehicle devices for traveler information (74).
With the growing number of systems being deployed at border crossings to measure crossing times and wait times, more and more State and regional agencies relay the information to motorists and commercial vehicle operators. The information typically includes wait times, crossing times, traffic conditions, and visual queue conditions around border crossings. These systems are able to relay information to traveling motorists and commercial vehicle operators as pre-trip and en-route information.
Use of Variable Message Signs at and around Border Crossings
A quick review of agency Web sites and the literature review revealed that almost none of the agencies on the U.S.-Mexico border currently provide border-related information displayed on VMSs. Several agencies on the U.S.-Canada border provide queue warning and wait-time information through VMSs deployed at approaches leading to border crossings. Table 21 includes a list of agencies on both the U.S.-Canada and U.S.-Mexico borders that have deployed either fixed or portable VMSs for the purposes of relaying information about border crossings.
| Agency | Fixed Signs | Portable Signs |
|---|---|---|
| Texas Department of Transportation (75), (76) | Yes | No |
| New Mexico Border Authority (77) | No | No |
| New Mexico Department of Transportation (78) | No | No |
| Arizona Department of Transportation (79) | No | No |
| SANDAG and California Department of Transportation (Caltrans) (80) | No | No |
| Washington State Department of Transportation (81) | Yes | No |
| BCMoT (82) | Yes | No |
| New York State Department of Transportation (83) | No | No |
| Buffalo and Fort Erie Public Bridge Authority (Peace Bridge) (84) | Yes | No |
| Niagara Falls Bridge Commission (85) | No | No |
| Blue Water Bridge Canada (86) | No | No |
| Michigan Department of Transportation (87) | No | No |
| Montana Department of Transportation (88) | No | No |
| SCT (49) | Planned | No |
However, SANDAG is planning to relay border-crossing information on SR-905, which provides an essential connection between the Otay Mesa border crossing with Mexico and the regional freeway system in California. This project will construct a six-lane freeway from I-805 to the Otay Mesa POE, the busiest commercial border crossing on the California-Mexico border. This project, along with the future Otay Mesa East POE and SR-11, will provide for efficient transportation of goods and services in the Otay Mesa border region. The first half of the six-lane freeway began construction in April 2008, and the remaining half began in June 2009.
This includes a 5-1-1 travel information system, fiber-optic communication traffic monitor systems, ramp meter systems, signals with video detection, CCTV systems, and VMSs all connecting to a base communication hub. A corridor management plan for the proposed SR-905 project is intended to provide a unified, multimodal system management concept for managing and preserving freight mobility in the corridor (89).
Agencies planning to deploy VMSs for border crossings need to be aware that the efficiency of such deployment depends upon whether travelers understand the information correctly, how they value the usefulness of information, and whether they follow the suggested alternates. Studies have shown that the preferences on route switching increase with the information contents provided by the VMSs. When only qualitative information is provided through the VMS, the rates of switching routes are low. On the contrary, when a VMS provides guidance information, most travelers tend to switch because it is implied that the alternative routes are the best routes (90). Whether a similar conclusion can be drawn for border crossings is a topic of future research—mainly because motorists do not have many choices when it comes to border crossings.
In addition, an analysis of diversions for different incident messages showed that the number of diversions varied considerably according to incident circumstances. It is apparent that it is not only the severity of the problem reported that influences the level of diversions but also other factors such as the specific location mentioned and the availability of viable alternative routes to avoid the problem location. The results for route guidance information showed that substantial diversions occur when the route advice differs from normal.
Use of Social Networking Sites, Web Sites, and Mobile Devices
Almost all State DOTs, CBP, and CBSA relay border-crossing-related information using agency Web sites over the Internet. CBP and CBSA relay border wait times using RSS as well. State DOTs such as Washington and California relay border wait-time information using existing 5-1-1 systems. On the U.S.-Mexico border, the only source of border wait times is the CBP since none of the border crossings is instrumented to measure wait times or crossing times, except the Bridge of the Americas and Pharr-Reynosa International Bridge. On the U.S.-Canada border, even though the primary source of border wait times is CBSA, several privately operated bridges relay wait-time and crossing time information using technologies that are primarily used for toll collection.
Table 22 lists agency use of social networking sites (SNSs), e-mail, and mobile devices by agencies to relay border crossing and wait times. Table 23 lists agencies that relay border crossing and wait times to motorists via Twitter. “Followers” mean individuals who have signed on to follow the tweets (messages) released by the agency. Without following the agency, individuals cannot receive or read tweets from the agency. “Listed” means the number of other Web sites that list the agency’s Twitter messages on their own Web site. The small number of current followers clearly indicates under-utilization or limited use of social media sites to receive traffic-related information.
CBP publishes wait times at all U.S.-Canada-Mexico border crossings. The information is updated every hour and includes the number of lanes open for FAST, non-FAST, SENTRI, and non-SENTRI; the maximum number of available lanes; and the name of the border crossing (35).
| Agency | RSS | 5-1-1 System | Web Site | Mobile Apps | |||
|---|---|---|---|---|---|---|---|
| CBP (91) | No | No | No | Yes | No | Yes | Yes |
| CBSA (92) | No | Yes | No | No | No | Yes | Yes |
| SCT (49) | No | No | No | No | Yes*** | Yes*** | Yes*** |
| TxDOT (75), (76) | No | No | No | No | No | Yes* | No |
| NMBA (77) | No | No | No | No | No | Yes* | No |
| NMDOT (78) | No | No | No | No | No | No | No |
| ADOT (79) | No | No | No | No | Yes | Yes | Yes |
| SANDAG and Caltrans (80) | No | No | No | No | Yes | Yes* | No |
| WSDOT (81) | No | Yes | Yes | Yes | No | Yes | No |
| BCMoT (82) | No | No | No | No | No | Yes** | No |
| NTDOT (83) | No | No | No | No | No | No | No |
| Buffalo and Fort Erie Public Bridge Authority (Peace Bridge) (84) | No | No | No | No | No | Yes | Yes |
| Niagara Falls Bridge Commission (85) | No | Yes | No | No | No | Yes | No |
| Blue Water Bridge Canada (86) | No | No | No | No | No | Yes | No |
| Michigan Department of Transportation (MDOT) (87) | No | No | No | No | No | No | No |
| Montana Department of Transportation (MDT) (88) | No | No | No | No | No | No | No |
* Same as CBP wait times; ** Same as CBSA wait times; *** Planned.
| Agency | Followers | Listed |
|---|---|---|
| CBSA (92) | 332 | 39 |
| Niagara Falls Bridge Commission | 822 | 36 |
Source: (85)
SNSs are Web-based services that allow individuals to (a) construct a public or semi-public profile within a bounded system, (b) articulate a list of other users with whom they share a connection, and (c) view and traverse their list of connections and those made by others within the system (93). Examples of these sites include Facebook, Twitter, LinkedIn, and Foursquare. These Web sites are popular among the younger population who favor the Internet over traditional forms of media such as television, radio, and newspapers for news and information. However, they are becoming increasingly popular among all users of the Internet. Government agencies, including several other State transportation departments, are using new media such as social networking sites to enhance their efforts to provide information to the public.
These sites function differently than standard Web pages and feature the consolidation of different information sources onto one page, often with information “pushed” to them. The sites generally require individuals to register and select sources they wish to “follow” with updates flowing to their social networking pages automatically.
Social networking sites have dramatically altered how people interact and share information. Moreover, with the amount of time most drivers spend behind the wheel increasing along with traffic congestion, social networking will inevitably find its way into cars. It has already, when one considers the fact that some motorists feel compelled to update their status on a phone when they should be looking at the road (94).
Some companies are already developing interfaces that will allow motorists to receive audible tweets and Facebook status updates, as well as record their own by using voice control and steering wheel buttons. Similarly, location-aware applications could easily allow car owners to note their location and find where friends are via social networking sites like Foursquare. The car itself could even send tweets and “check in” at locations (94).
Many State agencies including State DOTs publish real-time traffic information on these social networking sites, assuming that these sites allow wider dissemination of traffic information to motorists. There seems to be significant (latent) demand for personalized information services that would allow users to retrieve information when needed, to the point where a significant number of San Francisco Bay-area travelers stated they would be willing to pay either on a per-call basis or a monthly subscription fee for a customizable service. However, the new information must be superior to the information that can be obtained for free through radio or television or other Internet outlets and services (95).
Being able to send messages regarding traffic conditions to mobile devices has come with mixed feelings. Safety experts and policymakers are wondering whether they are giving a mixed message to motorists regarding using mobile devices while driving. At least 22 States that ban texting while driving also offer motorist information services via Twitter. Those information services provide locations of road emergencies, traffic congestion reports, and more (96). Some supporters of text-messaging bans say that states that provide traffic information via Twitter are undermining these laws.
Agencies also use Internet Web sites, mobile devices, and SNSs to relay information regarding traffic conditions around border crossings. Compared to the U.S.-Mexico border, agencies on the U.S.-Canada border have deployed more ITS devices to relay such information to motorists. Table 24 lists agency use of Internet Web sites to relay traffic-related information around border crossings. The most prevalent information includes CCTV snapshots of queue conditions, color-coded speed information, and location of recent incidents. These agencies also relay similar information through SNSs, RSS, email, and Web sites. Only a few State DOTs on the U.S. side of the Canadian border have integrated these systems with their statewide 5-1-1 system. On the U.S.-Mexico border, only SANDAG provides border-crossing-related information through its regional 511 system.
Table 25 lists use of social networking sites, email, the 5-1-1 system, and mobile devices by agencies to relay traffic conditions around border crossings. Figure 8 shows a snapshot of SANDAG’s 5-1-1 system Web site. Figure 9 illustrates a proposed countrywide 5-1-1-type system being developed by the SCT.
| Agency | CCTV Snapshots | Color-Coded Speed Information | Textual Speed Information | Incident Location |
|---|---|---|---|---|
| CBP | Not Applicable | Not Applicable | Not Applicable | Not Applicable |
| CBSA | Not Applicable | Not Applicable | Not Applicable | Not Applicable |
| SCT (49) | Yes* | Yes* | Yes* | Yes* |
| TxDOT (75), (76) | Yes | Yes | Yes | Yes |
| NMBA (77) | No | No | No | No |
| NMDOT (77) | No | No | No | Yes |
| ADOT (79) | No | No | No | Yes |
| SANDAG and Caltrans (80) | No | Yes | Yes | Yes |
| WSDOT (81) | Yes | Yes | Yes | Yes |
| BCMoT (82) | Yes | Yes | Yes | No |
| NYDOT (83) | Yes | Yes | Yes | Yes |
| Buffalo and Fort Erie Public Bridge Authority (Peace Bridge) (84) | Yes | No | No | No |
| Niagara Falls Bridge Commission (85) | Yes | No | No | No |
| Blue Water Bridge Canada (86) | Yes | No | No | No |
| MDOT (87) | Yes | Yes | Yes | Yes |
| MDT (88) | No | No | No | Yes |
| Agency | RSS | 5-1-1 System | Web Site | |||
|---|---|---|---|---|---|---|
| TxDOT (75), (76) | No | Yes | Yes | No | No | Yes |
| NMBA (77) | No | No | No | No | No | No |
| NMDOT (77) | No | No | No | No | Yes | Yes |
| ADOT (79) | No | No | No | No | Yes | Yes |
| SANDAG and Caltrans (80) | No | No | No | No | Yes | Yes |
| WSDOT (81) | No | No | Yes | No | Yes | Yes |
| BCMoT (82) | No | No | No | No | Yes | No |
| NYDOT (83) | No | No | No | No | Yes | Yes |
| Buffalo and Fort Erie Public Bridge Authority (Peace Bridge) (84) | No | No | No | No | No | Yes |
| Niagara Falls Bridge Commission (85) | No | No | No | No | No | Yes |
| Blue Water Bridge Canada (86) | No | No | No | No | No | Yes |
| MDOT (87) | No | No | No | No | No | Yes |
| MDT (88) | No | Yes | No | Yes | Yes | Yes |
| SCT (49) | No | No | No | No | Yes* | Yes* |
* Planned only on toll roads leading to and from international border crossings at the U.S.-Mexico border.
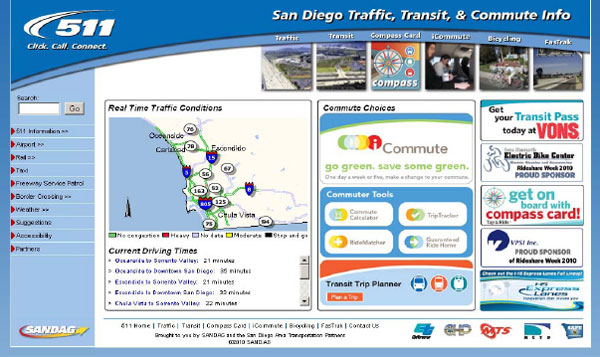
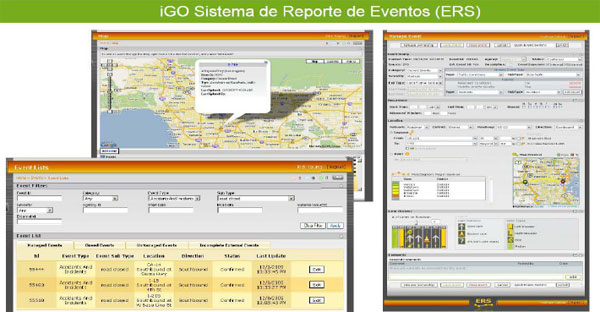
Figure 9. Screen snapshots of the planned nationwide 5-1-1 traveler information system in Mexico.
Effectiveness of Traveler Information at Border Crossings
The literature review revealed that effectiveness of traveler information at and around border crossings has not been studied. Past studies have focused on its effectiveness on urban freeways and arterials only. However, conclusions similar to the ones drawn for urban freeways can be applied to border crossings. From these past studies, a general consensus is that motorists use traveler information to the extent that they perceive it to deliver reliable, resourceful, and relevant information (98).
In a study performed among Seattle-area travelers, researchers found that the use of advanced traveler information is fairly uncommon, with travelers seeking information on only 10 percent of their trips and making a change in response to information on less than 1 percent of their trips. Information sources included radio, television, Web sites, and VMSs (99). As to why travelers often do not seek any information in the first place, this seems most closely tied to trip characteristics. Simulation models of traveler information usage suggest that the overall user benefit to consulting traveler information is quite modest, but that information can be of great value for certain types of trips, particularly those of high traffic variability and time sensitivity. When an attempt is made to consult information, no information may be available for the trip in question, or it may not be detailed or accurate enough to be useful in making decisions. Even when learning of delays, travelers may have (or feel that they have) no real alternatives for changing their trip or route.
A similar study comparing responses from motorists in Seattle and Los Angeles to online traffic information also revealed that location matters, as motorists in Los Angeles experience significantly longer commutes and greater congestion and volatility in traffic conditions. While motorists in both regions gave positive assessments of the traffic Web sites, Seattle respondents were more enthusiastic. On several dimensions, Seattle respondents expressed more intense support for their site. Moreover, Seattle motorists were more likely to benefit from the service, with greater numbers agreeing that online traffic information saved them time and reduced the stress of traveling. An analysis of the data indicates that underlying traffic conditions in the two regions bear greatly on customers’ responses to the service. The greater congestion and volatility in Los Angeles increase motorists’ demand for up-to-the-minute information and undermine customers’ expectation that any information service can provide much relief (100).
One of the interesting findings from both studies is that television and radio remain the predominant sources of traffic information—even though Internet and mobile devices have become so ubiquitous and pervasive.
In a survey performed among Seattle-area travelers, researchers found that less than half of the respondents were aware of the fact that traffic information was available through Internet Web sites and only 22 percent had used the service, while more than 95 percent of the respondents were aware of similar traffic information being provided by television and radio, and more than 60 percent used one or both information sources (99). Hence, it would be safe to say that the majority of travelers at present probably use radio and television to obtain information about border crossings rather than Internet or mobile devices. Quantification of effectiveness of providing advanced traveler information about border crossings, both pre-trip and en-route, is still elusive even though its benefit is not doubtful.
Archived Data Management
One of the features of an ITS is the large amount of data it produces. Archived ITS data have a tremendous value in planning infrastructure, measuring performance, and evaluating strategies and management decisions. However, archived ITS data are greatly underutilized by agencies, mostly due to complex data transformation (hence, the cost and labor) required to convert the data into usable information. It is important to note that the archived data should not be limited to the data collected by ITS at the border but should also include data collected using non-ITS methods such as intercept surveys and manual data collection.
A centralized repository of archived data would significantly reduce data redundancy, reduce data collection and storage cost, and increase efficiency of data retrieval. A centralized repository would also be responsible for maintaining and updating the data on behalf of all participating stakeholders. As Figure 10 illustrates, a proposed border-crossing information system should provide a centralized repository of archived data and enhance the data by aggregating in different spatial and temporal granularity (55). In addition, users can obtain archived data from a single repository instead of multiple agencies, thereby reducing overall cost and increasing efficiency of data retrieval.
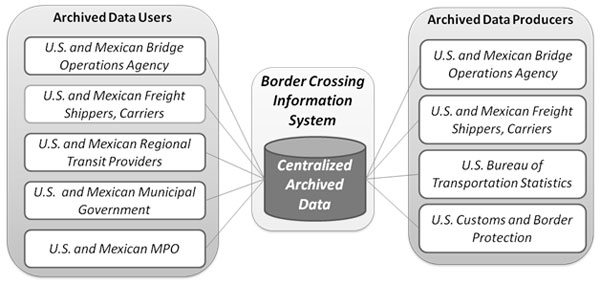
Figure 10. Diagram depicting the proposed centralized repository of archived border-crossing data.
Use of Archived ITS Data for Border Infrastructure Planning and Operation
It is well-known that archived border-crossing data are used by private and public agencies with responsibilities to plan, operate, and manage border-crossing infrastructure. However, limited studies have been performed to document how agencies archive and use archived ITS data for planning and operational purposes. Archived data are then used by agencies, such as metropolitan planning organizations, city agencies, CBP, and the General Services Administration (GSA), to plan future infrastructure improvements and manage resources to operate border crossings efficiently. Private travelers, freight shippers, and carriers may use the archived data in limited scope.
Local and regional agencies such as metropolitan planning agencies use archived border-crossing data, especially volume, to develop near- and long-term regional travel demand models. In these models, border crossings are treated as external zones. Table 26 lists agency use of archived border-crossing data.
Interviews with several MPO personnel revealed that MPOs’ need for highly granular border-crossing data is unmatched by other types of State and local agencies. MPOs’ use of archived data for demand modeling ranges from hourly volume to annual volume trends. They also use hourly volumes for model calibration, which is crucial for simulation of traffic around border crossings. MPOs, however, do not have access to continuously accessible finely granular data and have to rely on short project studies to obtain such data. In addition to volume of vehicles in both directions, MPOs also need information such as queue lengths, wait times, and crossing times. This information is normally obtained by a short period of data collection at the border.
In addition, none of the agencies listed in table 26 has developed specifications and requirements for archived border-crossing data in terms of accuracy, reliability, scope, and usability.
| Agency | Current Application | Data Types Archived | Data Types Required for Archival | Future Applications |
|---|---|---|---|---|
| TxDOT (50) | Project-driven studies, project planning, funding requests | Monthly volume of northbound vehicles | Smaller temporal granularity volume, wait times, crossing times | Project-driven studies |
| El Paso MPO (53) | Project-driven studies, saturation counts for travel demand modeling | Monthly volume of northbound vehicles | Smaller temporal granularity volume, wait times, crossing times | Identification of peak periods for calibration of travel demand models |
| IMIP | Not available | Not available | Not available | Not available |
| NMBA (101) | Project-driven studies, project planning, funding requests | Daily, weekly, monthly volume of northbound vehicles | Wait times, crossing times | Project-driven studies |
| Las Cruces MPO (101) | Project-driven studies, saturation counts for travel demand modeling | Monthly volume of northbound vehicles | Wait times, crossing times | Project-driven studies |
| NMDOT (101) | Project-driven studies | Monthly volume of northbound vehicles | Wait times, crossing times | Project-driven studies |
| ADOT | Not available | Not available | Not available | Not available |
| SANDAG | Not available | Not available | Not available | Not available |
| Caltrans | Not available | Not available | Not available | Not available |
| SCAG | Not available | Not available | Not available | Not available |
Note: SCAG: Southern California Association of Governments
The deployment of ITS at border crossings has increased the possibility of collecting border-crossing-related data to support a set of performance measures and ultimately a performance management process for evaluating and improving international border crossings for freight as well as passenger movement. Such performance measures apply to:
- Compare border-crossing performance nationally.
- Take into account local operation of crossings.
- Derive from a system to provide travel time information to travelers and shippers.
- Apply archived travel time data and travel time reliability information.
- Consider causal data that explain the differences in travel time.
- Reflect changes in operating practices and infrastructure at individual crossings.
The unique elements of the border-crossing system mean that the performance measure must satisfy the typical measurement requirements as well as several factors, as described earlier. Given the wide range and diversity of available measures, it is important to have a clear basis for assessing and comparing border-crossing performance measures. However, collection and estimation of border-crossing performance measurement indices should consider the following:
- Performance measures should be calculated from operational and policy data that are collected as part of daily operations.
- Performance measures should be consistent with the procedures used by all three countries at the international borders.
- The levels of performance are perceived differently by shippers, manufacturers, crossing operators, and inspection agencies. Thus, statistics should be relevant for the variety of audiences. This will require that the measurement base lines or comparison standards be evident or easily communicated.
- Changes in designs, demand, and operating procedures at individual border crossings should be reflected in the performance measure.
- Estimation of performance measures should be independent of the data collection technology used to collect travel-time-related parameters.
One of the major parameters to measure performance at border crossings should be related to travel time for both freight and passenger movement, which would be a basis for establishing common indices to compare performances of border crossings throughout the U.S.-Mexico and U.S.-Canada borders, irrespective of characteristics of individual crossings.
However, the literature review and the subsequent interviews with officials from various agencies revealed that none of the transportation agencies in border regions has adopted performance measures at border crossings. Most agencies use annual volume trend as a de facto performance measure. These agencies did express interest in adopting travel-time-based performance measures of border crossings if such data were available.
Existing and Planned Sources of Archived Border ITS Data
The Bureau of Transportation Statistics (BTS) maintains a centralized repository of border-crossing-related data, which can be accessed through a public-domain Web site. Tables 27 through 29 lists type and scope of border-crossing-related data for commercial vehicles, passenger vehicles, and transit and pedestrians respectively, provided by the BTS. However, data available from the BTS are highly aggregated (monthly and annually) by port group instead of by individual border crossing. For example, border wait times at POEs (collected by the CBP) available from the BTS are averaged monthly for a particular port group. In a port group, there may be some crossings that are rarely congested and some that are almost always congested. Also, from an operational standpoint, monthly averages of border wait times are not useful and lack information such as hourly fluctuations. In addition, agencies such as MPOs that analyze the impact of border-crossing trends to plan for short- and long-term infrastructure improvements require highly disaggregated border-crossing data in terms of type of transportation modes and vehicle entry programs. Highly aggregated data are not adequate for these agencies to understand hourly and daily trends at individual border crossings.
| Type of Data | Data Scope |
|---|---|
| Volume | Only northbound monthly and yearly total data for each POE starting in 1994 |
| HAZMAT | Only northbound monthly and yearly total data for each POE starting in 1994 |
| Travel Time of Segments Entering and Exiting POE | Not available |
| Number of Trips and Average Travel Time of Trips within the Region | Not available |
| Distribution of Ultimate Origin-Destinations of Trucks | Not available |
| Export and Import Value by Origin Port and Destination State | Monthly and yearly total data for each POE starting in 1994 |
| Export and Import Volume by Origin Port and Destination State | Monthly and yearly total data for each POE starting in 1994 |
| Import and Export Value by Commodity and Mode | Monthly and yearly total data for each POE starting in 1994 |
| Type of Data | Data Scope |
|---|---|
| Volume | Only northbound monthly and yearly total data for each POE starting in 1994 |
| Travel Time of Segments Entering and Exiting POE | Not available |
| Vehicle Occupancy | Not available |
| POE Preference | Not available |
| Length of Stay | Not available |
| Frequency of Trips | Not available |
| Type of Data | Data Scope |
|---|---|
| Volume | Only northbound monthly and yearly total data for each POE starting in 1994 |
| Trip Purpose | Not available |
| Frequency of Trips | Not available |
| North and Southbound Volume | Only northbound monthly and yearly total data for each POE starting in 1994 |
| North and Southbound Bus Passengers | Only northbound monthly and yearly total data for each POE starting in 1994 |
In 2003, both the BCMoT and WSDOT installed Advanced Traveler Information Systems (ATISs) for passenger cars at the Blaine-Pacific Highway and Douglas (Peace Arch) border crossings. The systems use loop detectors to estimate the wait times for cars crossing the border in both directions. The collected data are archived and available online at http://www.cascadegatewaydata.com/. Measures of delay, queue length, number of vehicles in the queue, traffic volume, and number of vehicles departing the queue per five minutes can be viewed online or downloaded for further analysis (64). The archived data are aggregated into different temporal granularities such as hourly, daily, and monthly.
Technical Issues Related to Border ITS Data Archiving
Agency Deployment of Border-Crossing Data Archive
Archived data in ITSs refers to the systematic retention and re-use of transportation data generated for various purposes (102). Data archiving is also referred to as data warehousing or operations data archiving. Sensors and detectors used in ITS deployments produce a huge amount of data, which have to be converted into information for effective use of the data. To achieve this, the raw data have to be archived, filtered, and aggregated into useful information. Only then can archived data be used in managing existing and planning future infrastructure.
The widespread deployment of vehicle detectors and sensors by State and local DOTs has created a massive amount of raw data. Agencies mostly use the aggregated data, such as daily and annual volume of vehicles, for project design, studies, and other planning purposes. However, archived data have many other benefits, such as real-time operation of transportation infrastructure, real-time decision making, performance evaluation monitoring, environmental analysis, and theoretical research. Even though these benefits are obvious to the agencies, very few of them have implemented a well-structured data archiving program. While deploying ITS, many agencies do not prioritize archived data and mostly focus on operational benefits of real-time data. There are several reasons why agencies do so:
- Agencies are mostly focused on day-to-day operations and do not see the utility of archiving the raw data (102).
- Planning/decision-making bodies of agencies are not familiar with ITS deployments and their products and thus may not know the full extent of the benefits of archived data or the capabilities they offer.
- There are limited resources to operate and maintain archived data.
- Most importantly, agency personnel are not fully aware of strengths and benefits of archived ITS data.
Development and maintenance of a border-crossing data warehouse, whether small or large, requires highly skilled resources, continuous funding, and – most of all – support from the stakeholders.
Existing and Planned Border-Crossing Data Warehouses
One of the earliest deployments of archived border-crossing data was implemented by the Whatcom Council of Governments (WCOG) in 2002. The system is referred to as the Cascade Gateway Border Data Warehouse and was designed to archive real-time traffic data from the Cascade Gateway system of border crossings on the U.S.-Canada border (64). The archived data in the data warehouse is managed by the WCOG. ITS data are supplied to the data warehouse by the BCMoT on the Canadian side and WSDOT on the U.S. side. Both agencies operate independent systems, which include a series of inductive loop detectors. The data from them are used to calculate traffic volumes and arrival rates and estimate wait times of passenger vehicles. One of the challenges facing the Cascade Gateway Data Warehouse has been retaining highly skilled database administration and software developers to maintain the warehouse.
The Center for International Intelligent Transportation Research at TTI developed the Paso Del Norte Regional Mobility Information System (PDN-RMIS), which has been in operation since 2007 (103). The system not only provides real-time traffic conditions and border-crossing information to motorists in the El Paso region but also provides archived data from various ITS devices deployed in the region. The system archives border-wait-time-related data relayed by the CBP. The data include delay and number of lanes open for commercial and passenger vehicles. The system also archives external information such as weather, daily exchange rate, messages relayed by VMSs, and incident locations.
TTI, with funding from the FHWA, is developing a separate archived data warehouse that will include crossing and wait-time data from various ITS deployments on the U.S.-Mexico border. The information system is named the Border Crossing Information System (BCIS).
Table 30 includes types of data, spatial and temporal granularity, and data storage-related information from the above-mentioned data warehouses.
| Agency | Data Type | Spatial Granularity | Temporal Granularity | Level of Data Filtering and Aggregation | Data Storage Medium | Frequency of Data Retrieval | Archived in Database or Flat Files | Frequency of Data Purging |
|---|---|---|---|---|---|---|---|---|
| PDN-RMIS (103) | Wait times relayed by CBP, exchange rate, weather | Crossing, lane type, vehicle type | Hour | Not filtered, aggregated | Hard drive inside servers | Every 15 minutes | Database | No established policy, raw data have never been purged |
| WCOG (64) | Departure rate, volume, queue length, delay, wait time for personal vehicle and commercial vehicle | Crossing, detector, lane, route, direction | Minutes, hour, day, month, year | Aggregation includes summation, average, minimum, maximum, standard development | Hard drive inside servers | Five-minute increment data sent by BCMoT and WSDOT | Database | No established policy |
Temporal and Spatial Granularity
Granularity refers to the level of detail of the data archived. High granularity refers to data that are at or near the transaction level or raw data. Low granularity refers to data that are summarized or aggregated. Granularity of archived data is directly proportional to the size of the data warehouse and thus the cost of maintaining the system. The higher the granularity, the more storage space required to archive the data. In addition, the higher the granularity, the more rows (records) that constitute tables, results in additional storage requirements with impact on performance.
Data warehouses mentioned above store data in various temporal granularities—mostly in minutes, hours, days, months, and years. However, there are no guidelines and standard procedures regarding granularities of the archived data. In most cases, the decision to create and maintain certain levels of temporal granularity of data depends on aggregated data needs. For example, for many traffic studies, vehicle volume is required at 15- and 60-minute periods. Raw data from vehicle sensors often come in less than 1-minute packets (i.e., aggregated in less than 1 minute), which is used to create 15-minute and 60-minute data. Thus, the data warehouse includes multiple levels of temporal granularities because there is computing overload if 1- or 15-minute data are used every time users query for 60-minute data.
The raw data as they are archived represent the highest granularity in terms of space (i.e., spatial granularity). For example, data from one or more detectors from a single location represent the highest granularity data. Data from more than one location can be aggregated to obtain information about longer roadway segments. In terms of border crossings, the smallest spatial granularity should be an individual border crossing, and the highest should be individual lane type (e.g., SENTRI or FAST). The Cascade Gateway Data Warehouse archives vehicle detector data by individual detector, lane, route, and direction and wait times by individual lane type, direction, and border crossing.
Size and Scope of ITS Data
Archived data should be most preferably implemented in a data warehouse architecture. This allows systematic retention, processing, and management of a large amount of ITS data. This will also allow multiple types of border-related data to be stored in a relational database structure. For example, wait times and crossing times of vehicles can be related to volume of vehicles and external factors such as fuel prices and exchange rates. A data warehouse architecture is suitable to archive voluminous data and is not suitable to store transactional data that need to be accessed by hundreds of users at the same time for their daily work. The Cascade Gateway Data Warehouse and Paso Del Norte Regional Mobility Information System (PDN-RMIS) have grown significantly in size.
All of the above-mentioned data warehouses do not have policies to limit the scope of ITS data to be archived. Depending on availability of resources to manage the data warehouse and the ability to acquire storage space size and scope of ITSs, the amount of data is not of great concern. However, the data should be the ones that can be used to measure operational performance of border crossings.
Latest generation database servers allow storage of geospatial data and allow users to perform spatial query. GPS data from vehicles can be easily archived and processed to obtain border-related information and related with data from other ITS devices.
Data Filtering and Aggregation
Data filtering is crucial to impose appropriate quality control over the data. Data filtering needs to occur at different levels of aggregation and should include removal and reporting of erroneous data, imputation or removal of missing data, and removal of inaccurate data. Causes of erroneous/missing/inaccurate data occur very frequently and are mostly due to such things as equipment failures, telecommunication failures, and equipment calibration errors.
Many ITS devices can sense equipment errors and have capabilities to flag such errors along with the data that are transferred. These errors are easy to identify and remove prior to further aggregating. Correcting missing data due to equipment and telecommunication failure can be easy or extremely complex and depends on the span for which the data are lost. It is preferable to define algorithms to impute missing data and have them implemented in the data warehouse. Identifying systematically produced inaccurate data due to equipment calibration errors is difficult early on because the data may have very subtle differences from the true data. In such cases, it will be difficult to flag the raw data as erroneous. Business intelligence tools are used to identify subtle differences in raw and aggregated data.
On the other hand, quick notification of an erroneous data stream to the system administrator will help identify hardware- and software-related problems. Thus, mechanisms should be put in place to notify the system administrator if erroneous data are coming from field devices or if failure of hardware/software occurs. One should bear in mind that sizable resources are required to establish robust filtering algorithms in the data warehouse.
In the end, all archived data user services should have mechanisms to report quality of data that are relayed to the end users.
Data aggregation depends on the need for different levels of spatial and temporal granularity. Typically, algorithms should be included in the data warehouse to periodically aggregate the data (at pre-defined time intervals), or algorithms should be triggered when new data enter the data warehouse. Both techniques have advantages and disadvantages and trade-offs in the form of performance and computing overhead.
Data aggregation at predefined times should be performed when the system is not being used heavily, such as nighttime or off-peak periods. If the aggregation requires processing a huge number of records, this technique is also efficient. Publishing daily, weekly, or monthly data can be done with some time lag, and the algorithm does not need to run every time new data enter the database. On the other hand, publishing real-time information such as current crossing time or predicted crossing time for next hour aggregation and processing of data should take place as soon as new data become available.
Data Storage Management
One of the greater concerns of archived data is to determine the length of time data need to be archived and the threshold for physical size archive. The length of time data are stored is obviously dependent on the temporal granularity of data, which has an impact on the record size and storage space. Smaller granularity data require less storage space compared to raw data. However, a database with raw data that have grown substantially over the years poses performance-related problems. Thus, two things need to happen: development of policies to purge raw data after a certain time has elapsed and/or movement of the raw data to a separate and independent physical storage medium (e.g., DVD or magnetic tapes). However, there is reluctance in purging raw data due to fear of losing aggregated data. Maintaining only aggregated data in the core database will undoubtedly result in improved performance, especially when end users query the data.
previous | next