
More and more, transportation system operators are seeing the benefits of strengthening links between planning and operations. As noted on the FHWA Planning for Operations web site,
Linking planning and operations is important to improve transportation decision-making and the overall effectiveness of transportation systems. Coordination between planners and operators helps ensure that regional transportation investment decisions reflect full consideration of all available strategies and approaches to meet regional goals and objectives (Federal Highway Administration, accessed January 2009, [online] available at http://www.plan4operations.dot.gov).
A critical element in improving transportation decision-making and the effectiveness of transportation systems related to operations and planning is through the use of analysis tools. The use of the term “Tools” in this context is meant not only to include physical software and devoted analytical applications, but also more basic analysis methods and procedures as well. The intent of this brochure, and four accompanying case study brochures, is to help planners and operations professionals use existing transportation planning and operations analysis tools and methods in a more systematic way to better analyze, evaluate, and report the benefits of needed investments in transportation operations, in order to make the overall transportation system work better.
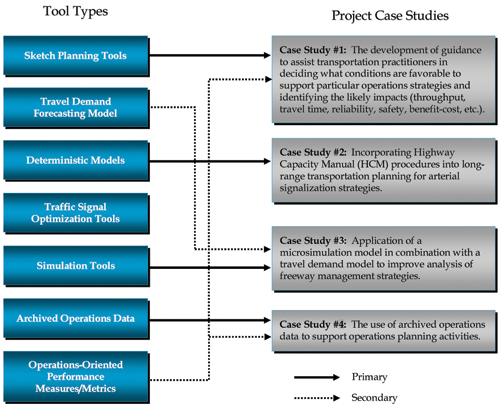
 flowchart - The figure shows that the four case studies represent a variety of the traffic analysis tool types. Each case study supports a primary tool type and several also support multiple case studies. Case study number one, Operations Strategy Impact Reference and Deployment Guidance, primarily supports the sketch planning tool type and it also includes operations-oriented performance measures/metrics as a secondary tool type. Case study number two, Incorporating Highway Capacity Manual Procedures into Long-Range Transportation Planning, primarily supports the deterministic models tool type. Case study number three, Using Archived Data As a Tool for Operations Planning, represents the archived operations data tool type. It also includes operations-oriented performance measures/metrics as a secondary tool type. Case study number four, Application of Microsimulation in Combination With Travel Demand Models, primarily supports the simulation tool type. It also includes travel demand forecasting model tools as a secondary tool type.
Case Study Assessments A series of four case studies supplement this brochure and provide some examples of available analysis tools and innovative methods that can be used to more closely link planning and operations. The case studies include guidance, the analysis approach used, and feasibility on how practitioners may implement similar processes in their own regions. Further information on these innovative methods can be obtained at http://www.plan4operations.dot.gov/casestudies/analysis.htm. |
Analysis tools are vital for providing objective assessments of transportation investments and performance. The following are some of the key benefits for using analysis tools to link planning and operations:
The analysis tool used should be consistent with the plan's objectives and matched with budget and resource requirements. There is no one analytical tool that can do everything or solve every problem.
Some agencies have been working toward an integrated approach to planning for operations for some time, some are just getting started, and others do not know where to begin. In current practice, most planning and operating agencies are using some combination of the following methods and tools (Federal Highway Administration, June 2004, Traffic Analysis Toolbox, Volume II: Decision Support Methodology for Selecting Traffic Analysis Tools, Publication No. FHWA-HRT-04-039, [online] available at https://ops.fhwa.dot.gov/trafficanalysistools/index.htm):
Operations Strategy Impact Reference and Deployment Guidance A case study was conducted to assemble operational strategies impact data and deployment guidance into a spreadsheet format that was readily accessible and could easily be utilized by practitioners. Two separate spreadsheets were developed based on readily available data by various agencies: 1) Impacts Summary - high-level summaries of the likely impacts of operational strategies on various performance measures; and 2) Deployment Guidelines - guidance on specific thresholds or rules-of-thumb that have been developed to help practitioners identify conditions that warrant deployment of particular operations strategies. The spreadsheets are reproduced available at http://www.plan4operations.dot.gov/casestudies/analysis.htm. Some examples of potential use: Justify operations investments - Our region is interested in ramp metering but is concerned with potential impacts on safety. Our region is similar to Minneapolis and based on the impact summary, annual accident rate decreases by 37.9 percent for the peak period for traffic actuated ramp metering, providing us with additional justification for deploying ramp metering. Validate benefit/cost analyses - Based on nine real-world evaluations of incident management systems, the benefit-cost ratios ranged from two to 30 with an average of 17, our value of 12 is within the range. Modifying default values in tools or methods for analyzing operational strategies – We are using IDAS to analyze incident management. We conducted an evaluation of three incidents and found that our reduction in incident duration is 22.5 percent. We will use 22.5 for the value in the tool rather than the 55 percent default based on other real-world evaluation studies. Where to deploy equipment – For example, in rural areas, a CMS should be located at severe weather regions or upstream of major decision points. |
Sketch-planning methodologies and tools produce general order-of-magnitude estimates of travel demand and traffic operations in response to transportation improvements. Sketch-planning tools perform some or all of the functions of other analytical tools using simplified analytical techniques and highly aggregated data. Sketch-planning approaches are typically the simplest and least costly of the traffic analysis techniques, but are usually limited in scope, analytical robustness, and presentation capabilities. The ITS Deployment Analysis System (IDAS), Screening for ITS (SCRITS), and Surface Transportation Efficiency Analysis Model (STEAM) are three popular examples of sketch planning tools. Another sketch method is the use of the ITS Benefits Database (http://www.itsbenefits.its.dot.gov/). Several agencies have used the results from evaluations and studies documented on this web site to justify investments in operational and intelligent transportation system (ITS) strategies.
Example Impact Summary for Traffic Actuated Ramp Metering
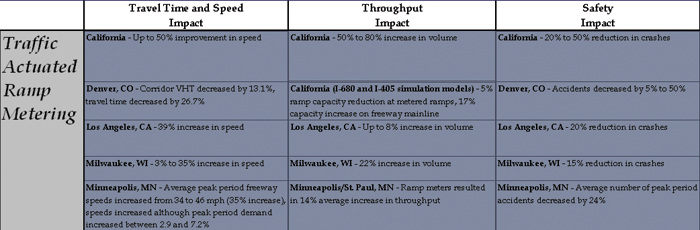 spreadsheet screenshot - The figure shows a partial view from a Microsoft Excel spreadsheet showing some of the contents of the impact summary spreadsheet developed for case study #1. The impact values shown are for performance measures such as travel time and speed, throughput, safety, customer satisfaction, and cost impacts associated with various ramp metering deployments.
Sample View of Deployment Guidelines Structure
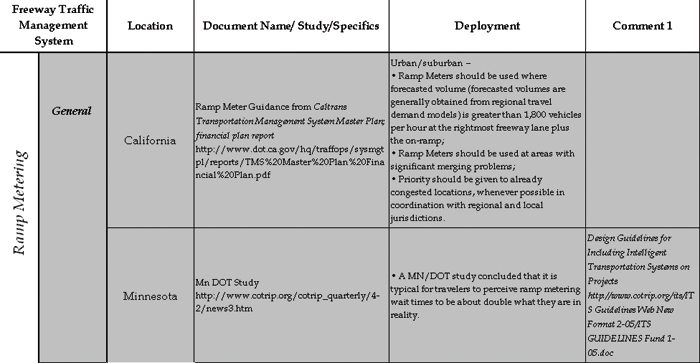 spreadsheet screenshot - The figure shows a partial view from a Microsoft Excel spreadsheet showing some of the contents of the deployment guidelines spreadsheet developed for case study #1. The deployment guidance shown is related to ramp metering, and reference specific documents, deployment guidance, and general comments.
Incorporating Highway Capacity Manual Procedures into Long-Range Transportation Planning The objective of this case study was to introduce operations considerations into the long-range transportation planning process in a largely automated way, allowing more detail to be built into the model without overly increasing the work effort involved. The case study focused on two specific ways that Highway Capacity Manual (HCM) procedures can be applied to regional travel demand modeling and long-range planning. The first application addressed the way that segment capacities are modeled. The second application tested “what-if” operations scenarios that cannot be readily tested within the regional model, such as changing the amount of green time allocated to through movements. The Wasatch Front Regional Council (WFRC) tested the applications developed through this case study on their Long Range Transportation Planning Model. While WFRC found the applications useful to examine and adjust corridor capacity by varying cycle length, green splits, number of through lanes, free flow speeds, or median type, they also identified challenges. The case study met the overall goal of a proof-of-concept for incorporating operations calculations into a long-range transportation planning model in a largely automated way. The case study also demonstrated how different operations scenarios, such as changing the number of lanes or intersections green times, could be evaluated and the resulting capacity results sent back to the model for use in follow-up model runs. |
Most analytical/deterministic tools implement the procedures of the Highway Capacity Manual (HCM). The HCM procedures are closed-form (a practitioner inputs data and parameters and, after a sequence of analytical steps, the HCM procedures produce a single answer), macroscopic (input and output deal with average performance during a 15-minute or a one-hour analytical period), deterministic (any given set of inputs will always yield the same answer), and static (they predict average operating conditions over a fixed time period and do not deal with transitions in operations from one system state to another). These tools quickly predict capacity, density, speed, delay, and queuing on a variety of transportation facilities and are validated with field data, laboratory test beds, or small-scale experiments. Analytical/deterministic tools are good for analyzing the performance of isolated or small-scale transportation facilities; however, they are limited in their ability to analyze network or system effects. Two examples of deterministic models are Traffix and Highway Capacity Software (HCS). The Traffix software can conduct traffic impact analysis of new developments, calculate Level of Service (LOS) at critical signalized and unsignalized intersections, test different mitigation measures, and determine traffic impact fees for individual development projects. HCS implements the procedures defined in the Highway Capacity Manual (HCM 2000) for analyzing capacity and determining LOS for signalized and unsignalized intersections, urban streets, freeways, weaving areas, ramp junctions, multilane highways, two-lane highways, and transit.
Travel demand models have specific analytical capabilities, such as the prediction of travel demand and the consideration of destination choice, mode choice, time-of-day travel choice, and route choice, and the representation of traffic flow in the highway network. These are mathematical models that forecast future travel demand based on current conditions and future projections of household and employment characteristics. Travel demand models were originally developed to determine the benefits and impact of major highway improvements in metropolitan areas. Travel demand models are intended for planning purposes so they limited in their ability to predict operational design characteristics (such as speed, delay, and queuing) resulting from implementation of operational strategies. Similar to deterministic tools, travel demand models tend to be static and do not represent the dynamic nature of traffic that are available from simulation tools. There are many types of travel demand forecasting models available, including TRANPLAN, EMME/2, TransCAD, and Cube. Forecasting models are being used to assess needs for long-range planning, transportation conformity, project evaluations, and regional air quality analyses.
Agencies use simulation tools to analyze operations of both transit and traffic to conduct needs assessments, alternatives analysis, environmental impact studies, and operations planning. Simulation tools may include microscopic simulation, mesoscopic simulation, or macroscopic simulation.
Innovative Integrated Applications of Travel Demand Models and Microsimulation Models The next case study looked at two alternate ways of combining microsimulation models with travel demand models. While travel demand models reasonably forecast travel demand patterns which reflect a certain level of route diversion due to capacity constraints, they often fail when analysts assign trip tables representing high demands resulting in significant over-capacity conditions. In the first application, the travel demand model is used to estimate existing and future origin-destination (OD) demands for a freeway section. The microsimulation model is applied using the adjusted calibration year and future year OD tables. The freeway performance is estimated exclusively using the microsimulation model. Subsequently, a different approach was used in applying the travel demand model and microsimulation model. The goal of this more innovative approach to combining travel demand models with microsimulation is to reflect the effects of downstream weaving and queuing on upstream locations (the output of the microsimulation model) within the travel demand model itself. |
The most widely available and used form of archived data are from traffic surveillance equipment on freeways, typically volumes, speeds, and lane occupancies from point-based detectors, spaced anywhere from one-third to one mile. Additional forms of archived data include travel times derived from probe vehicles, cell phone tracking, and toll tags or safety data. Archived data can be used by planning agencies to:
Having effective analysis tools and performance measures that estimate the impacts of operational improvements enables planners to compare and prioritize investment strategies and communicate the benefits to decision-makers. Traditional planning methods are not typically sensitive to many of the benefits derived from operational improvements (e.g., reduction in non-recurring delay and crashes)
and are limited to studying operational treatments that improve base capacity (e.g., ramp meters, signal timing). However, there are some sketch planning tools that are designed specifically to assess ITS and operational impacts and many simulation tools have the capability. In addition, more agencies are recognizing the need to expand the performance measures used to evaluate transportation investments,
and are incorporating more operations-oriented measures into their planning process.
Using Archived Data as a Tool for Operations Planning The objective of this case study was to document the findings and results of an effort to use archived data for operations planning, and to summarize the successes and challenges associated with the work. The project used for this case study was the San Francisco Metropolitan Transportation Commission’s (MTC) Freeway Performance Initiative (FPI), corridor studies used to develop a roadmap for the selection of the best projects and operational strategies in the region based on performance and cost-effectiveness. The focus of the case study was on the use of archived data for the existing conditions analyses. The participating agency in this case study, MTC, launched an FPI program and due to time and budget constraints, the existing conditions analysis relied heavily on archived data. A variety of archived data were used, including PeMS, the MTC 511 system, HICOMP, TASAS, historical probe vehicle runs, and traffic counts. The archived data sets were used to analyze multiple performance measures, which included travel time, speed, delay, travel time reliability, safety, and productivity. MTC is planning to advance its efforts of applying archived data to operations planning by improving detector coverage, detector health, and PeMS usability. MTC will continue using archived data for planning studies, including bottleneck identification, queue length, queue duration, travel times, speeds, volumes, and accident analysis. |
Traffic optimization tool methodologies are mostly based on the HCM procedures and are primarily designed to develop optimal signal phasings and timing plans for isolated signal intersections, arterial streets, or signal networks. This may include capacity calculations; cycle length; splits optimization, including left turns; and coordination/offset plans. Some optimization tools can also be used for optimizing ramp metering rates for freeway ramp control. More advanced traffic optimization tools are capable of modeling actuated and semi-actuated traffic signals, with or without signal coordination. Four such tools are Synchro, Transyt-7F, SOAP, and PASSER. Traffic engineers generally determine which optimization tool is best depending on the goal of the traffic signal timing study, network conditions, and data availability.
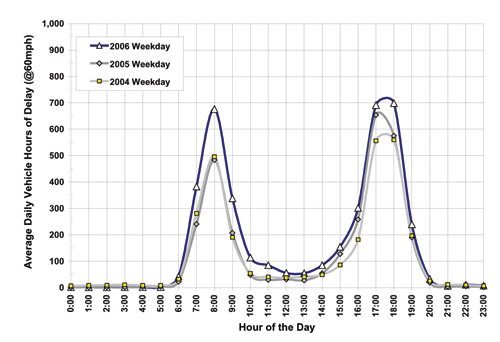 graph - This figure is for the San Mateo/Santa Clara US-101 corridor using data from PeMS. It presents a summary of the northbound average weekday hourly delay for the three years analyzed, 2004 to 2006. 2004 data are shown in light gray, 2005 in dark gray, and 2006 in blue. This exhibit is useful in that it shows the peaking characteristics of congestion and how the peak period is changing over time. This graphic shows that the peak periods are shifting toward the midday period and that average delay is increasing. In each year, delay was near zero until 6:00 and after 20:00. The morning peak period was relatively unchanged from 2004-2005 at 500 hours, but rose to approximately 700 hours in 2006. The afternoon peak period changed slightly from 2004-2005, from approximately 580 to 650 hours, and higher still in 2006, to about 720 hours. Delay between the peak periods also increased over time, and were between 50 and 100 hours.
There is no one analytical tool that can do everything or solve every problem. The method or tool selected for any analysis should be consistent with planning objectives and matched with budget and resource requirements. Time constraints and budget factors must be considered, as does data needs and availability. Using too sophisticated a tool may result in poor use of resources (e.g., use of microsimulation for a preliminary screening of scenarios). However, using a less demanding tool in circumstances that require a particular type of analysis may result in inaccurate or unreliable results (e.g., use of a travel demand model for traffic signal optimization). Finding the right tool(s) requires careful consideration. The following suggests ways to match transportation planning needs with the appropriate operational analysis tools and methods.
As described earlier, there are several categories of tools and methods available (i.e., sketch planning tools, travel demand forecasting models, deterministic models, simulation, etc.). These methods vary in purpose, complexity, input/output data, and strategies analyzed. In addition, not all tools fit neatly into these general categories. Some tools may combine capabilities of several different categories (e.g., IDAS is a hybrid between a sketch planning tool and a travel demand forecasting model). Furthermore, some tools, when integrated, apply to many transportation planning needs.
Table 1 maps typical transportation planning needs with operational analysis tools and methods that may be appropriate. The mapping is meant as a general guideline and suggests strategies in line with common practice. As there are advantages and challenges to using each type of tool, a careful analysis should be done to decide which tool or method to use on a case-by-case basis. Factors, such as technical complexity, available time, budget, and data resources, will aid in the process of determining which method is best.
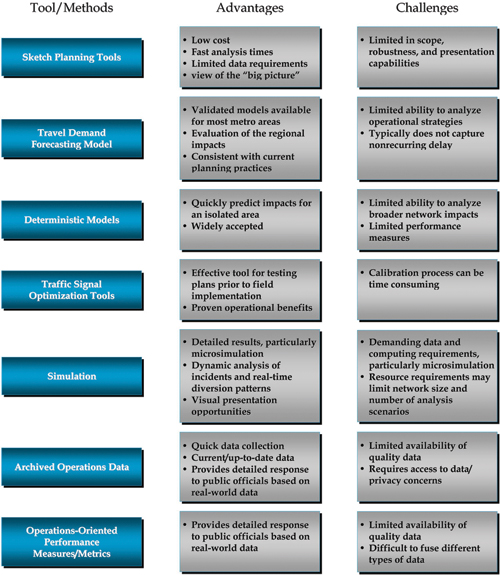
As evident in Table 1, most planning needs may be addressed with more than one operations planning tool/method. To narrow down the options, the basic advantages and limitations for each tool type should be taken into consideration. This information is summarized in Table 2. The available data, desired outputs, target audience for the results, geographic scope, facility type, mode of travel, and the strategies being evaluated will need to be carefully considered when selecting the right tool/method.
The Traffic Analysis Toolbox Volume II: Decision Support Methodology for Selecting Traffic Analysis Tools spreadsheet tool available at https://ops.fhwa.dot.gov/trafficanalysistools/index.htm provides a method to help practitioners select the most appropriate tool(s) for the task at hand.
Texas DOT Testimonial Regarding the Use of An Analysis Tool We were able to provide better sequencing to the contractor and therefore reducing the queuing or the traffic congestion. We were able to give him actual times as far as when he could go in and set up different traffic control plans and at the same time, we were able to provide the information to our city engineers, our co-partners in this particular project, and ask him to go ahead and optimize traffic signals on the other parallel routes, therefore, reducing congestion and, at the same time, reducing the frustration of our traveling public. Further information can be obtained at https://ops.fhwa.dot.gov/trafficanalysistools/videos/leos_transcript.htm. |
The Traffic Analysis Toolbox defines several criteria necessary to help identify the analytical tools that are most appropriate. The criteria include:
Table 1. Transportation Planning Needs and Operational Analysis Tools
Transportation Planning Needs |
Operational Analysis Tools/Methods | ||||||
|---|---|---|---|---|---|---|---|
| Sketch Planning Tools | Deterministic Models | Travel Demand Forecasting Models | Simulation | Archived Operations Data | Operations-Oriented Performance Metrics | Traffic Signal Optimization Tools | |
| Needs Assessments/ Deficiency Analysis | no |
yes |
yes |
yes |
yes |
yes |
yes |
| Preliminary Screening Assessments | yes |
no |
no |
no |
no |
yes |
no |
| Alternatives Analysis | yes |
no |
yes |
yes |
no |
yes |
no |
| Strategic ITS Planning | yes |
no |
yes |
no |
no |
yes |
no |
| Project Scoring/ Ranking/ Prioritizing | no |
yes |
yes |
no |
no |
yes |
no |
| Corridor and Environmental Analysis | no |
yes |
yes |
yes |
no |
yes |
yes |
| Planning for Nonrecurring Congestion | yes |
no |
yes |
yes |
yes |
yes |
no |
| Performance Monitoring | no |
yes |
no |
no |
yes |
yes |
yes |
| Evaluations of Developed Projects | yes |
no |
yes |
no |
yes |
yes |
no |
Table 2. Advantages and Challenges of Operational Analysis Tools
An operations investment typically requires not only capital, but also ongoing operational and maintenance costs. In competing for funds, it is particularly important to identify management and operations costs for a project along with a justification for these funding needs. Having tools or methods to identify the costs and validate these needs would be valuable in ‘selling’ an operations project. Accurately estimating and allocating life-cycle costs upfront helps to ensure that transportation goals can be achieved.
There are resources available to help estimate the life-cycle costs associated with operations. For operations costs associated with ITS or operations improvements, one such resource is the ITS Costs Database (www.itscosts.its.dot.gov), a web site designed to provide easy access to data for use in developing cost estimates of ITS deployments. Estimates for operations costs, maintenance costs, and capital costs are provided individually, along with the average service life (in years) of each system component. In addition, the cost module in the sketch planning tool IDAS is consistent with the ITS Costs Database and provides life-cycle cost estimates for ITS investments.
Performance measures are a critical component of both planning and operations. In addition to providing information on current conditions, performance measures can be used to evaluate the success of implemented projects, provide insight into expected future conditions, and compare various potential transportation improvement strategies. They are invaluable when presenting information to decision-makers and the public. Performance measures should provide a comprehensive view of system operations from the perspective of both system managers and users. In the case of considering operations in the planning process, the development of performance measures should include not only planners and policy-makers, but also those involved with management and operations. Management and operations staff will bring the day-to-day, ongoing operational perspective, with considerations such as travel time, delay, safety, and reliability. For example, operational improvements such as traveler information and incident management are specifically designed to improve conditions during non-recurring congestion. The limited number of tools available to estimate the performance measures typically associated with operational strategies is often noted as a constraint in advancing operational strategies. However, there are a growing number of tools that can analyze all or some, including IDAS, SCRITS, Cal-B/C, and various simulation tools.
Different groups within an agency tend to focus on their own aspect of the program: operations is separate from maintenance; transit is separate from highway; and so on. When each of these departments develops projects, they naturally tend to focus on projects that offer benefits within their own realm of responsibility. Even though all transportation projects and activities have impacts on other aspects of the transportation system, few agencies possess the tools and processes that would enable them to look at improving systemwide performance. As a consequence, optimization of one element of the transportation network may result in adverse effects on the performance elsewhere or of the system as a whole.
For example, an agency might develop separate alternatives to mitigate one problem: an infrastructure redesign, a transit improvement, and an operations alternative. These three alternatives are typically evaluated individually and only one will be selected. More benefit to the overall transportation network may come from some combination of elements of each of the three alternatives. In general, operations should no longer be considered a separate and distinct alternative; it should be integrated with other alternatives.
Rather than proceeding with compartmentalized, segmented planning, projects (operational or otherwise), we should identify and analyze these projects with consideration for their impacts across the entire transportation system. Regional coordination is needed for everyone to understand the big picture and work together toward the most effective solutions. Some agencies have begun to promote this type of work, while others are trying to catch up. Tools are needed to help promote this systemwide, regional way of thinking.
There are few established procedures, methods, and/or tools for evaluating operations strategies on a regional scale. Performance measures are needed that address not only traditional improvements but operations as well, so that a fair comparison can be made. Some tools exist that enable planning-level analysis of operations; and others are improving analysis techniques and developing innovative approaches. One challenge is to determine how the various tools can be integrated and most appropriately used for the type of evaluation at hand. Multiple tools may be needed depending on the character and scale of the proposed improvement.
New Mexico, Mid-Region Council of Governments - Testimonial Regarding the Use of an Analysis Tool We found the IDAS tool very useful for our project prioritization – especially with the cost-benefit analysis. It provided us a clear comparative mechanism to evaluate benefits of projects that – inherent with ITS deployments that – aren’t necessarily apparent or considered in the normal project programming and prioritization process. Further information can be obtained at https://ops.fhwa.dot.gov/trafficanalysistools/videos/masek_transcript.htm. |
Source: Federal Highway Administration, June 2004, Traffic Analysis Toolbox, Volume II: Decision Support Methodology for Selecting Traffic Analysis Tools, Publication No. FHWA-HRT-04-039, [online] available at https://ops.fhwa.dot.gov/trafficanalysistools/index.htm.
While capacity-related operational treatments are being studied with existing models, analysis of strategies targeted at non-recurring roadway events (incidents, work zones, weather, and special events) has lagged. These treatments may include direct management of facilities, as well as traveler information. Because these non-capacity-related sources cause a substantial portion of total delay nationwide (50 to 60 percent by most estimates), studying them with existing methods or analytic tools is important to incorporating operations in the planning process.
Regardless of the analytic methods selected to perform planning-level assessments of operational improvements, some key topics should be considered in the short term:
Travel demand forecasting (TDF) models are widely used and understood by the planning profession. They are the primary analytic tool used by planners, which presents a good place to start for making operational assessments at the planning level. Their main purpose is to identify major highway capacity deficiencies using forecasts of “typical” (average) traffic. However, they often cannot be effectively used to directly assess operational impacts because they deal with physical capacity and typically do not allow for variations in congestion level due to events and demand. Still, a good portion of the base data needed to do operational assessments is provided by TDF models. TDF models are particularly useful at the long-range planning horizon and at the regional level, and it is desirable to consider traditional capacity and operational treatments simultaneously. Extending TDF model output by using post-processors is a logical step that can be accommodated relatively easily. Current post-processors basically work in this fashion, but there is opportunity to improve their interfaces and update methodologies based on more recent data, local data, or methods that have become available. Post-processing can be performed with existing software packages, but other simple and custom procedures could also be derived.
Adaptation of mesoscopic or macroscopic simulation models, especially when linked to travel demand models, offers potential for identifying network deficiencies and the impact that operations strategies can have on alleviating such deficiencies. An example of a linked TDF/meso/microsimulation analysis is the model corridor study conducted by Caltrans in the San Francisco Bay Area I‑880 Corridor. In this study, a regional demand model (EMME/2) is linked with a mesoscopic simulation model (DYNASMART‑P), which is linked to a microscopic simulation model (Paramics). This approach allows for assessment of trip generation, trip distribution, and mode shift (features of the regional travel demand model); followed by assessment of regional route diversion (feature of the mesoscopic simulation model); and followed in turn by local assessments of delay, bottlenecks, queues, and travel time (using the microsimulation model). Another innovative application of the mesoscopic simulation model is to replace the static traffic assignment methods used in the current travel demand models with dynamic traffic assignment.
TTI and Texas DOT Testimonial Regarding the Use of An Analysis Tool …it enables us to show the public and decision makers what will work, what won’t work, with a visual display, rather than boring them with statistics. What we’ve been able to do with Dynasmart is go to the MPO with our projects and have them look at the technical aspects of a project over another that might be in competition with being programmed into long-range planning. Through the technical analysis and through funding available, we’ve been able to push several projects to the plan. Further information can be obtained at https://ops.fhwa.dot.gov/trafficanalysistools/videos/leos_transcript.htm. |
Microscopic simulation models provide the most refined estimates of delay and focus on detailed areas. However, they also require more data and resources than the other analysis tools. They are effective in determining traffic flows, providing realistic representation of queues and resulting traffic congestion, integrating planning and operations, and quantification of benefits due to operational strategies. Simulation tools also provide powerful visual outputs that allow planners, decision makers, and the public to visualize existing or future conditions and the effects of alternatives.
Archived data from operations sources have great potential for planning applications, but the applications for archived data are different from those for the models discussed above. It is true that archived operations data can be used to supply model inputs and for calibration/validation of models, but the applications differ substantially and in some ways represent new territory for planners:
Incorporating the ability to consider operational improvements and concerns within the regional transportation planning process (e.g., deficiency analysis for identifying potential projects, project prioritization process, operations-oriented performance measures) needs to be achieved if operations is to be streamlined in transportation plans. One potential item of interest is how operations and capacity expansion projects can be “bundled” together as congestion relief packages. Another might be what tools, methods, and/or performance measures can provide “apples-to-apples” comparisons of investment strategies and most appropriately represent the impacts of these investments.
In the long term, the tools and methods for analyzing and evaluating operational improvements/investments should be consistent with approaches in use for traditional capacity improvements. Ideally, this should begin at the regional level with sketch planning and/or travel demand forecasting methods, move to the subarea or corridor level with travel demand forecasting and/or mesoscopic tools, and then to project-level analysis using microscopic simulation models. Methods to automate or link the transition from one tool type to the next should be established to maintain consistency and reduce cost, schedule, and data requirements.
Several key findings, issues, and challenges were identified in developing the overview and case studies for applying analysis tools and methods to advance operations in planning including:
While many challenges, gaps, and issues exist in linking planning and operations through the use of analysis tools and methods, there are many opportunities to use existing tools and methods more innovatively to advance operations in the planning process. The four case studies supporting this were intended to provide practitioners with some innovative approaches and guidance on how they might implement similar processes in their own regions.
 flow chart - figure shows that the four case studies represent a variety of the traffic analysis tool types. Each case study supports a primary tool type and several also support multiple case studies. Case study number one, Operations Strategy Impact Reference and Deployment Guidance, primarily supports the sketch planning tool type and it also includes operations-oriented performance measures/metrics as a secondary tool type. Case study number two, Incorporating Highway Capacity Manual Procedures into Long-Range Transportation Planning, primarily supports the deterministic models tool type. Case study number three, Using Archived Data As a Tool for Operations Planning, represents the archived operations data tool type. It also includes operations-oriented performance measures/metrics as a secondary tool type. Case study number four, Application of Microsimulation in Combination With Travel Demand Models, primarily supports the simulation tool type. It also includes travel demand forecasting model tools as a secondary tool type.