CASE STUDY 4: I-25 AND UNIVERSITY BOULEVARD IN DENVER, COLORADO
Converting a Cloverleaf Interchange to a Single-Point Urban Interchange
Project Description
This case study evaluates the modeling that was part of an overall evaluation of alternatives and estimation of performance on a full cloverleaf interchange design to mitigate the substandard ramp radii with tight curves, short weaving areas, and inadequate acceleration lanes. Alternatives included upgrading the cloverleaf to current standards, to several partial cloverleaf alternatives, to a diamond interchange, to a single point urban interchange. Factors affecting the selection of the final interchange configuration included cost, right-of-way availability, and traffic operations, including concerns about the additional congestion a signal might cause on the already-overloaded arterial. The focus of this review is on the comparison between future conditions as estimated by the modeling with actual operations after the interchange was built.
The single point urban interchange (SPUI) (as shown below in Figure 10) was selected as the preferred alternative at this location because it provided the best traffic operations on University Boulevard without significant right-of-way or environmental impacts. The cost was higher than that for a diamond interchange, but the improved traffic operations were given more weight in the selection of the interchange alternative. Also, this provided a solution that added only one signalized intersection, which alleviated a concern of the public over adding signals to the already congested arterial.
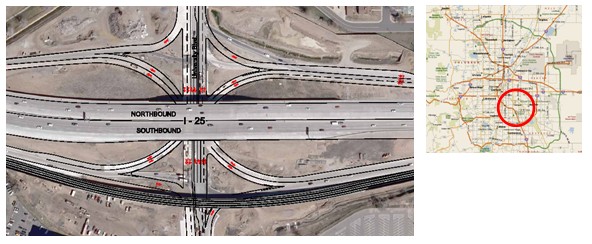
Figure 10: I-25 Interchange in Denver, Colorado
Simulations were used extensively through the analysis to help decision-makers visualize what projected traffic operations might look like; multiple models were employed to accomplish individual tasks with the most appropriate tool. A signal timing tool was used to optimize signal timing for the SPUI and compute capacity at each signalized intersection along University Boulevard within the immediate arterial, including Buchtel and Evans, as well as the unsignalized Buchtel intersection with the Park-and-Ride main access. Two additional models were utilized to optimize cycle length and offsets for coordination through the corridor. Finally, a separate simulation tool was used throughout for delay and Level of Service (LOS) estimates for consistency in comparing alternatives.
Conditions Prior to Construction
The University Boulevard Interchange with I-25 was a typical cloverleaf configuration, with direct ramps serving each of the eight movements in the interchange. University Boulevard was two lanes per direction with 12-ft lanes in the interchange area. I-25 was three lanes per direction through the interchange.
- The interchange had a number of deficiencies, including the northbound I-25 to northbound University ramp with poor sight distance caused by substandard geometric conditions with no acceleration lane at University Boulevard where 12-ft lanes were being narrowed to 11-ft lanes; the southbound I-25 to southbound University ramp with poor sight distance caused by substandard geometric conditions with the ramp terminus within several hundred feet of the intersection of University Boulevard and Buchtel Boulevard where queuing created stop-and-go conditions; and, the weaving areas on I-25 experienced congestion associated with the short weaving distance through a vertical crest which limited sight distance.
- There were also several capacity deficiencies related to the interchange, including the northbound weave on I-25 operated at LOS F during both peak hours; the southbound weave on I-25 operated at LOS E during both peak hours; and the weave between the southern ramp termini and the Buchtel Boulevard intersection operated poorly during both peak periods due to the short weaving distances.
SPUI Selected
The SPUI and diamond interchanges provide the following safety benefits:
- The northbound I-25 to northbound University exit ramp moves south, allowing for an improved design with a better acceleration lane and sight distance.
- The southbound I-25 to southbound University ramp moves away from the Buchtel Boulevard intersection, allowing for a lengthened weaving section.
- The signal(s) meter southbound University Boulevard traffic for larger weaving gaps.
- The northbound University to southbound I-25 ramp moves away from Buchtel Boulevard, increasing the weaving distance.
- The weaving sections on I-25 are eliminated.
The SPUI was selected as operationally superior to the diamond interchange, with better mid-block operations and better interchange LOS. The SPUI provides the additional benefits of adding only one signal to University Boulevard and increasing signal spacing between the interchange and Buchtel. This information is intended to provide background on the ultimate project, but our focus will be on the SPUI as built.
Operations Analysis
For the purposes of this review, opening day estimates were the focus in order to compare model predictions with actual operations. The build scenario volumes were distributed to the SPUI. The following traffic analyses were conducted:
- Optimized individual intersection timings;
- Optimized corridor for coordinated operations; and
- Simulated the interchange area using the optimized signal timing.
Delay values were extracted from simulation to determine levels of service (LOS) for the various alternatives for both AM and PM peak periods. The effects of a park-and-ride lot on Buchtel just off University were made part of the analysis for projected use of the LRT station there. Levels of service were obtained for signalized locations using a capacity analysis tool as shown in Table 6. It should be noted here that while earlier in the original study, when analyzing individual signalized intersections, HCM procedures were used, the use of LOS is not entirely appropriate in this table given that the delays were generated from simulation.
| Opening Day | AM | PM | ||
|---|---|---|---|---|
| Delay | LOS | Delay | LOS | |
| SPUI | ||||
| Northbound | 47 | D | 50 | D |
| Westbound | 41 | D | 41 | D |
| Southbound | 25 | C | 25 | C |
| Eastbound | 31 | C | 31 | C |
| Buchtel | ||||
| Northbound | 187 | F | 208 | F |
| Westbound | 41 | D | 44 | D |
| Southbound | 12 | B | 13 | B |
| Eastbound | 169 | F | 190 | F |
| Evans | ||||
| Northbound | 85 | F | 83 | F |
| Westbound | 301 | F | 309 | F |
| Southbound | 294 | F | 302 | F |
| Eastbound | 69 | E | 73 | E |
Analysis and Results
Some issues that are apparent when reviewing this particular study raise several questions:
- Did the use of multiple tools and the ways they were integrated and compared help or hinder the accuracy and comprehensive coverage of the results?
- Was data collected using conventional stop-bar turning movement counts that show departure flow rates instead of measuring demand by quantifying arrival rates?
- Were oversaturated conditions properly modeled incorporating the unmet demand into delay computations in multiple-period analyses?
- Were the effects of the downstream signalized intersections at Buchtel and Evans properly considered, including spillback during peak periods?
- Was the use of simulation instead of HCM methods to ascertain LOS for the various components appropriate?
To address these questions, current "after" data were obtained from the City of Denver for analyzing the current conditions to compare with "opening day" estimates. The data provided by the City included demand flows for all movements of the now-operational SPUI and the signalized intersections on University at Buchtel and Evans. Multiple-period analysis runs were made for both AM and PM peak periods using these flow rates, the as-built geometric conditions and current signal timing, using HCM procedures.
Results from modeling the "after" data in still another model using HCM procedures as independent verification of the delay, LOS and queue estimates are shown here in Table 7 as representative of current, as-built operations.
| Opening Day | AM | PM | ||
|---|---|---|---|---|
| Delay | LOS | Delay | LOS | |
| SPUI | ||||
| Northbound | 37 | D | 37 | D |
| Westbound | 40 | D | 42 | D |
| Southbound | 28 | C | 33 | C |
| Eastbound | 42 | D | 42 | C |
| Buchtel | ||||
| Northbound | 503 | F | 28 | C |
| Westbound | 35 | D | 35 | D |
| Southbound | 112 | F | 100 | F |
| Eastbound | 50 | D | 503 | F |
| Evans | ||||
| Northbound | 334 | F | 372 | F |
| Westbound | 843 | F | 704 | F |
| Southbound | 179 | F | 302 | F |
| Eastbound | 29 | C | 73 | C |
When compared with the original study predictions shown in Table 7, the major discrepancy is the estimate of delay and LOS for the southbound approach at Buchtel (with the northbound approach at Evans another inconsistency). The study predicted LOS B, but the current conditions are clearly LOS F. This is most likely due to the spillback from Evans, which could have been foreseen from its LOS predictions. (One other discrepancy was the PM estimate for the NB approach at Buchtel, which is created because the current capacity analysis did not account for the spillover from the short left-turn bay there.)
Conclusions and Recommendations
After comparing the original case study results with our current analysis, each question raised in the Analysis of Results is addressed below.
- The original study effectively used multiple analysis tools to take advantage of the strengths of each. One tool was used to quantify capacity and LOS at each intersection, including the SPUI, as well as signal timing for that intersection. Another tool was utilized to determine signal coordination and to confirm delay and LOS for the signals operating as a corridor. Finally, another tool was used to simulate the operations of the corridor to obtain delay estimates consistent within one model. This worked out to be an effective use of multiple tools for this application.
- Although it is not clear from the original report, existing count data did not seem to include unmet demands judging from the delay and LOS results yielding such good operations. This may have shown a better than reality situation for the current conditions, but did not have a negative effect on the alternative selection process and of course was not a factor in the future condition analysis.
- Projection estimates were not constrained by actual counts and did appear to properly consider the appropriate demand levels for the future operating situations. Therefore, the analyses using these projections did model oversaturated conditions showing some extreme delay levels in some cases as proved to be the case after reviewing the "after" conditions.
- Multiple models showed the excessive queue estimates and predicted the spillback from the Buchtel and Evans signalized intersections to be an issue. While these tools quantified the magnitude of these queues, some were not effective in modeling the effects of the bottleneck on adjacent intersections. The scope of the original study and this review was limited to the southbound approaches to Buchtel and Evans as potentially affecting the SPUI. The southbound flow rates simply seem to overwhelm the available capacity in all analyses, to the point additional lane capacity would be needed to mitigate.
- The use of simulation overcame the shortcomings of standard capacity analysis procedures for these spillback situations. The results did accurately predict the bottlenecks, particularly at Evans, spilling back through Buchtel and affecting the SPUI, which actual "after" counts confirm.
The quote from the initial study shows that this was recognized in the analysis: "However, [the spillback] had only a minor effect on the new southbound I-25 to southbound University Boulevard ramp, and no effect on the SPUI intersection. The minor queuing on the southbound I-25 to southbound University Boulevard ramp due to the southbound University Boulevard queuing did not affect freeway operations because this ramp is fed by the proposed collector/distributor roadway, and not directly by the interstate."
The failure along this corridor was accurately predicted and acknowledged in the study, with agreement that the collector-distributor ramp length would prevent freeway problems.
Extensions and Guidance
In summary, results show that the new interchange is operating well when considered individually, and this is confirmed in discussions with City engineering staff. However, the oversaturated conditions at the downstream signals create a spillback situation for the SB I-25 to SB University movement; impeding the flow from this off-ramp and backing it up during peak hours. A contributing factor is the pedestrian demand at Buchtel from the University of Denver activity, which forces timing to be more limited for vehicles traveling SB on University than would be used for vehicular traffic only.
A more comprehensive analysis would have extended to recommend improvements to the Buchtel and Evans signalized intersections, especially Evans since it is apparent the southbound bottleneck originates here. Alternative analyses at the Evans signal could have provided mitigating improvement choices to resolve the congestion along the corridor. The conclusion in the study that these queues did not significantly affect the subject of the study (the SPUI) were based on the fact that the southbound exit ramp was extremely long and has enough storage to prevent backing up to the freeway.
While this is true and actual current operations bear this out, it does not address the still existing congestion along the corridor and even on this ramp. Solving the problem at Evans would have indeed prevented the poor operations for this important leg of the SPUI, thereby improving the level of service at the subject of the study. There could have been multiple-period HCM analyses performed at the Evans signal to at least generate future improvements to address the source of the only real problem found at the SPUI.
As for Buchtel, investigating strategies to overcome the interference by the large numbers of pedestrians accessing the University of Denver could have been explored. Closing two crosswalks and/or double cycling the pedestrian call to maximize the vehicular efficiency might have been worth modeling to more effectively use the green time for vehicular traffic. Another, more costly but still worth a look, could have been a pedestrian overpass, including approaching the University for possibly sharing in its expense.
While these signalized intersections were modeled, the results showing the bottleneck could have been used to further investigate alternatives to resolve the problem. A broader look at the corridor might have prevented the problem that still exists today.
| Special thanks to Paul Brown from the Colorado DOT's consulting team for information on the case study, and to Amy Rens and Paul Bountry of the City of Denver for providing detailed "after" data for use in these comparisons. |