3. Maintaining a Network of Field Devices
Prior to starting the iFlorida Model Deployment, most of the D5 traffic monitoring equipment was deployed along I-4. Data from loop detectors were used at times to estimate travel times, but operators were just as likely to base estimates on observations from the traffic cameras. Dynamic message signs (DMS) and 511 messages were only used on I 4, and Regional Traffic Management Center (RTMC) operators recorded these on the fly. Since most traffic management operations were done "by hand," the RTMC operators could adapt to any missing data from failed field devices.
With the start of iFlorida, the situation changed. The roads managed at the RTMC increased from about 40 miles of I-4 through Orlando to more than 70 miles of I-4, an equal length of I-95, five toll roads near Orlando, seven key Orlando arterials, and a number of other roads across the state. More detailed operations were also required for each of these roads, including the need for real-time 511 and DMS travel time information. Because this additional workload could not be easily met using the previous "by hand" methods, iFlorida included software to automate many traffic management activities. Travel time information would be automatically posted to message signs and the 511 system. Sign plans could be created to automate message sign postings if an incident occurred and to remind operators to remove sign messages when an incident cleared.
The increased reliance on automated methods brought about an increased reliance on the reliability of the field equipment. Prior to iFlorida, an RTMC operator would find some other way to post information when equipment had failed; however, the automated systems were not so flexible, so equipment failures were more likely to result in missing messages in the traveler information systems.
The end result was a transition from a department with a moderate amount of non-critical equipment deployed in the field to a department with a large amount of critical equipment deployed in the field. This section of the report describes how the Florida Department of Transportation (FDOT) modified its maintenance practices to accommodate this transition.
3.1. FDOT D5 Field Devices
Prior to the iFlorida deployment, field instrumentation maintained by FDOT District 5 (D5) consisted primarily of loop detectors, cameras, and DMSs along I-4 in Orlando, with a smaller set of similar devices deployed along I-95 east or Orlando. As the iFlorida deployment proceeded, the complexity of the deployed field equipment increased in three different ways: the number of devices increased, the number of different types of devices deployed increased, and the size of the region throughout which those devices were deployed increased.
The number of deployed devices increased from about 240 in January 2004-the first date for which maintenance inventory records were available to the Evaluation Team-to more than 650 in June 2007 (see Figure 11).1 This figure includes only traffic management devices and excludes equipment related to the FDOT networks used to connect to this equipment.
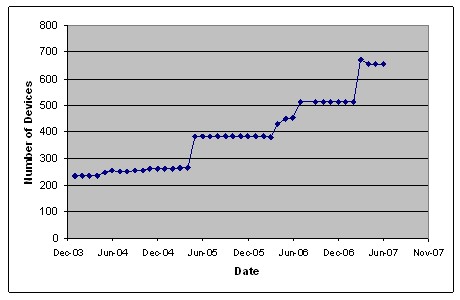
Figure 11. The Number of FDOT D5 Traffic Management Devices
The number of different types of devices also increased. In January 2004, the equipment included loop detectors, traffic cameras, and DMS. By 2007, FDOT had also deployed radar (in place of loop detectors), trailblazer signs, variable speed limit (VSL) signs, toll tag readers, and license plate readers (see Figure 12.)
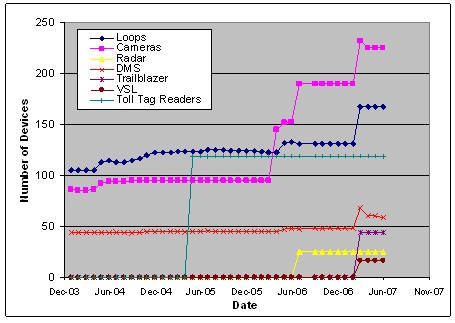
Figure 12. The Number of FDOT D5 Traffic Management Devices, By Type
The geographic distribution of the deployed equipment had increased. In January 2004, the majority of the deployed devices were located on I-4 (about 190 devices), with about 30 devices located on I-95 and 11 devices on SR 528. By 2007, additional devices had been deployed on these roads and other devices had been deployed across the state (e.g., 25 cameras and radar units to support the Statewide Monitoring System (see Section 8), and video surveillance cameras on two bridges).
Note that the devices listed above include only traffic management equipment and exclude switches and other network equipment required to operate the system. The list also includes only equipment that FDOT was helping maintain, so it excludes equipment that was being or had been deployed but was still being maintained by the deployment contractor.
3.2. FDOT D5 Maintenance Practices
Prior to the iFlorida Model Deployment, FDOT monitored the deployed equipment and managed the maintenance process. Each day, an RTMC operator would review the loops, cameras, and signs and record in a spreadsheet whether the equipment was working. Loop failures were noted by scanning a list of current readings to ensure that data was available from each loop. Camera errors were noted by accessing the video feed from each camera to ensure that it was operational. Sign errors were noted by using the cameras to view each sign. When a new failure was noted, FDOT would either dispatch personnel to make the repair (for FDOT maintained equipment) or issue a work order for the repair (for contractor maintained equipment).
For the field equipment deployed as part of iFlorida, a different approach was used. In most cases, the equipment deployment contracts included a warranty period covering the entire planned iFlorida operational period through May 2007, during which the contractor would be responsible for maintaining the equipment. This was important to FDOT because the deployment of so much new equipment had the potential to overwhelm FDOT's ability to monitor and maintain it. FDOT expected that including a warranty period would put the responsibility for monitoring and maintaining the equipment on the contractor.
FDOT did discover a problem with the warranty approach. While the contracts included language requiring specified levels of availability for the equipment and maximum repair times when equipment failed, they did not include language specifying how the availability of the equipment would be monitored. Implicit in FDOT's plan was that the RTMC operators would be able to monitor the availability of the field equipment; when a piece of field equipment failed, an RTMC operator would note the failure because data he or she needed would be unavailable. When the Condition Reporting System (CRS) failed to work as expected (see Section 2), RTMC operators sometimes were unable to verify whether equipment was working because CRS failures prevented access to data from the equipment. If missing data were noted, it was not clear if the missing data was due to equipment failures, failures in the CRS, or failures elsewhere in the system.
| In field equipment contracts, include requirements for tools to monitor the operational status of the deployed equipment and for helping with equipment monitoring once the deployment is complete. |
This was particularly true with the arterial toll tag readers. Toll tag reads passed through several processing steps to generate travel time estimates before reaching the CRS, and FDOT had trouble tracking down the root cause of missing or inaccurate arterial travel times. Reader failures were first noted by FDOT when the CRS was ready to receive arterial travel times generated by the readers in the summer of 2005. When the travel time server failed to report travel times for most arterials, identifying the root cause of the failure required that FDOT personnel manually review a series of data processing and transmission steps.
In the case of the toll tag readers, this review was made more complicated because of limited documentation on how the reader network operated. FDOT eventually discovered that each reader included a self-diagnostic utility that could be accessed remotely via a web browser-the toll tag reader documentation did not describe this feature. Each reader also created a local archive of all tag reads it had made. To identify failed readers, FDOT staff would review the local diagnostics of each reader each day and review a sample of tag reads made, noting any diagnostic errors or fewer tag reads than expected in a spreadsheet. This process, when applied to the 119 iFlorida toll tag readers, required about 4 hours per day to complete.2 This research finally revealed the fact that almost half of the arterial toll tag readers had failed. (See Section 5 for more information.) If the requirements for the toll tag reader deployment had included a tool for monitoring and reporting on the operational status of each reader, then FDOT would not have needed to develop an ad hoc method for doing so and could have detected these failures more easily and corrected them as they occurred rather than having the number of failed devices accumulate while the system was unmonitored.
FDOT also noted that recurring failures sometimes occurred with some equipment at specific locations. FDOT suspected that high failure rates were sometimes related to a root cause (e.g., inadequate power conditioning or high cabinet temperature) that was not being addressed by repairing the failed part. However, the warranty contracts did not require root cause analysis or more extensive repairs if multiple failures occurred at a site. FDOT was considering whether to add such language to future warranty contracts.
3.3. Equipment Reliability
One part of FDOT's equipment maintenance process was the generation each day of a spreadsheet that documented whether equipment was working. While the primary purpose of these spreadsheets was to help generate work orders for repairing failed equipment, FDOT also archived each spreadsheet. FDOT provided the Evaluation Team with copies of these archived spreadsheets for the period from January 2, 2004 through July 2, 2007, and the Evaluation Team converted the information on these spreadsheets into a database so that the equipment failure data could be analyzed.3 This allowed estimation of three measures of equipment reliability: availability, failure frequency, and repair time. Each of these measures was analyzed for the following groups of field equipment:
- Surveillance Motorist Information System (SMIS). This group includes equipment deployed along I-4. In early 2004, this consisted of about 87 loop detector stations, 68 cameras, and 36 message signs. In May 2007, this consisted of 128 loop detector stations, 77 cameras, and 56 message signs.
- Daytona Area Smart Highway (DASH). This group includes equipment deployed along I-95. In early 2004, this consisted of about 13 loop detector stations, 14 cameras, and 6 message signs. In May 2007, this consisted of 23 loop detector stations, 25 cameras, and 3 message signs.
- Bridge Security. This group includes cameras deployed to support the iFlorida Bridge Security project-see Section 12. This consisted of 29 cameras deployed at two bridges.
- Statewide. This group includes cameras and radar units deployed as part of the Statewide Monitoring System-see Section 8. This consisted of 25 radar units and 25 cameras deployed at station locations across the State.
- Hurricane Evacuation System (HES). This group was deployed along SR 528 and SR 520 to support hurricane evacuations. In early 2004, this consisted of about 5 loop detector stations, 4 cameras, and 2 message signs. In May 2007, this consisted of 16 loop detector stations and 4 cameras.
- VSL. This group consists of 20 VSL signs deployed at 16 locations on a portion of I-4 in Orlando.
- Trailblazer. This group consists of 44 trailblazer message signs deployed at key intersections along I-95, intersections that might be used if traffic is diverted off of I-95 during an incident.
- Arterial. This group consists of 14 cameras deployed at key intersections in Orlando.
These measures were computed independently for each type of equipment (e.g., cameras, loop detector stations) within each group.
3.3.1. Field Device Availability
A measure of the availability of field devices was computed as the number of days during a specified period that FDOT reported that a piece of equipment was operational (i.e., no reported errors) divided by the number of days that FDOT reported on a piece of equipment. (Periods for which no reports were available were ignored.) Note that this may overstate the extent to which equipment was unavailable because any reported error was treated as if the equipment was unavailable. For example, if one of five loops at a detector location had failed, the detector location was treated as if data from that location were unavailable. Figure 13 depicts the availability of the loops, cameras, and signs that in the SMIS group.
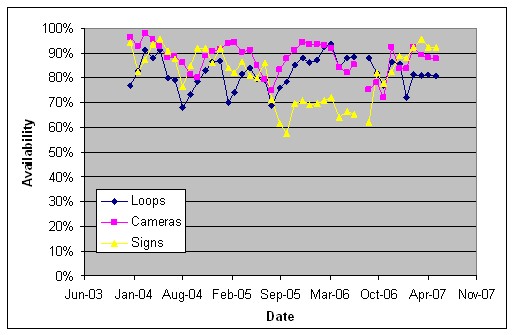
Figure 13. Availability of the SMIS Field Equipment
Note that, in general, the equipment was available 80 to 90 percent of the time, though lower levels of availability occurred during 2005. The lower levels of availability in 2005 correspond to a time when FDOT was simultaneously trying to manage repairs to the arterial toll tag reader network and go live with the CRS. With limited resources available, these new responsibilities appeared to impact FDOT's ability to maintain the existing SMIS network.
Figure 14 depicts the availability for the DASH field equipment. Note that this group showed lower levels of availability, which could be attributed to the fact that it was newer and FDOT had less experience maintaining it.
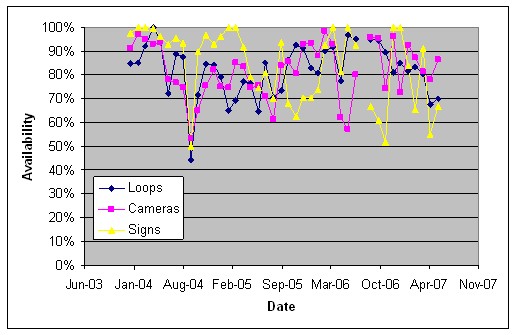
Figure 14. Availability of the DASH Field Equipment
The chart in Figure 15 shows the level of availability of the Bridge Security cameras. Because this system was secondary in importance to the systems that more directly supported traffic management operations, the lower levels of availability in this system were likely because FDOT placed less emphasis on maintaining it.
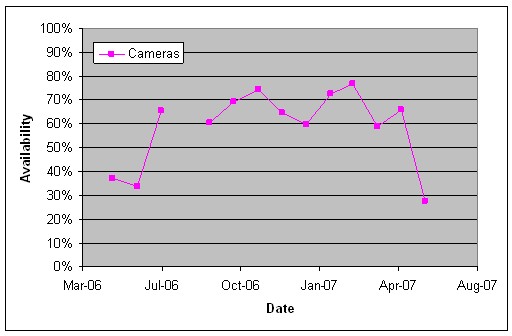
Figure 15. Availability of the Bridge Security Field Equipment
Figure 16 depicts the availability of the equipment in the Statewide Monitoring System. As FDOT discovered that this system was not very effective at providing statewide traveler information (see Section 10), the agency reduced the emphasis on maintaining it. This, and the fact that maintenance costs were high due to the cost of traveling to locations across the state to perform maintenance activities, likely resulted in the low levels of availability for this equipment.
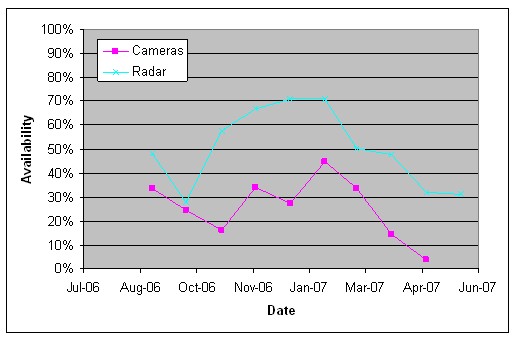
Figure 16. Availability of the Statewide Monitoring Field Equipment
The availability of the HES equipment is depicted in Figure 17. This equipment, which was used to support both hurricane evacuations and traveler information on SR 520 and SR 528, was less critical to FDOT than the instrumentation on I-4 and I-95 for day-to-day traffic management operations.
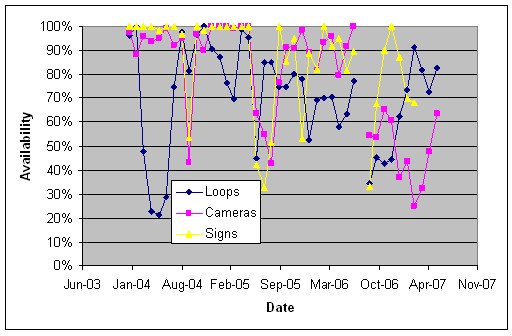
Figure 17. Availability of the HES Field Equipment
Figure 18 depicts the availability of the VSL signs deployed on I-4 in Orlando. Because VSL operations were not put in place in Orlando, lower levels of availability for these signs might be expected.
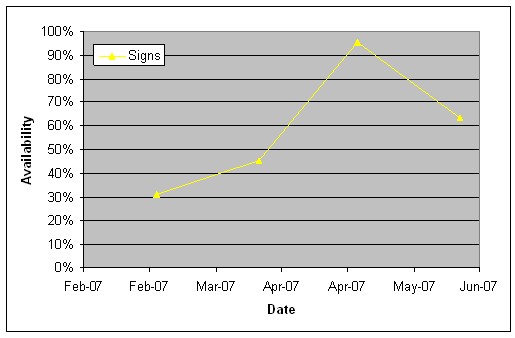
Figure 18. Availability of the VSL Field Equipment
Figure 19 depicts the availability of the trailblazer signs used at key intersections located near I 95.
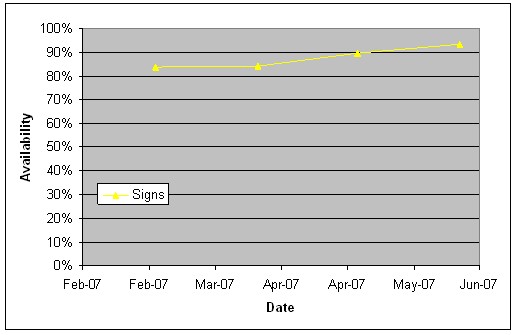
Figure 19. Availability of the Trailblazer Field Equipment
Finally, the availability of the traffic cameras deployed on Orlando arterials is depicted in Figure 20.
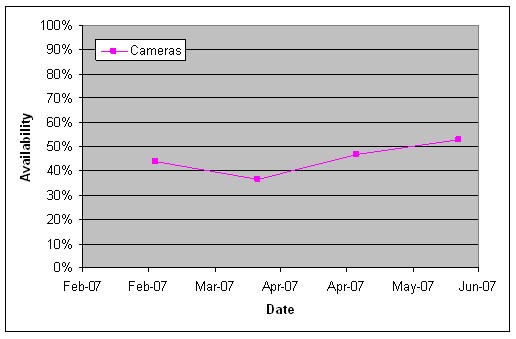
Figure 20. Availability of the Arterial Field Equipment
Figure 21 depicts the level of service for the arterial toll tag readers. (The definition for this measure of level of service is given in Appendix A.)
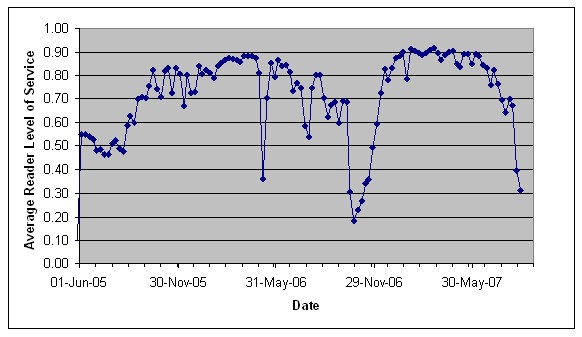
Figure 21. Availability of Arterial Toll Tag Readers
The availability of field equipment deployed by FDOT typically ranged between 80 and 90 percent in 2007. For the SMIS equipment, the 2007 average was about 80 percent for loop detectors, 87 percent for cameras, and 92 percent for signs. For the DASH field equipment, the corresponding averages were 77 percent, 82 percent, and 79 percent. For arterial toll tag readers (see Section 5), the availability was almost 90 percent. The availability of other equipment, which FDOT deemed less critical for its operations, had lower levels of availability.
One conclusion that can be drawn from these observations is that traffic management field equipment is going to be unavailable a significant fraction of the time, and systems that use data from that equipment must be designed to accommodate those failures. See Section 3.5 for suggestions on designing systems to accommodate device failures.
3.3.2. Time to Repair
Another measure related to the reliability of the field equipment is the repair time, measured as the number of successive days in which the maintenance logs reported an error for the equipment, averaged over the collection of equipment in each group. Figure 22 shows the average repair time for the SMIS equipment.
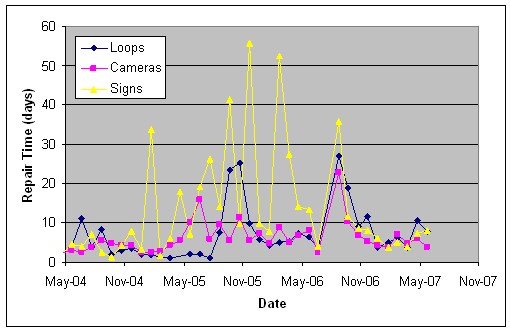
Figure 22. Average Repair Time for the SMIS Field Equipment
In 2007, the average repair time was about 6 days for SMIS loop detectors, about 5 days for cameras, and about 6 days for signs.
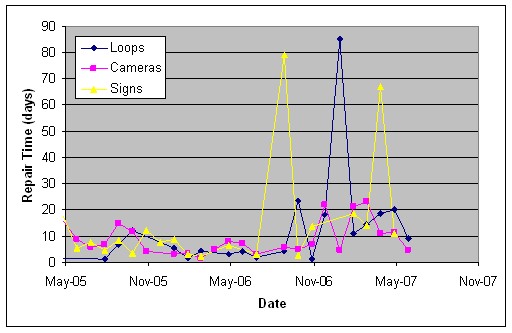
Figure 23. Average Repair Time for the DASH Field Equipment
The average repair time in 2007 was about 18 days for the DASH loop detector stations, about 9 days for DASH cameras, and 25 days for signs. For the HES field equipment, the 2007 average repair time was about 12 days for loop detector stations, 16 days for cameras, and 9 days for signs. For VSL signs, the average repair time was 16 days in 2007. For the Statewide Monitoring System, the average repair times were much longer, averaging about 29 days for detectors and 64 days for cameras in 2007.
3.3.3. Mean Time Between Failure
The mean time between failure (MTBF) was estimated by taking the average time that a piece of equipment was marked as being in service in the FDOT maintenance logs. Note that a piece of equipment could be marked as being out of service for a variety of reasons, including failure of the equipment, failure of equipment utilities, or failure of the network to provide connectivity to the equipment. So, the reported MTBFs are for the equipment as embedded in the FDOT network, not for the equipment itself. Figure 24 depicts the MTBF for the SMIS field equipment.
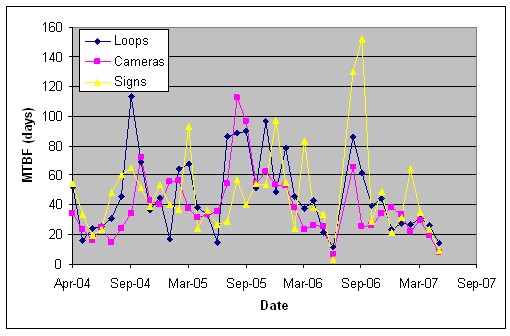
Figure 24. Mean Time Between Failures for SMIS Field Equipment
The MTBF, repair time, and availability for FDOT field equipment are summarized in Table 1.
| Equipment Group | Equipment Type | Count | MTBF (Days) |
Repair Time (Days) |
Observed Availability | Estimated Availability |
|---|---|---|---|---|---|---|
| SMIS | Loops | 128 | 26 | 6 | 80% | 81% |
| SMIS | Cameras | 82 | 28 | 5 | 87% | 85% |
| SMIS | Signs | 59 | 36 | 6 | 92% | 86% |
| DASH | Loops | 23 | 39 | 19 | 77% | 67% |
| DASH | Cameras | 25 | 37 | 9 | 82% | 80% |
| DASH | Signs | 6 | 58 | 25 | 79% | 70% |
| HES | Loops | 16 | 39 | 12 | 79% | 76% |
| HES | Camera | 4 | 11 | 16 | 40% | 41% |
| Statewide | Camera | 25 | 17 | 64 | 50% | 21% |
| Statewide | Radar | 25 | 24 | 29 | 21% | 45% |
Note that there is an approximate relationship between the MTBF, repair time, and availability: on average, each piece of equipment should work [MTBF] days before repairs are necessary, and the repairs require about [Repair Time] to complete. So,

The "Obs" column under "Availability" is the observed availability (see Section 3.3.1) and the "Est" column is the estimated availability using the formula above. Considering this formula leads to the following observation. Because the MTBF is usually significantly longer than the repair time, reducing the repair time by a given number of days will have a bigger impact on availability than increasing the MTBF by the same number of days.
3.4. Maintaining a Fiber Network
One of the common sources of device failures at FDOT was fiber cuts, which left field devices disconnected from the RTMC. The main cause of fiber cuts on the FDOT network was construction activities. One interchange project, for example, resulted in more than 90 fiber cuts during the course of the 3-year project. In one instance, a contractor was onsite repairing the fiber when the fiber was literally jerked out of his hands as the result of a second cut occurring on the same fiber bundle.
Before 2007, the FDOT ITS Group had played a reactive role in the process of protecting and repairing their fiber. All contracts included clauses requiring the contractors to promptly repair any fiber that was damaged, but contractors often made little effort to avoid damaging fiber. FDOT believed that, in some cases, this was because the contractor may not have been aware of the exact location of the fiber. At other times, it appeared that the cost of repairing the fiber was less than the cost and inconvenience of trying to avoid it.
When a fiber cut did occur, the consequences were sometimes magnified because the ITS Group was not immediately notified so repairs could begin. Most contractors had few interactions with the ITS group, and were uncertain who to contact if a problem occurred. If a fiber cut occurred during off hours, the contractor, uncertain who to contact, might not report the cut immediately. Meanwhile, network monitors would note the loss of connectivity and began contacting FDOT employees by email, pager, and cell phone. FDOT employees would run tests to locate the problem and identify the source of the problem as being damaged fiber in a construction zone. In some cases, ongoing construction activities would have buried the damaged fiber by the time FDOT responded, and FDOT would have to run additional tests to determine the exact location of the cut and re-excavate the damaged fiber before repairs could be made.
In 2007, FDOT began taking a more pro-active stance in addressing the problem of fiber cuts. The goal was to reduce the number of fiber cuts and reduce the impact when a cut was made. As a first step, FDOT identified some of the root causes that led to fiber cuts, identifying the following:
- ITS fiber was often not included on construction plans. Until recently, the ITS Group was not integrated into the FDOT construction planning process. In some cases, ITS fiber was not included on construction plans and issues were often not identified until plans were nearly complete. When it was included, it was often first included in the 30 percent plans. At that point, the cost of modifying the plans was higher than if it had been done earlier in the planning process, and some approaches for avoiding damage to ITS fiber were no longer feasible. The ITS Group stated that their goal was to be fully integrated as part of the normal DOT process of identifying, designing, and building projects.
| Integrate the ITS Group into the construction process to help ensure that consideration of the fiber network is included in construction plans. |
- The exact location of the ITS fiber was often not known. Sometimes, the actual deployment and as-built drawings differed too much to be useful guides for whether construction activities would damage the fiber. FDOT also found that using the toning wire to locate the fiber often was not accurate enough to avoid fiber cuts.
- Contractors often were not certain how to contact FDOT to get further information if something in the field caused them to be concerned that they might damage some fiber. Not certain who to contact, contractors would often proceed with construction activities. If a fiber cut did occur, the contractor still might have been uncertain who to contact, and the damage would not be reported until FDOT detected it.
After reviewing these causes, FDOT identified several steps it could take to better protect its fiber. These steps were:
- The ITS Group began to develop a more accurate inventory of the location
of their fiber. This GIS-based inventory would allow FDOT to provide more
accurate information about the location of fiber to construction contractors
before construction begins.
- Large projects pass through FDOT's consultant project management process. FDOT modified procedures for this process so that the ITS Group would be notified early in the planning process and could participate in early planning meetings between FDOT and the contractor. This helped ensure that the construction plans took into account the ITS infrastructure. It also gave FDOT the chance to take steps to reduce the amount of damage to the ITS infrastructure if damage did occur.
- Smaller projects (local area projects and special projects) did not go through the FDOT consultant project management process. To ensure that protection of ITS resources was considered in these projects, FDOT began developing relationships with the various city and county government bodies that managed these projects. An ITS Group staff member began attending weekly project review meetings at these organizations at least once per month. This helped develop relationships between the ITS Group and those managing the local area projects and the local area project contractors.
| Installing fiber in visible locations rather than underground can help contractors avoid damaging the fiber. |
- The ITS Group began considering changes they could make to its network
before a project began to reduce the likelihood and impacts of fiber cuts.
- Consider making fiber visible. In general, FDOT located fiber underground as a means of protecting it from damage. Making fiber difficult to see, however, has made it more prone to damage during construction activities. FDOT noted that contractors typically avoided damaging overhead fiber because it is visible to them. FDOT began repositioning the fiber along some limited access roads from underground to above ground along the fence line during long-term construction projects on limited access roads. FDOT believed that making the fiber part of a visible obstruction (i.e., the fence) helped protect it from inadvertent damage.
- Consider locating fiber near features that contractors are likely to avoid during construction activities. FDOT noted that, with overhead fiber, the presence of nearby power lines made contractors more cautious. FDOT began considering the advantages of laying new fiber near other features that contractors were already prone to avoid, such as underground pipelines.
- Consider relocating the fiber before construction begins. In many
cases, FDOT felt it was unrealistic to expect a contractor to avoid
cutting fiber during prolonged construction activities. Multiple fiber
cuts that might occur would result in costs for repairing the fiber,
disruption of ITS services, and lower quality fiber connections (since
the splices required to repair fiber reduce the overall quality of the
fiber). Because most contractors included in their bid a reserve to
pay for damages that may occur, the potential for fiber cuts actually
results in increased construction costs for FDOT. FDOT began to consider
moving the fiber away from the construction site in order to lower overall
costs and better ITS service.
- In one recent intersection reconstruction project (at SR 436 and SR 50), both ITS equipment and fiber were located at the site. FDOT decided that it would be more cost effective to re-route the fiber and move the ITS equipment than to maintain it during the construction. The ITS Group coordinated with the City of Orlando, Seminole County, and Orlando-Orange County Expressway Authority (OOCEA) to make use of nearby dark fiber that these organizations had available, enabling FDOT to reroute fiber around the SR 436/SR 50 intersection. The strong relationships between FDOT’s ITS Group and these other agencies were key towards achieving this level of cooperation and sharing of resources. This approach was cost-effective because it required deploying only a small amount of new fiber.
- Consider increasing the amount of slack included in fiber deployments. FDOT has begun the practice of including large amounts of excess slack in areas where they expect to later deploy additional field equipment. This allowance can reduce the amount of rework required when the new equipment is deployed. FDOT recently had to rework several miles of infrastructure due to inadequate slack deployed in previous projects.
| It can be more cost-effective to relocate fiber prior to construction to reduce the likelihood and impacts of fiber cuts than make repairs when cuts occur. |
FDOT also noted that some contractors are more careful to avoid damaging ITS infrastructure than others.
Another cause of fiber cuts noted by FDOT was mowing activities. It was common for contractors working on fiber to not bolt down the covers on fiber hubs. If a mower passed over a hub cover that was not bolted down, it could either lift the cover and break it or, if the hub cover was not recessed, hit the cover directly and break it. Once the cover was broken, the suction from the mower could pull the fiber bundle up into the mower blades, cutting the fiber.
3.5. Designing Traffic Management Systems to Accommodate Equipment Failures
One of the lessons learned in considering the maintenance of the iFlorida field devices is that failure of deployed field devices should be expected. At FDOT D5, it was common for between 10 and 20 percent of devices in key systems to be down at any one time. The TMC software should accommodate these failures when they occur. This section of the document describes an approach that could be used to accommodate device failures. The fundamental concepts behind the approach are:
- Missing data should be replaced with estimated data for all key data
used in transportation decision making. In most cases, reasonable estimates
of travel times and other data can be generated (e.g., from historical data,
from operator review of traffic video). Basing transportation decisions
on estimated data is likely more effective than basing them on no data.
- FDOT's original specifications called for estimated travel times to be used whenever observed travel times were unavailable. When the CRS was first released and did not include this feature, a large number of 511 messages stated "Travel time on [name of road] from [location 1] to [location 2] is unavailable." The Evaluation Team felt that more time was spent creating an appropriate approach for addressing missing travel time data in the 511 system alone than would have been required to implement a method for replacing missing data across all systems with estimated values.
- Estimated data should be marked as such so that downstream decision support software can, if necessary, consider the fact that data has been estimated. In order for downstream data processing to differentiate between actual and observed data, the data must be marked accordingly.
- The estimated data should be produced as early in the data flow as possible. It is difficult to design software to accommodate missing data. Filling in missing data with estimated data early in the data flow will allow systems downstream from that point to assume data will always be available.
- All available data sources that can be used to estimate missing data, such as historical data generated by the detectors and traffic video that can be reviewed by TMC operators to assess the validity of estimated data, should be utilized and the most appropriate at that time used.
- The TMC software should provide tools to help TMC operators fill in missing data with estimated values. TMC operators, with access to many traffic data resources, are best equipped to help fill in missing data and review estimated values for correctness. The TMC software should inform operators of missing data and allow operators to specify parameters for controlling how the missing data should be estimated.
Figure 25 depicts an approach for replacing missing travel time observations with estimated values.
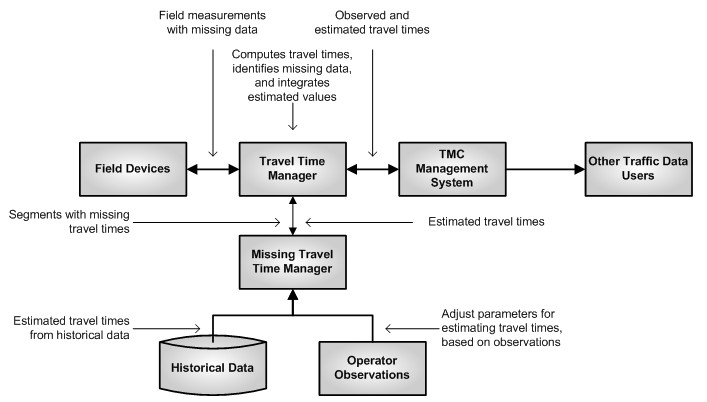
Figure 25. Process for Replacing Missing Travel Time Observations
with Estimates
In the above process, field devices generate measurements that are processed by the Travel Time Manager to produce travel time estimates for road segments. This process also identifies segments for which missing observations from the field devices result in missing travel time estimates.
When it first occurs that travel time observations are not available for a segment, the Missing Travel Time Manager alerts an operator, who selects an approach for producing estimated travel times for that segment. (This also gives the operator the opportunity to alert maintenance personnel that a piece of equipment has failed.) Several approaches might be used to produce travel time estimates:
- The operator might specify the travel time to use. (When the CRS failed in 2007, TMC operators would use observations from traffic video and loop detector speeds to estimate travel times. See Section 2 for more information.)
- The system might use the historical average for similar types of travel days. The travel days might be categorized into a number of different categories, such as "Typical Weekday, Fall," "Typical Weekday, Summer," "Special Downtown Event, Weekday," "Typical Weekday, Strong Rain," and "Typical Weekday, Minor Incident." (When the CRS failed in 2007, FDOT did use historical travel time data for 511 travel time messages.)
- The operator might specify a relative congestion level (based on available traffic video) and the system would compute an appropriate travel time for the segment based on historical averages for the specified level of congestion.
The estimated travel times would be merged with the observed travel times, adding a flag to indicate if travel times were estimated, to produce a complete set of travel times for the monitored road segments. The operator would be periodically alerted to review the segments with estimated travel time times to verify that the estimates remain valid.
The TMC Management System would use the travel times-both observed and estimated-to help perform traffic management operations, such as creating DMS and 511 messages. Note that, because the travel time data received by the TMC Management System does not include missing data, this software does not need to include features to address the fact that some data may be missing. (The system can, if desired, adjust its responses when data is marked as being estimated instead of observed.) Since the TMC Management System likely consists of a number of modules performing different operations (e.g., a module for managing DMS messages, a module for managing 511 messages, a module for managing web-based traveler information), inserting travel time estimates before the data enters the TMC Management System simplifies the overall design of the system. (Travel time estimation occurs once and is used many times.) The savings are compounded when one considers that other traffic data users that receive data from the TMC Management System also benefit from the estimated travel times.
Another benefit of this approach is that it creates a mechanism for testing features in the TMC Management System independently of the field devices. One could disconnect the field devices from the Travel Time Manager and create a travel time estimation module that fed in pre-defined travel time values meant to simplify testing. (A similar approach was used to test the CRS, but required development of an ad hoc process for feeding static travel time data to the CRS. See Section 2 for more information.) The well-defined interface between the Travel Time Manager and the TMC Management System also provides a mechanism for testing these modules independently.
3.6. Approaches to Reducing Maintenance Costs
During the course of the iFlorida evaluation, several ideas were discussed for reducing the overall costs of owning and operating traffic monitoring equipment. These ideas are discussed below.
- Consider total cost of ownership during the procurement process. The contract for the iFlorida field devices included the cost for deploying the field devices and providing a maintenance warranty for two years after the deployment was complete. The expected cost of maintenance after this two-year warranty period would not be reflected in the procurement cost. Because of this, a system that has a lower procurement cost could have a higher life-cycle cost. In particular, a system that was less expensive to install but had higher maintenance costs could result in a low procurement cost (because only two years of maintenance costs are included), but a high life-cycle cost. A department may want to compare the full life-cycle cost of a deployment rather than the the procurement cost when evaluating deployment contracts.
- Consider participating in the FHWA ITS Benefits and Costs Databases. Considering the full life-cycle cost of a deployment requires estimating future failure rates for installed equipment and the costs of repairs. A good approach for doing so is to obtain information from other deployments of the technologies. FHWA established the ITS Costs database to help departments share information about the costs of deploying and maintaining ITS field equipment. Because of limited participation by agencies deploying ITS technologies, the information in this database is limited. Agencies should consider tracking costs and submitting their costs to this database so as to benefit others deploying similar technologies.
- Consider tracking the causes of equipment failures to help decrease maintenance costs. FDOT used a spreadsheet to track failed equipment and assign work orders for repairs. FDOT's maintenance contractor was expected to identify the root cause of failures that occurred. However, they did not provide this information to FDOT. This made it difficult for FDOT to identify common causes of failures so that they could take action to reduce the prevalancy of those causes. Even though FDOT was proactive in trying approaches to reduce failures, such as adding surge protectors and lightening protection. The lack of ready access to detailed failure data made it difficult to determine if these approaches were successful.
3.7. Summary and Conclusions
The iFlorida Model Deployment resulted in a significant increase in the number, types, and geographic distribution of field equipment that FDOT D5 was required to maintain. In January 2004, D5 was maintaining about 240 traffic monitoring stations. In 2007, this had increased to about 650 stations. This rapid increase in maintenance responsibility resulted in some problems with maintaining the equipment. The MTBF for most traffic monitoring stations was between 30 and 60 days. The availability of high priority equipment was typically available 80 to 90 percent of the time, with lower priority equipment having lower levels of availability.
One of the maintenance problems FDOT faced was that the contracts for deploying the field devices did not include requirements related to how the equipment would be monitored. This meant that FDOT had to rely on manual methods for monitoring whether field devices were operational. In the case of the arterial toll tag readers, almost half of the readers had failed before manual monitoring began. When monitoring did begin, it required a significant amount of FDOT staff time to poll each individual reader each day to identify readers that had failed. The same held true with the other deployed devices-FDOT staff was required each day to review the status of each field device and copy status information into spreadsheets used to monitor system status. Thus, even though FDOT had taken steps to reduce the demands on its maintenance staff by requiring warranties on much of the iFlorida equipment, monitoring the equipment for failures still required a significant amount of FDOT staff time. The amount of time required was larger when systems were first brought online, as FDOT developed procedures to integrate the new equipment into its monitoring and maintenance programs.
During this process, FDOT did identify a number of lessons learned that might benefit other organizations planning on a significant expansion of their traffic monitoring field equipment:
- Establish a well-defined process for monitoring and maintaining field
equipment before beginning a significant expansion in the amount of field
equipment deployed.
- Consider streamlining the existing monitoring and maintenance process before expanding the base of field equipment. A simple system that works well for a small amount of deployed equipment may be less effective as the amount of deployed equipment increases.
- Ensure that the requirements for new field equipment include steps to
integrate the equipment into the monitoring and maintenance process.
- These requirements should include tools and/or procedures for monitoring the equipment to identify failures that occur. In the case of the arterial toll tag readers, the deployment contractor provided no such tools and weak documentation. FDOT had to develop procedures for monitoring the equipment after it had been deployed, and it took several months before FDOT had developed an efficient process for doing so.
- Newly deployed equipment should be integrated into the monitoring and maintenance process incrementally, as soon as each piece of equipment is deployed. The arterial toll tag readers were deployed and inspected over a period of four months in early 2005, but FDOT did not begin developing procedures to monitor that equipment until the deployment project was completed in May 2005. By the time FDOT began monitoring this equipment, almost half the devices had failed. Despite the fact that the deployment contractor was responsible for the equipment during this period, it appeared that the contractor did not monitor the equipment for failures.
- These requirements should include maintaining a sufficient inventory of spare parts so that repairs can be made quickly. The contract placed requirements on the repair time for serviced parts, but the contractor failed to meet these requirements because insufficient replacement parts were available to make the necessary repairs. As a result, when FDOT discovered the large number of failures in the arterial toll tag readers, it took many months before a sufficient number of replacement parts were available to conduct repairs.
- Plan for the increased demands on maintenance staff and contractors as new systems are brought online. If possible, avoid bringing several new systems online at the same time.
- Expect traffic monitoring equipment to be down part of the time. At FDOT,
key equipment was available 80 to 90 percent of the time, with other equipment
available less often.
- Decreasing the time to repair equipment is an effective approach for increasing the percent of time that equipment is available.
- Providing a mechanism to continue operations when equipment fails (e.g., redundant equipment, replacement of missing data from failed equipment with estimates based on historical data and/or operator observations) is needed.
- One important source of failure in a fiber network is fiber cuts and
damaged network equipment. FDOT identified a number of ways to decrease
the number of fiber cuts that occur or the time required to repair cuts
when they do occur.
- Ensure that the ITS Group is integrated in the construction planning
process so that protection of fiber and network equipment is considered
from the start in construction projects.
- Becoming integrated in the construction process may require both working with transportation department construction contract management staff and nearby city and county governments, which may be responsible for managing some construction projects.
- Consider installing fiber in visible, above ground locations (such as along fence lines) rather than underground. If installed underground, consider locating fiber near to existing underground utilities that construction contractors are accustomed to avoiding or near existing aboveground features (e.g., a fence line for a limited access highway) that serves as a visible marker that contractors will avoid.
- When prolonged construction activities are planned, consider re-locating
fiber and equipment so as to avoid the potential for damage during construction.
- Because contractors will typically include a reserve for repairing damage to fiber in their bids, the cost of re-locating fiber and equipment may be offset by lower costs for the construction project.
- Ensure that the ITS Group is integrated in the construction planning
process so that protection of fiber and network equipment is considered
from the start in construction projects.
- Because traffic monitoring equipment will fail, systems that rely on
data from this equipment should be designed to work well when equipment
fails.
- Historical data can be used to estimate travel times during normal operating conditions.
- Because TMC operators often have secondary sources of traffic data available to them (e.g., traffic video), they can estimate travel times or verify that estimated travel times based on historical data are accurate.
- Tools for replacing missing data with estimated values should be
implemented early in the development process.
- Time spent developing a single tool to replace missing data with estimated values is likely less than the time that required to develop processes to deal with missing data in every module that uses that data.
- A tool to replace missing data with estimated values will allow the TMC software to be tested before field data is available.
- A tool to replace missing data with estimated values will allow the TMC software to be tested independently of the field equipment.
FDOT did face significant challenges in maintaining its network of field devices, particularly when several new systems were brought online simultaneously in the summer of 2005. Noticeable drops in the availability of both new and existing field equipment occurred during that period. By the start of 2006, FDOT had reached relatively stable levels of availability for key field equipment and had developed a well-defined process for monitoring and maintaining that equipment. By 2007, the stability of FDOT's maintenance practices allowed the agency to spend more time focusing on ways to improve equipment availability. FDOT took a number of steps to reduce downtime in its fiber network. The agency also started experimenting with changes to equipment configurations that might improve reliability, such as removing lightning rods from some locations and improving grounding in others. FDOT was also transitioning to new software to manage TMC operations, and was including lessons learned with regard to how to handle missing data in the design of this software.
1 The information on the number of traffic management devices comes from maintenance spreadsheets used by FDOT to track the operational status of their field equipment.
2Several months after developing this process, FDOT simplified it by focusing on the number of tag reads that had been successfully transmitted to the toll tag server. This reduced the time required to review the readers to about one hour per day.
3The spreadsheets describe the operational status of the equipment at the time FDOT tested it-typically once per weekday in the morning with no tests on weekends. The spreadsheets also sometimes used a single spreadsheet cell to indicate whether any of several pieces of equipment had failed at a single location. These factors limit the accuracy of the reported reliability results.