
UCR July 2017-September 2017 (FY 2017, Q4)
PDF Version 994KB
PDF files can be viewed with the Acrobat® Reader®
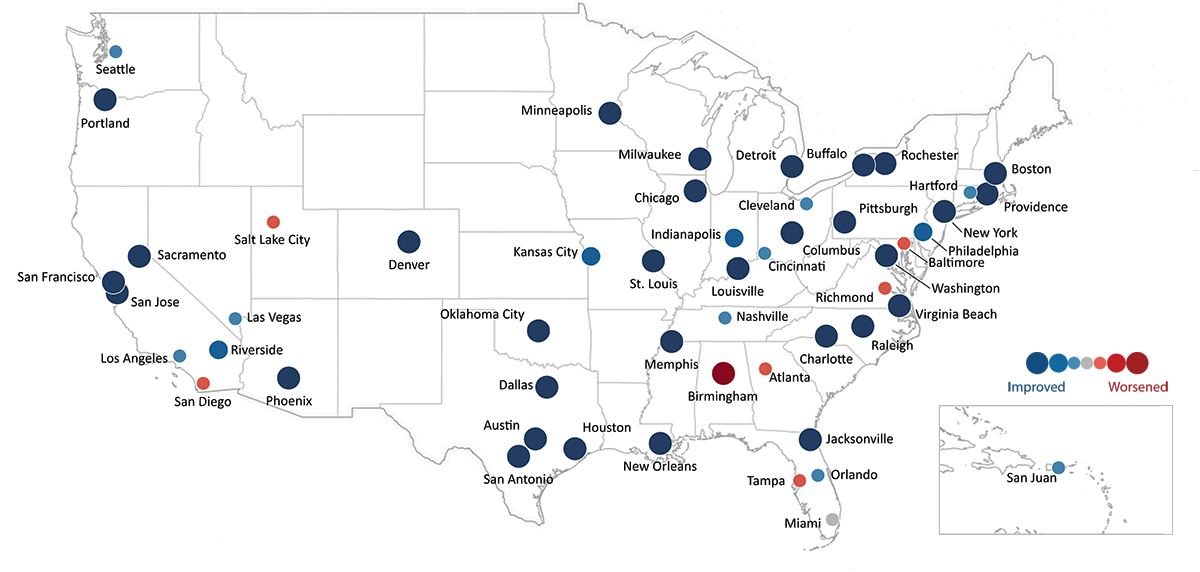
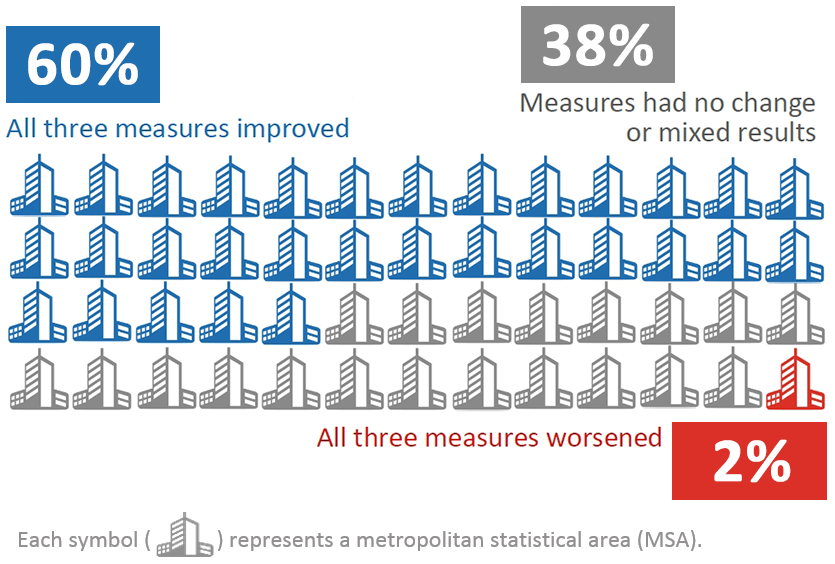
A Snapshot of Year-to-Year Congestion Trends in the U.S. for July 2017 through September 2017.
Congested Hours

-27 minutes
Average duration of daily congestion
Travel Time Index
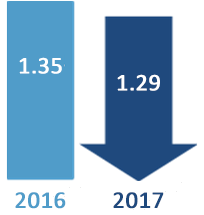
-6 point
Peak period vs. off-peak travel times
Planning Time Index
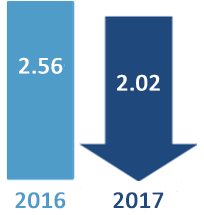
-54 points
Unreliability (variability) of travel
2017 performance measures use NPMRDS v2 data with 2015 volumes.
| City (MSA) | Congested Hours * | Travel Time Index * | Planning Time Index * | % Complete Data | |||
|---|---|---|---|---|---|---|---|
| 2017 | Change from 2016 | 2017 | Change from 2016 | 2017 | Change from 2016 | ||
| Atlanta, GA | 4:47 | +0:22 | 1.34 | +2 | 2.20 | -14 | 96% |
| Austin, TX | 4:54 | -0:17 | 1.37 | -5 | 2.14 | -57 | 96% |
| Baltimore, MD | 6:19 | +0:43 | 1.25 | +1 | 2.03 | -23 | 95% |
| Birmingham, AL | 2:01 | +1:25 | 1.10 | +5 | 1.60 | +29 | 99% |
| Boston, MA | 5:11 | -1:14 | 1.31 | -5 | 2.07 | -65 | 96% |
| Buffalo, NY | 4:33 | -0:43 | 1.13 | -2 | 1.60 | -36 | 90% |
| Charlotte, NC | 3:16 | -0:19 | 1.19 | -2 | 1.83 | -34 | 98% |
| Chicago, IL | 5:37 | -2:24 | 1.35 | -4 | 2.18 | -22 | 98% |
| Cincinnati, OH | 3:01 | -0:06 | 1.19 | +2 | 1.81 | -13 | 98% |
| Cleveland, OH | 2:26 | +0:01 | 1.13 | -1 | 1.58 | -31 | 97% |
| Columbus, OH | 2:35 | -0:22 | 1.14 | -2 | 1.65 | -28 | 95% |
| Dallas-Fort Worth, TX | 4:15 | -1:54 | 1.26 | -9 | 2.02 | -96 | 94% |
| Denver, CO | 6:18 | -0:34 | 1.35 | -1 | 2.20 | -55 | 97% |
| Detroit, MI | 3:20 | -0:41 | 1.19 | -3 | 1.87 | -53 | 96% |
| Hartford, CT | 2:41 | +0:05 | 1.12 | -1 | 1.55 | -25 | 94% |
| Houston, TX | 5:27 | -0:17 | 1.27 | -9 | 2.15 | -59 | 93% |
| Indianapolis, IN | 2:14 | -0:37 | 1.13 | 0 | 1.57 | -9 | 96% |
| Jacksonville, FL | 3:11 | -0:18 | 1.16 | -1 | 1.71 | -51 | 96% |
| Kansas City, MO | 2:59 | -0:06 | 1.12 | 0 | 1.60 | -27 | 94% |
| Las Vegas, NV | 3:28 | -0:19 | 1.20 | +3 | 1.73 | -20 | 98% |
| Los Angeles, CA | 9:10 | +0:05 | 1.65 | -3 | 2.69 | -73 | 97% |
| Louisville, KY | 1:56 | -1:08 | 1.09 | -7 | 1.47 | -69 | 96% |
| Memphis, TN | 2:37 | -1:16 | 1.11 | -12 | 1.54 | -43 | 98% |
| Miami, FL | 5:55 | +0:20 | 1.31 | 0 | 2.18 | -40 | 96% |
| Milwaukee, WI | 3:27 | -0:35 | 1.19 | -3 | 1.78 | -33 | 97% |
| Minn.-St. Paul, MN | 5:07 | -0:58 | 1.29 | -2 | 2.04 | -46 | 96% |
| Nashville, TN | 2:47 | -0:05 | 1.20 | +2 | 1.87 | -5 | 97% |
| New Orleans, LA | 3:53 | -0:19 | 1.17 | -1 | 1.82 | -59 | 96% |
| New York, NY | 6:45 | -2:20 | 1.31 | -4 | 2.09 | -50 | 95% |
| Oklahoma City, OK | 1:59 | -0:18 | 1.09 | -2 | 1.48 | -32 | 96% |
| Orlando, FL | 3:48 | -0:04 | 1.20 | +2 | 1.82 | -15 | 96% |
| Philadelphia, PA | 4:46 | -0:56 | 1.22 | 0 | 1.79 | -29 | 96% |
| Phoenix, AZ | 2:14 | -0:58 | 1.19 | -4 | 1.67 | -71 | 97% |
| Pittsburgh, PA | 3:52 | -0:55 | 1.14 | -2 | 1.61 | -50 | 94% |
| Portland, OR | 7:05 | -0:44 | 1.48 | -3 | 2.53 | -66 | 96% |
| Providence, RI | 4:12 | -0:46 | 1.13 | -3 | 1.62 | -37 | 94% |
| Raleigh, NC | 1:55 | -0:24 | 1.14 | -1 | 1.74 | -18 | 98% |
| Richmond, VA | 2:05 | +0:04 | 1.07 | +1 | 1.37 | -15 | 97% |
| Riverside-San Bern., CA | 4:20 | -0:22 | 1.24 | 0 | 1.80 | -20 | 100% |
| Rochester, NY | 2:32 | -0:29 | 1.08 | -1 | 1.42 | -23 | 92% |
| Sacramento, CA | 4:08 | -0:01 | 1.22 | -5 | 1.83 | -36 | 98% |
| Salt Lake City, UT | 3:16 | +0:09 | 1.20 | +3 | 1.83 | -7 | 98% |
| San Antonio, TX | 3:13 | -0:13 | 1.18 | -3 | 1.75 | -34 | 98% |
| San Diego, CA | 4:20 | +0:17 | 1.31 | +3 | 2.10 | -43 | 97% |
| San Francisco, CA | 6:30 | -0:44 | 1.44 | -6 | 2.33 | -74 | 98% |
| San Jose, CA | 5:13 | -0:18 | 1.38 | -9 | 2.20 | -91 | 96% |
| San Juan, PR | 4:18 | +0:47 | 1.40 | -9 | 1.88 | -147 | 50% |
| Seattle, WA | 6:59 | -0:53 | 1.48 | +7 | 2.40 | -39 | 94% |
| St. Louis, MO | 2:08 | -1:12 | 1.09 | -7 | 1.47 | -64 | 95% |
| Tampa, FL | 2:59 | +0:07 | 1.21 | +1 | 1.88 | -29 | 95% |
| Virginia Beach, VA | 5:15 | -0:42 | 1.21 | -2 | 1.90 | -60 | 96% |
| Washington, DC | 6:53 | -0:32 | 1.37 | -8 | 2.25 | -71 | 96% |
Notes:
Blue bolded values (with - sign) indicate improving conditions; red italics (with + sign) indicate worsening conditions.
Comparison of 2017 to 2016 is for the same three-month period (July - September). % Complete Data compares the reported congestion data for that MSA to what should have been available for the designated roads and time periods.
*2017 performance measures use NPMRDS v2 data with 2015 volumes.
For More Information
Please contact Rich Taylor at rich.taylor@dot.gov.